KWEB Options Outlook: Will the $22.50 Put Wall Hold Into November 6?
Options price roughly a ±$0.92 move for KWEB into the November 6 expiration. Call-heavy flow is running into a stubborn downtrend, and the $22.50 put wall is the line that matters.
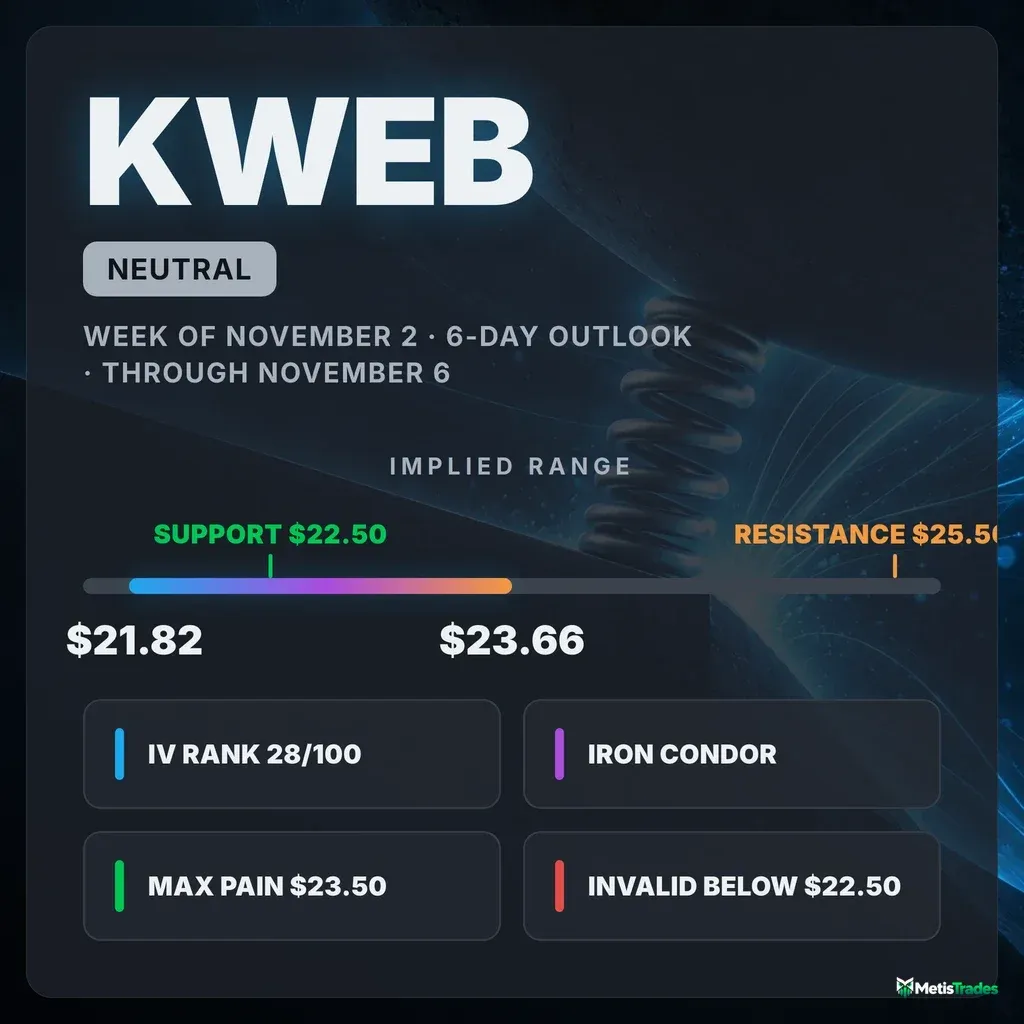
The options market implies a $21.82–$23.66 range for KWEB into the November 6 expiration. Below: what is driving that range, where the levels sit, and three defined-risk ways to trade it, plus a case for not trading at all.
Published Saturday, October 31, 2026 · Data as of Friday, October 30, 2026 close
Explore the live KWEB options data in the Detailed Options Analyzer →
Quick answer
| Item | Answer |
|---|---|
| Market bias | Neutral |
| Options-implied range (into Nov 6) | $21.82 – $23.66 (±4.05%, about ±$0.92) |
| Major support | $22.50 (Nov 6 put wall) |
| Major resistance | $25.50 (Nov 6 call wall) |
| Max pain (Nov 6) | $23.50 |
| Dealer gamma regime (estimate) | Negative for the Nov 6 expiration, so hedging tends to amplify moves; flip level ≈ $26 |
| Volatility condition | Neutral. IV rank 27.99/100 · premium fair: options priced ~6.5 vol pts above delivered movement |
| Technical check | Mixed (bearish, 3-day and 6-day). Chart-model targets $22.58 and $22.50 sit inside the implied range. |
| Best-fitting strategy | Narrow Nov 6 iron condor ($21.50/$22 puts, $23.50/$24 calls), only if you accept wide quotes |
| Analysis invalidated if | KWEB closes below $22.50 |
1 · What matters today
Our read on KWEB into November 6 is Neutral.
On the surface, options traders are leaning bullish. They are buying calls at a fast clip and adding new call contracts while put positions shrink. But this is happening while the fund keeps sliding: it sits less than 1% above its 52-week low and below every major moving average. In that setting, the call buying reads more like bottom-fishing than conviction.
The options market is pricing a move of about $0.92 either way, which puts the range at roughly $21.82 to $23.66. That range is anchored by two levels:
- A large pile of open puts at $22.50, just below the $22.74 close.
- The "max pain" strike at $23.50 (explained below).
The one level that changes the picture is $22.50. A close below it would be a new 52-week low through the biggest put position. The technical models lean bearish, but their targets still fall inside the options range.
2 · What the options market is pricing
What changed this week
KWEB closed Friday at $22.74, down 1.73% over five sessions and down 4.69% over twenty.
The bigger trend reads agree, and they point lower:
- The past month is bearish.
- The fund is down about 14.8% over the past ~50 sessions.
- Only the past week reads flat.
Flow has moved the other way. Puts traded at just 0.34 contracts for every call on Friday, close to the 7-day average of 0.31 and the 14-day average of 0.36. In other words, call-heavy trading has been the norm all week, not a one-day spike.
Open interest (OI, the contracts currently held open) moved as follows:
- Put/call OI held at 0.40, against a 7-day average of 0.41.
- Calls added 8,740 contracts in a day while puts shed 8,925.
- The November 20 $24 calls added 2,820 contracts on 6,558 traded.
- The November 6 $23 calls nearly doubled, from 1,091 to 2,081 open.
On the settled side, Friday's expiring $23.50 puts shed 3,508 contracts of open interest into the close.
The momentum gauge also flipped on Friday. Its fast line crossed back above its slow line, the first bullish turn since October 16. That is a fresh turn, but it runs against a price trend that has not bent yet.
Expected move
The expected move is the move the options market is pricing in, derived from what straddles cost.
KWEB's chain has a quote-quality problem. For most expirations, the at-the-money call and put prices disagree too much to blend into one clean read. That includes November 6, where the call side shows 38% implied volatility and the put side 18%.
So we scale the chain's interpolated at-the-money IV of 29.23% to each date instead. For seven days, that works out to ±4.05%, or about ±$0.92 around the $22.74 snapshot price. December 11 is the one expiration that priced cleanly, so its number comes straight from the chain.
| Expiration | Implied move | Range around $22.74 |
|---|---|---|
| Nov 6 (scaled from 29.23% ATM IV) | ±4.05% | $21.82 – $23.66 |
| Nov 13 (scaled) | ±5.72% | $21.44 – $24.04 |
| Nov 20 (scaled) | ±7.01% | $21.15 – $24.33 |
| Dec 11 (direct chain read) | ±10.85% | $20.27 – $25.21 |
The rungs scale smoothly with time. Nothing in the curve flags a specific dated event inside the window.
Volatility
Implied volatility (IV) is the market's estimate of how much KWEB will move, baked into option prices. At-the-money IV is 29.23%.
- IV rank: 27.99/100. IV rank shows where today's IV sits versus the past year. A reading of 28 means options are cheaper than about 72% of the past year's readings.
- Recent direction: roughly flat. IV is up 0.5% on the day and 1.24% over five sessions, but down 8.33% over thirty.
- Versus its averages: slightly below both its 30-day average (29.67%) and its 90-day average (30.59%).
- Term structure: comparing option prices across expiration dates is not possible on the front month today, because Friday was an expiry day. The ~60-day IV sits at 28.08%.
The striking reading is how quiet the fund has become compared with its own history ("unusual" here means unusual for KWEB, not versus the broader market). Five-day realized movement has collapsed to roughly a third of its 20-day pace, an unusually sharp slowdown for this name. Ten-day realized volatility is just 15.25%. Coiled conditions like this often precede a range break in one direction or the other.
Is premium rich or cheap? The volatility risk premium is the gap between how much movement options are priced for and how much KWEB has actually delivered. When it is positive, option sellers have been collecting more than realized movement cost them. Right now:
- Options are priced about 6.5 vol points above KWEB's 20-day realized volatility of 22.7%.
- That gap is richer than about two-thirds (68%) of this fund's own recent readings.
Pair that with an IV rank of 28 and premium looks fair, not a giveaway. Selling is mildly favored over buying, but there is no strong edge either way. The gap has sat in the 5–6.5-point area most of the past two weeks, apart from two one-day IV spikes on October 19 and October 28 that reversed immediately.
Skew and sentiment
Skew describes the fact that puts and calls the same distance from the stock price don't cost the same. When puts are pricier, traders are paying up for crash protection.
KWEB currently shows the reverse. The 25-delta calls carry 46.3% IV against 33.5% for the 25-delta puts, so calls are running 12.8 vol points richer. The 60-day norm for this fund is 4.9 points, which makes today's call premium unusually stretched. Over the past seven sessions skew averaged 6.5 points, so most of that stretch has built in the last few days.
Put the pieces together and the picture is clear:
- Call buyers are paying up.
- Put demand is thin.
- The put/call volume ratio of 0.34 is about 30% below its 60-day median.
Sentiment in short-dated options is strongly positive. The 0–7 day group reads +77, driven entirely by call OI building and put OI unwinding. The 7–30 day group is close to flat at +5, and the overall tone reads as broadly bullish.
The caveat is context. This is enthusiasm into a fund pinned near its yearly low. Over the past 10 sessions, price fell about 6.7% while this positioning grew steadily more call-friendly. That is classic dip-buying behavior, and it has not yet shown up in the price.
The key levels map
| Level | Price | Why it matters |
|---|---|---|
| 200-day moving average | $27.99 | Long-term trend line, 18.75% above the close |
| Swing resistance | $26.12 | Upper price-pivot cluster |
| Gamma flip (estimate) | $26 | One rough estimate of where hedging shifts from amplifying to cushioning; far above spot |
| 100-day MA / swing resistance | $25.63 | Overlapping trend and pivot level |
| Call wall (Nov 6) | $25.50 | Biggest pile of Nov 6 call OI (3,594 contracts); well outside the implied range |
| Swing resistance | $25.02 | Pivot cluster |
| 50-day moving average | $24.68 | Medium-term trend line |
| Swing resistance | $24.16 | Pivot cluster |
| Whole-chain put wall / largest gamma strike | $24 | Heaviest put OI across all expirations (82,435) and the most gamma-dense strike |
| 20-day moving average | $23.95 | Short-term trend line, 5% above the close |
| Swing resistance | $23.83 | Nearest overhead pivot |
| Max pain (Nov 6) | $23.50 | Where the most Nov 6 option value expires worthless |
| Second-largest gamma strike | $23 | Heavy put and call OI concentration |
| Oct 29 gap-down zone | $22.55 – $22.99 | Unfilled gap overhead from the latest down-gap |
| 52-week low | $22.54 | The fund sits just 0.89% above it |
| Put wall (Nov 6) | $22.50 | Biggest pile of Nov 6 put OI (3,924 contracts); the line of the week |
The aggregate chain tells a different story overhead. Its heaviest call strike is $35, far from the Nov 6 call wall of $25.50. Those long-dated calls don't affect this six-day window.
Positioning and unusual flow
Market makers hedge the options they've sold. Depending on how their positions net out, that hedging can either dampen or amplify price moves.
One rough estimate puts the November 6 expiration's own gamma in negative territory, meaning hedging there tends to amplify moves. The whole chain nets positive, but that cushion is concentrated in later expirations. Spot is also sitting about 14% below the $26 flip estimate, unusually far below it for this fund. For the next six days, the amplifying read is the one that applies.
Flow worth noting (all live contracts):
- November 27 $22.50 puts: 4,783 contracts traded against only 123 open, about $273,000 in premium. Open interest barely moved, which suggests the volume was largely opened and closed the same day.
- December 18 $25 calls: 9,036 contracts, about $294,000 in premium, with OI flat. That looks like a roll or repositioning rather than fresh bets.
- November 13 $23.50 calls: 1,262 contracts against 39 open, a small strike drawing unusual attention just above max pain.
3 · Technical check
Both chart-model reports are fresh, generated the day after Friday's close. Both lean bearish:
- 3-day report (checkpoint November 3): projects $22.58, with a model range of $22.20 to $23.00.
- 6-day report (to November 6): projects $22.50, with a model range of $22.20 to $23.20.
Both targets sit inside the options-implied $21.82–$23.66 range. The models are not calling for a bigger move than options price; they are tilting the same range lower.
Against our neutral read, that makes the technical picture mixed. It does not break the range thesis, but it agrees with the down-trend half of it. The models' dominant scenario is a breakdown of a tight bearish pennant below $22.65. They name support at $22.50–$22.55, resistance at $22.95, and invalidate the bearish case on a close above $22.95.
The most decisive indicator reads:
- Sellers still hold control, but the trend-strength gauge is fading from 42 to 31.5.
- Money-flow has rolled over from strongly positive to slightly negative.
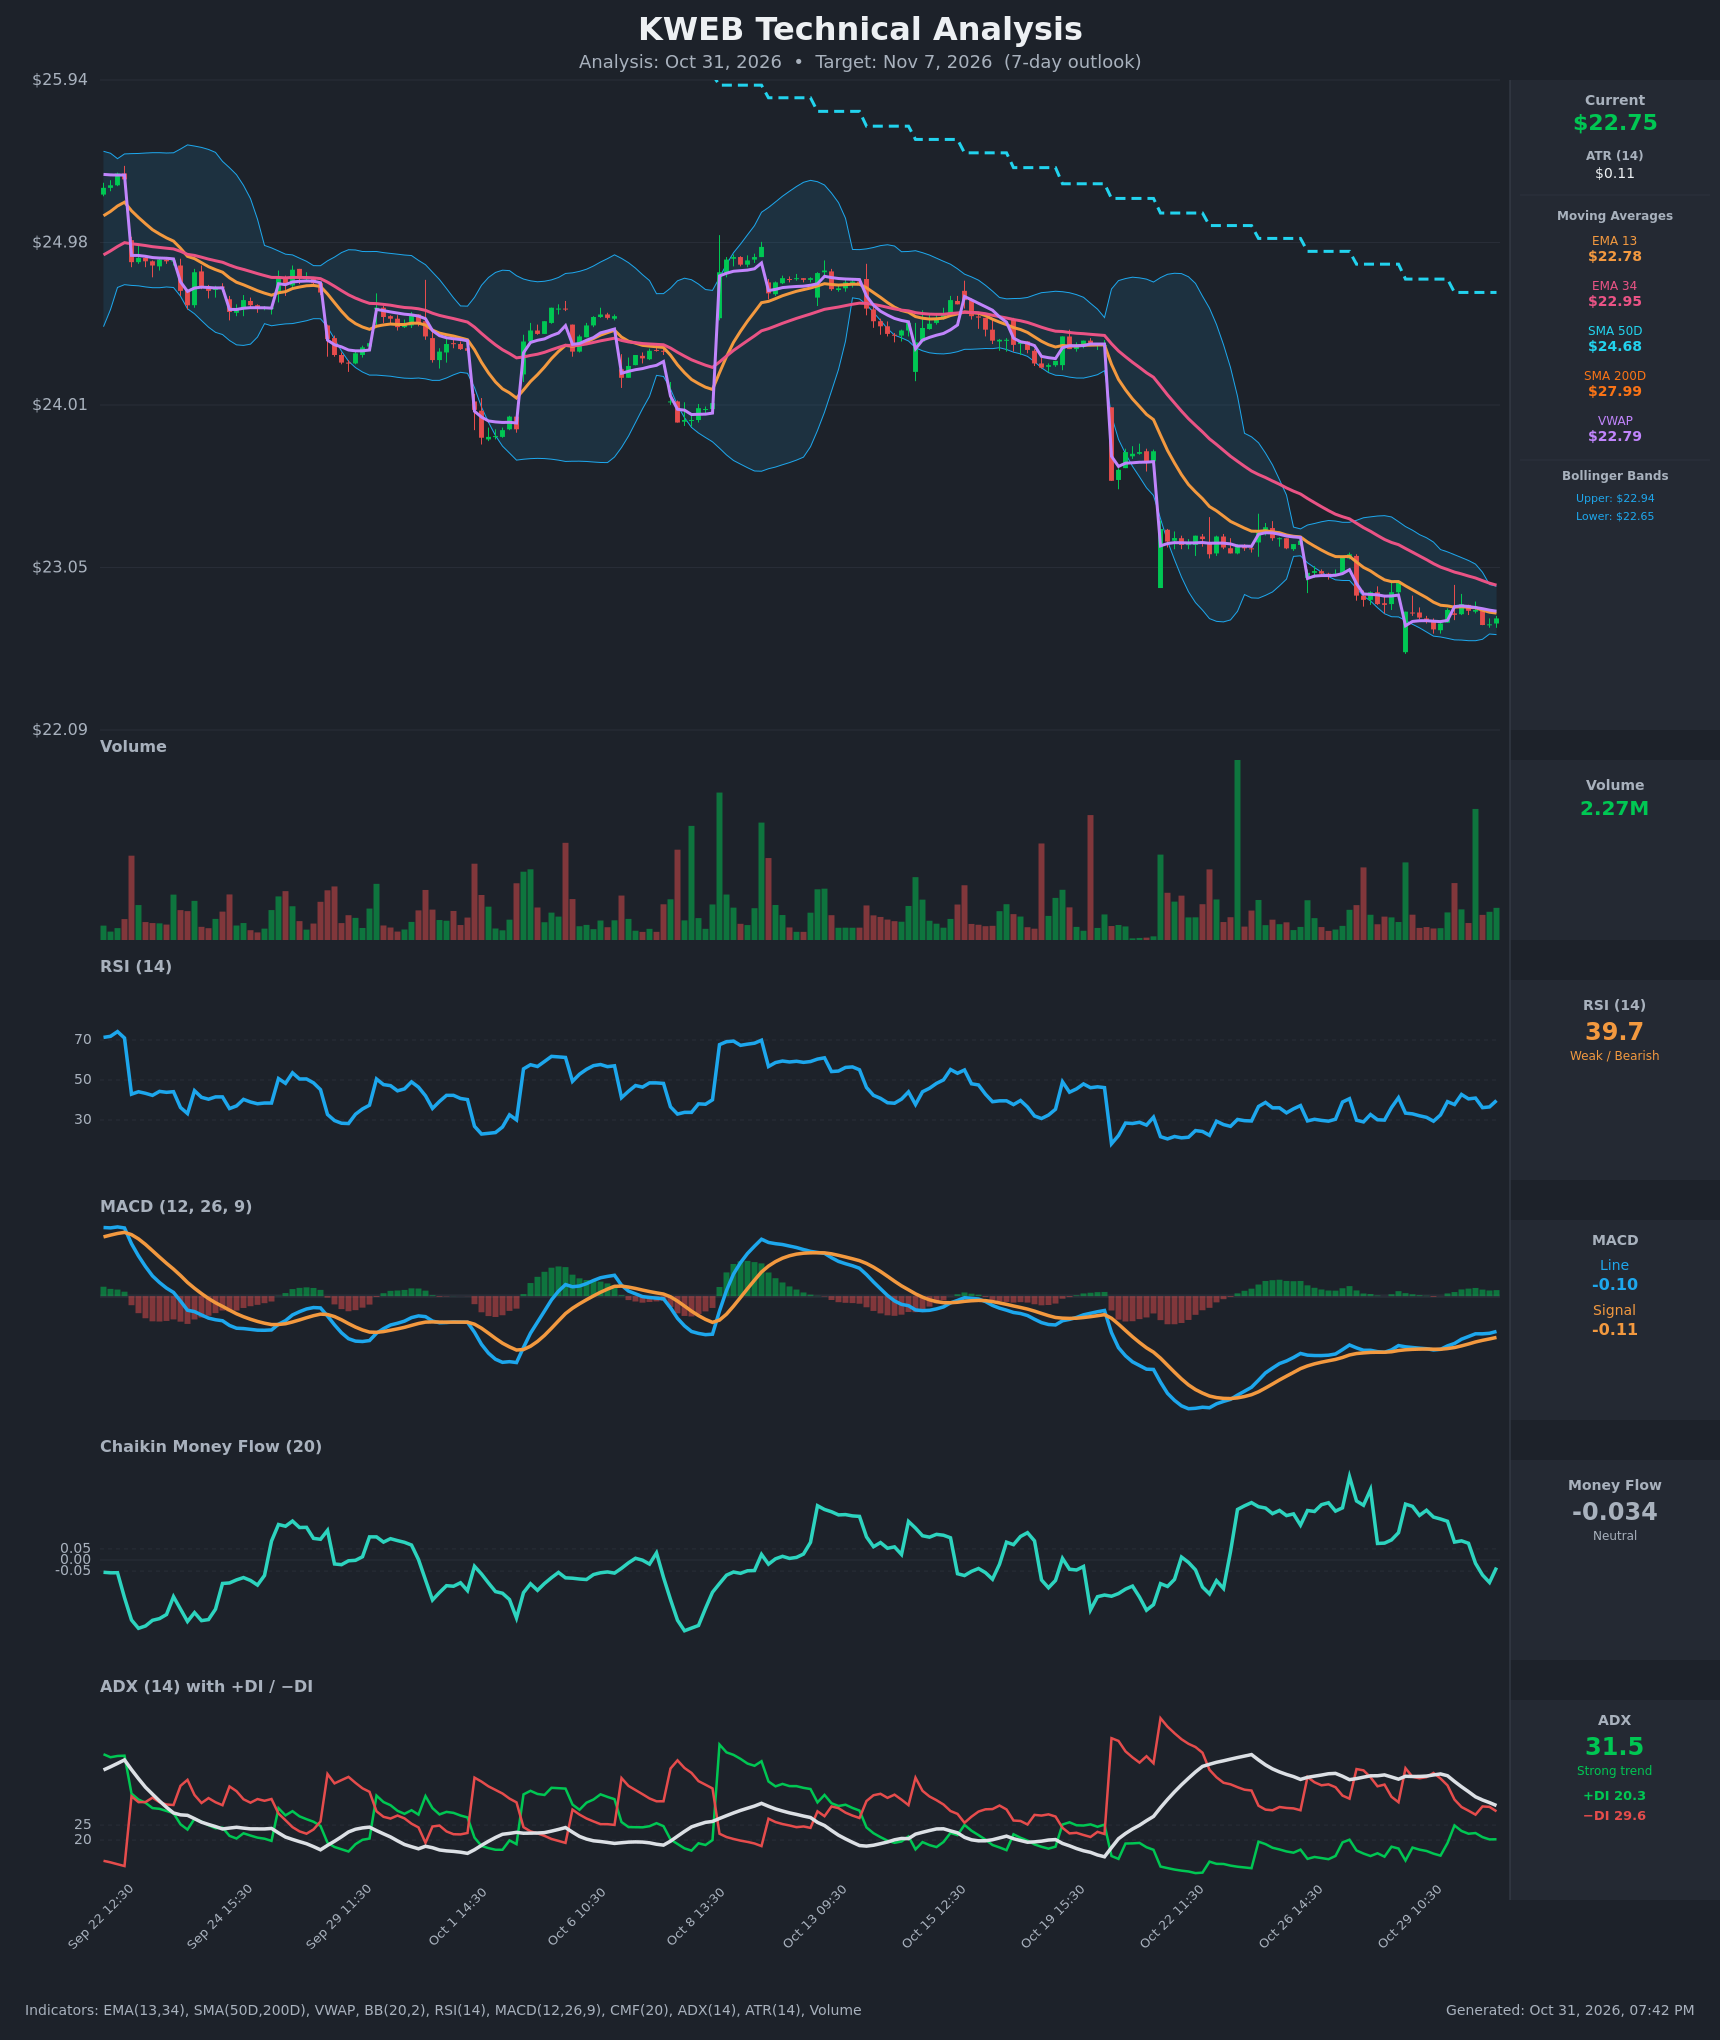
Model vs. Market: The options market implies $21.82–$23.66 into November 6; the 6-day technical model targets $22.50. That target sits right on the put wall, so the expiration is effectively a test of whether options support or chart momentum wins.
The technical reports shaped strike selection below in two ways. The condor's short put sits at $22, beneath both model targets. The bearish structure's profit zone is centered on the $22.50 area.
Full technical write-ups: 3-day report → · 6-day report →
4 · Three ways the week can go
If KWEB pushes above the call wall ($25.50): This would take a move far outside the priced range. On the way, the fund would have to clear the 20-day average ($23.95), the 50-day ($24.68), and the dense $24 strike. Call positioning thins out above $25.50 until the $26 flip estimate. In practice, the realistic upside case stalls first at $23.50 to $23.83.
If KWEB drifts between the walls: This is the pin case. Max pain at $23.50 sits $0.76 above spot. Expiring open interest at $23 and $23.50 tends to draw price toward that zone into Friday, November 6, especially if the recent call buying keeps a bid under the fund. Unusually low realized movement supports a slow grind rather than a lurch.
If KWEB breaks below the put wall ($22.50): This is the acceleration case. A close below $22.50 is also a new 52-week low. With the Nov 6 expiration estimated in negative gamma, hedging can add to selling rather than absorb it. The lower rail near $21.82 then comes into play, and the chart models' $22.20 floor would likely give way.
5 · Three defined-risk structures
Prices are end-of-day midpoints as of October 30, 2026. All structures are hypothetical. Verify live prices before trading, because these will be stale by the open. KWEB's November 6 quotes are wide in percentage terms on every strike, so expect fills worse than mid.
If you expect the range to hold: Nov 6 iron condor
- Trade: Sell the Nov 6 $22/$21.50 put credit spread and the Nov 6 $23.50/$24 call credit spread. You collect premium and are betting KWEB stays between the short strikes.
- Credit/Debit: $0.12 credit ($0.035 puts + $0.085 calls)
- Max profit: $12
- Max loss: $38
- Break-evens: $21.88 and $23.62
- Why it fits: Both short strikes sit inside the ±$0.92 implied range. The $23.50 short call is the Nov 6 max-pain strike, and the $22 short put sits below the $22.50 put wall and both chart targets. Premium runs about 6.5 vol points over delivered movement, a fair (not rich) cushion.
- Makes sense only if: KWEB's recent quiet persists and the put wall holds.
- Invalidated if: KWEB closes below $22 or above $23.50.
- Managing it: Close at about half the credit ($0.06). Exit regardless by the November 5 close to avoid expiration-day pin risk. With $12 at stake, commissions can eat the edge.
- Liquidity note: The $23.50 calls traded 4¢ wide and the $24 calls 3¢ wide. The $22 puts were 8¢ wide and the $21.50 puts 13¢ wide. Those gaps are large relative to a 12¢ credit, so treat the mid as optimistic.
- Analyze this position →
If you lean bullish: Nov 6 $23/$23.50 bull call spread
- Trade: Buy the Nov 6 $23 call and sell the Nov 6 $23.50 call. You pay a debit and are betting on a lift toward max pain.
- Credit/Debit: $0.155 debit ($0.285 − $0.13)
- Max profit: $34.50, reached at $23.50 or higher
- Max loss: $15.50
- Break-even: $23.16
- Why it fits: It targets the $23.50 max-pain pin. It also rides the call-heavy flow and the fresh momentum turn, while capping cost against the downtrend.
- Makes sense only if: KWEB reclaims the $22.95 technical resistance early in the window.
- Invalidated if: KWEB closes below $22.50.
- Managing it: Short-term flow is fighting a longer bearish trend, so take profits early, near $0.30. Exit by the November 5 close.
- Liquidity note: The $23 calls traded 7¢ wide (about 25% of mid) and the $23.50 calls 4¢ wide. These are the tightest Nov 6 strikes, but still costly to cross.
- Analyze this position →
If you lean bearish: Nov 6 $23/$22 bear put spread
- Trade: Buy the Nov 6 $23 put and sell the Nov 6 $22 put. You pay a debit and are betting on a break of the put wall.
- Credit/Debit: $0.37 debit ($0.48 − $0.11)
- Max profit: $63, reached at $22 or lower
- Max loss: $37
- Break-even: $22.63
- Why it fits: It lines up with both chart models' $22.50–$22.58 targets and the negative-gamma estimate below the wall. Puts are also unusually cheap versus calls right now.
- Makes sense only if: KWEB closes below $22.65, the technical breakdown trigger.
- Invalidated if: KWEB closes above $22.95.
- Managing it: Take most of the gain if KWEB trades near $22.20–$22.30. Exit by the November 5 close.
- Liquidity note: The $23 puts traded 24¢ wide (about 50% of mid) and the $22 puts 8¢ wide. Work limit orders.
- Analyze this position →
If none of these: no trade
Standing aside is a strong option for KWEB this week, for three reasons:
- Premium is only fair. It sits around the 68th percentile of its own recent history, with IV rank at 28, so sellers aren't being paid a clear premium for the risk.
- Quotes are poor. Several at-the-money quotes fail a basic call-put consistency check, and every Nov 6 strike trades wide enough to swallow much of a small credit or debit.
- The signals disagree. Bullish options flow is running against a bearish price trend, which argues for no directional bet at all.
If you can't get fills near the midpoints quoted here, the structures no longer pay enough to justify the risk.
6 · Quick FAQ
What is KWEB's expected move this week? About ±$0.92 (±4.05%) into November 6, implying $21.82–$23.66. This is scaled from the chain's 29.23% at-the-money IV as of October 30.
Is KWEB expected to go up or down over the next week? Options positioning as of October 30 reads neutral. Call-heavy flow is pushing against a firm downtrend, and that is a read of what traders have done, not a forecast. The actionable map is the $21.82–$23.66 range, with $22.50 support and $23.50 max pain.
Are KWEB options expensive right now? Not especially. IV rank of 27.99/100 means option prices are lower than about 72% of the past year's readings. They run about 6.5 vol points above the movement KWEB has actually delivered, richer than 68% of the fund's own recent readings. That makes premium fair, not rich.
Where is KWEB's biggest options support and resistance? For the November 6 expiration, the put wall is $22.50 and the call wall is $25.50. Max pain sits at $23.50.
What invalidates this week's read? A close below $22.50.
Methodology & disclosures. Data: end-of-day options-chain snapshot for KWEB, 2026-10-30, generated 2026-10-31T19:42:04.977Z. Prices shown are midpoints and will differ from live markets. Momentum/positioning scores and volatility-premium comparisons are descriptive measurements of past option flow and past price movement — not investment advice, signals, forecasts, or guarantees. All trade structures are hypothetical. Every structure shown has a defined maximum loss; you can lose the entire max-loss amount. Options involve substantial risk and are not suitable for all investors.