MARA Options Are Pricing a $1.05 Move — Our Model Sees a Lid at $7
MARA options imply a $5.72–$7.82 range into the November 6 expiration. The stock has slipped just under its biggest put strike, and our positioning read leans slightly bearish below $7.
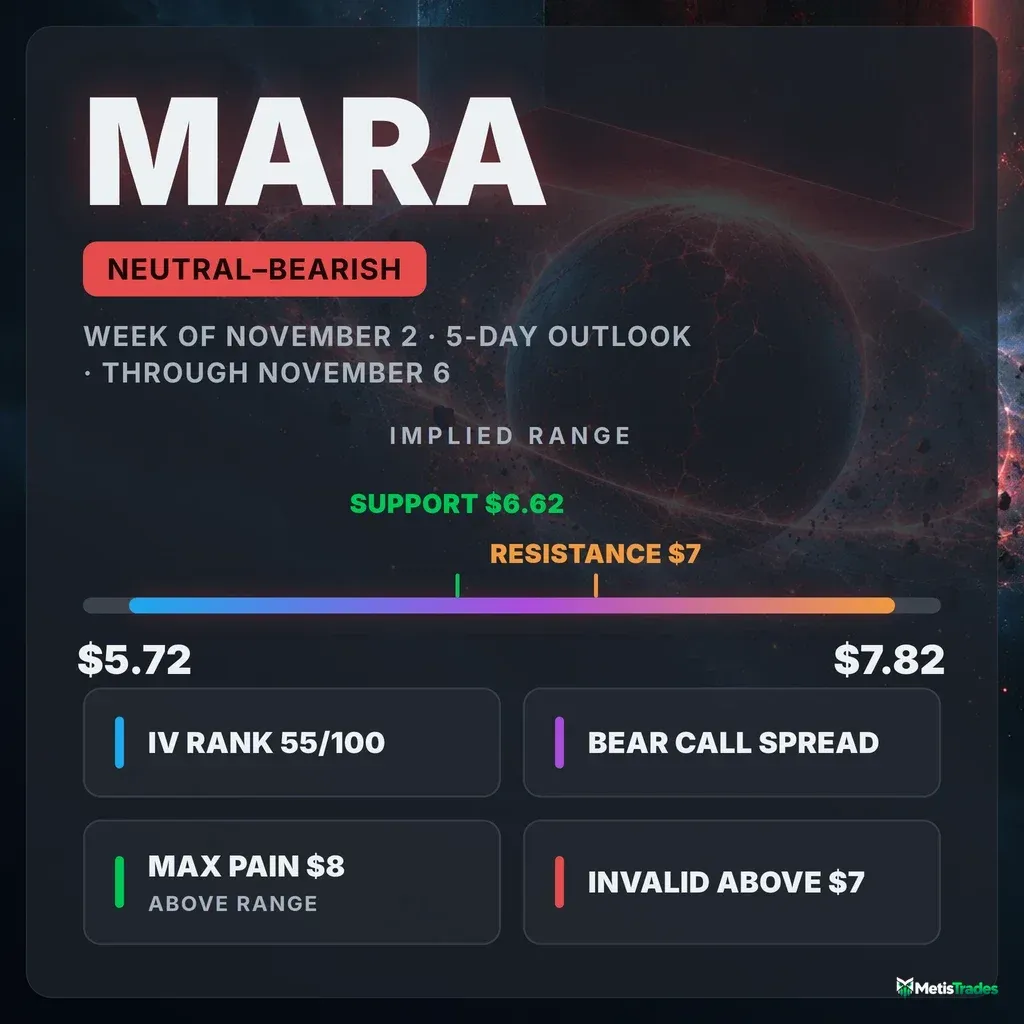
The options market implies a $5.72–$7.82 range into the November 6 expiration. Below is what's driving that range and three defined-risk ways to trade it.
Published Sunday, November 1, 2026 · Data as of Friday, October 30, 2026 close
Explore the live MARA options data in the Detailed Options Analyzer →
Quick answer
| Item | Answer |
|---|---|
| Market bias | Slightly bearish (neutral with a bearish tilt) |
| Options-implied range (into Nov 6) | $5.72 – $7.82 (±15.54%, about ±$1.05 around $6.77) |
| Major support | $6.62 swing support, then the $6.45 52-week low. The 5-day put wall at $7.00 now sits just above the stock. |
| Major resistance | $7.00 (put wall turned ceiling), then $8.00. The 5-day call wall is far overhead at $10.00. |
| Max pain (Nov 6) | $8.00 |
| Dealer gamma regime (estimate) | Negative: hedging tends to amplify moves. No flip level could be estimated today. |
| Volatility condition | Rising. IV rank 55/100 · premium rich: options priced ~41 vol pts above delivered movement (earnings-inflated) |
| Next earnings | November 12 (before open), after the Nov 6 expiration |
| Technical check | Confirms (bearish; 3-day target $6.65, range $6.47–$6.85; 5-day target $6.60, range $6.30–$6.95) |
| Best-fitting strategy | Nov 6 $7.00/$7.50 bear call spread, if MARA stays capped below $7 |
| Analysis invalidated if | MARA closes above $7.00 |
1 · What matters today
MARA closed Friday at $6.77. That is just below $7.00, the strike holding the largest pile of open put contracts for the November 6 expiration. Before Friday, that level had acted as a floor. Now it sits overhead.
Options are pricing a move of about $1.05 either way by November 6, the size of move implied by straddle prices. That puts the expected range at $5.72 to $7.82.
Our read leans slightly bearish. Traders bought plenty of short-dated calls, but they mostly traded in and out rather than holding them. Meanwhile, puts got noticeably pricier relative to calls on Friday, and the stock is down about 40% over the past month.
The level that changes the picture is $7.00. A close back above it would undo the bearish tilt. The November 6 options expire before the November 12 earnings report.
Both chart-based technical reports also lean bearish, which confirms the options read.
2 · What the options market is pricing
What changed this week
MARA lost 3.6% over the past five sessions and is down 39.7% over the past 20. The short-term, one-month and two-month trend reads all point down together. A fast-momentum crossover turned up on October 29, but Friday's gap down erased it within a day.
Implied volatility (IV) is the market's estimate of how much MARA will move, baked into option prices. It rose 9.1% over five days, including a 7.4% jump on Friday alone.
IV rank measures where today's IV sits within its past-year range. It climbed to 55/100, against a 7-day average of 42 and a 14-day average of 37.
The put/call open-interest ratio compares put contracts held open to call contracts held open. It eased to 0.63 (0.63 puts for every call), below its 7-day average of 0.67. In other words, held positions have been leaning toward calls.
The biggest single change in open interest was in far-dated contracts: the January 15, 2027 $10 calls added 8,660 contracts, bringing the total to 29,364. That looks like longer-term call holders adding exposure, not a bet on the next five days.
For context on the settled October 30 expiration: the $7.50 and $8 calls each carried more than 55,000 open contracts into Friday and expired worthless as the stock gapped below $7.
Expected move
The expected move is the move the options market is pricing in, derived from what straddles cost. For the November 6 expiration it is ±15.54%, or roughly $1.05 in either direction from $6.77. On a single-digit stock, that is a very wide band.
| Expiration | Implied move | Range around $6.77 |
|---|---|---|
| November 6 | ±15.54% | $5.72 – $7.82 |
| November 13 | ±22.00% | $5.28 – $8.26 |
| November 20 | ±26.85% | $4.95 – $8.59 |
| November 27 | ±29.38% | $4.78 – $8.76 |
The rungs widen mostly because each one adds time. ATM IV is nearly identical across November 6, 13 and 20 (about 112%) and only starts to ease by late November. That means the whole front of the curve is carrying elevated premium, not just the post-earnings expirations.
Volatility
At-the-money IV reads 106.05%. That is far above its 30-day average of 85.8% and 90-day average of 88.9%, and up 27.6% over the past 30 sessions.
The two past-year measures say different things:
- IV rank is 55/100, meaning today sits a little above the middle of the past year's high-to-low range.
- IV percentile is 97.6, meaning IV is higher than on almost every day of the past year.
The front-month term-structure read, which compares option prices across expiration dates, is unavailable today because Friday was an expiry day.
The rate of IV expansion is unusually fast for MARA compared against this stock's own recent history. Meanwhile, the stock's 20-day realized movement of 64.7% annualized is actually running below its own recent norm.
Premium rich or cheap? The volatility risk premium is the gap between how much movement options are priced for and how much MARA has actually delivered. When it's positive, option sellers have been collecting more than realized movement cost them.
Today that gap is about 41 vol points. That is richer than 96% of this stock's own recent readings and well above its norm. The gap widened from roughly 13 points in mid-October to about 43 points, eased to about 33 by October 28, and jumped back to 41 on Friday.
In isolation, IV rank 55 plus a 96th-percentile premium would favor collecting premium. However, some of that richness is the market pre-pricing the November 12 report, not free premium. The November 6 contracts don't span the report, but their IV is elevated by post-selloff stress. Treat that as compensation for real risk, not as a giveaway.
Earnings on the calendar
MARA reports on November 12, before the open. That falls six days after the November 6 expiration and one day before the November 13 expiration. Every expiration from November 13 onward carries the gap risk of the report.
Elevated IV across the front of the curve is consistent with the market bracing for it. However, there is no sharp IV step-up at the first post-earnings rung: front-week IV was already this high.
The track record is mixed. The latest report, in August, showed a $0.70 loss per share against an expected $0.56 loss. Two of the last four reports beat and two missed.
Skew and sentiment
Skew means puts and calls the same distance from the stock price don't cost the same. When puts are pricier, traders are paying up for crash protection.
On Friday, 25-delta puts ran about 2.2 vol points over calls. This name's 60-day norm is the opposite: calls 3.5 points over puts. Skew swung roughly 11 points toward puts in a single session, from calls being about 8.9 points richer on Thursday. Against MARA's own history, that is an unusually steep put bid.
The put/call ratio measures put activity relative to calls; above 1 means puts dominate.
- Friday's volume ratio was 0.42, a bit more put-heavy than its 7-day average of 0.36 but still call-dominated.
- Total option volume ran 2.0× its 20-day average.
Sentiment in short-dated options leans mildly bullish: +21 in both the 0–7 day and 7–30 day windows. The 60–120 day window reads −43, so the overall regime is Mixed.
Our broader momentum read of options flow is −24, close to its 7-day average of −26. It briefly turned positive Thursday (+9) before falling back Friday.
Price has been falling while short-dated positioning has improved. That kind of divergence can precede a turn, but it is an early, unconfirmed condition. With the trend down on every horizon, we read the call activity as traders chasing a bounce, not building conviction.
The key levels map
| Level | Price | Why it matters |
|---|---|---|
| 200-day moving average | $10.80 | Long-term trend line, about 37% above spot |
| 50-day moving average | $10.37 | Sits below the 200-day, confirming the downtrend |
| Call wall (Nov 6) / largest-gamma strike (whole chain) | $10.00 | Heaviest call open interest for the 5-day expiration (3,988 contracts); far outside the implied range |
| Swing resistance | $8.68 | Recent pivot cluster |
| 20-day moving average | $8.34 | Price trades 18.8% below it |
| Max pain (Nov 6) / whole-chain heaviest call strike | $8.00 | Max pain is the price where the most option value would expire worthless. Across all expirations, $8 also holds 80,249 open calls. |
| Top of implied range | $7.82 | Upper edge of the ±1σ move by Nov 6 |
| Unfilled gap | $6.81 – $7.17 | Friday's 5% gap down is still open overhead |
| Put wall (Nov 6 and whole chain) | $7.00 | Biggest pile of open puts (6,852 for Nov 6; 58,225 chain-wide). Lost on Friday; this is the thesis line. |
| Spot | $6.77 | Friday's close |
| Swing support | $6.62 | Nearest structural floor |
| 52-week low | $6.45 | Stock sits only 5% above it |
| Heavy put strike (whole chain) | $6.00 | 44,509 open puts; a large gamma strike |
| Bottom of implied range | $5.72 | Lower edge of the ±1σ move by Nov 6 |
| Put cluster (whole chain) | $5.00 | 58,162 open puts, mostly far-dated |
Positioning and unusual flow
Market makers hedge the options they've sold. One rough estimate puts both the whole chain and the November 6 expiration in negative gamma, a regime where their hedging tends to amplify moves rather than dampen them. The estimate could not locate a gamma flip level today.
The notable non-expired flow:
- Nov 6 $7 calls: 52,297 contracts traded against 2,650 open, about $1.67 million in premium, much of it at the ask. Open interest rose only 161 contracts, so this was day-trading, not new positions.
- Nov 6 $6.50 calls: 44,620 contracts traded, about $2.54 million in premium, yet open interest barely moved. The same chase-and-flatten pattern.
- Puts on the other side: 13,276 January 2027 $6 puts traded (about $1.04 million, at the bid), and December 18 $6 puts added 3,105 contracts of open interest. Downside protection is being held further out the curve.
3 · Technical check
Both chart-model reports are bearish and fresh, both built on November 1 data.
The 3-day report (target date November 4) aims for $6.65 within a $6.47–$6.85 projected range. The 5-day report (target date November 6) aims for $6.60 within $6.30–$6.95. Both targets sit inside the options-implied range, so the technical picture confirms the slight bearish tilt rather than extending it.
The most decisive readings:
- ADX of 26 with the negative directional line (34.2) well above the positive one (21.5), which means a strong, seller-controlled trend.
- A mildly positive money-flow reading (+0.068). This hints at dip-buying near the lows and is the main bullish counterpoint.
The dominant scenario in both reports is invalidated by a close above $7.01. That lines up almost exactly with the options-market put wall at $7.00.
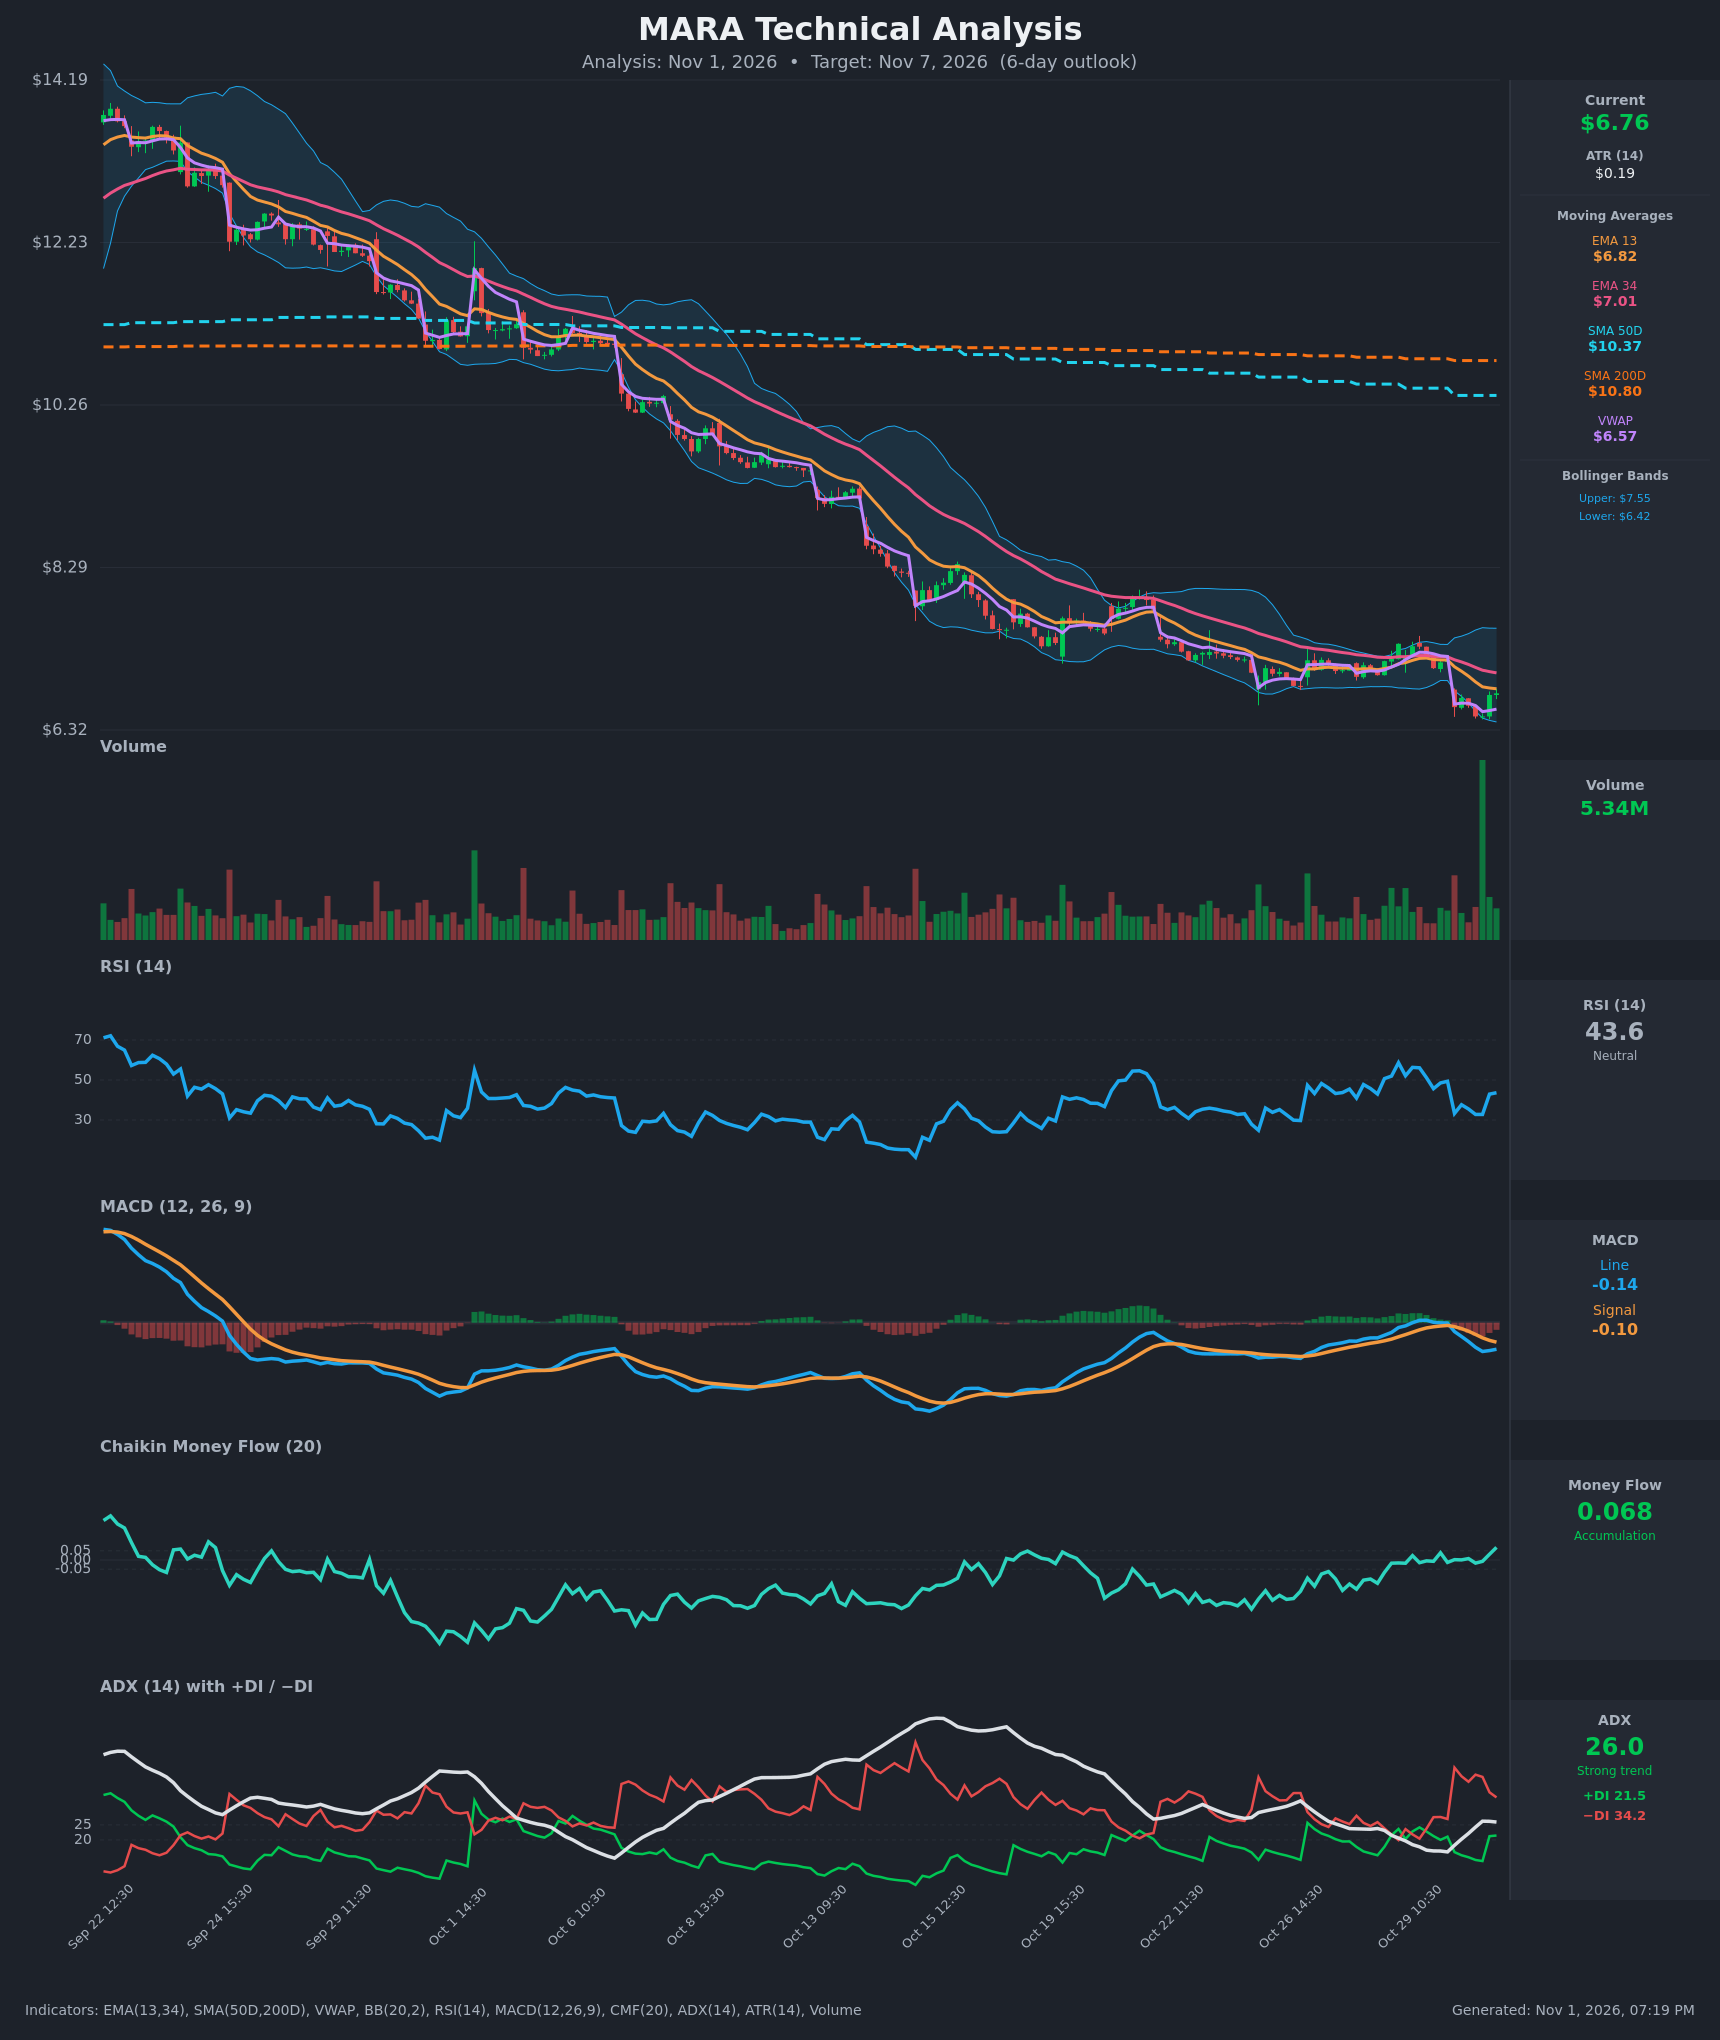
Model vs. Market: The options market implies $5.72–$7.82 into November 6; the 5-day technical model targets $6.60 (range $6.30–$6.95). The chart model expects a much quieter drift than options are pricing. If MARA stays inside the model's band, premium sellers collect, and the confirmation helped shade the short call strike to $7.00.
Full technical write-ups: 3-day report → · 5-day report →
4 · Three ways the next five days can go
If MARA pushes back above $7.00 and toward max pain ($8.00): Reclaiming the put wall and filling Friday's gap to $7.17 would leave max pain at $8.00 as the next reference. Heavy chain-wide call open interest also sits at $7.50 and $8.00. In a negative-gamma regime, a squeeze through those strikes can travel quickly. This is the case that invalidates our tilt.
If MARA drifts between $6.62 and $7.00: This is the quiet case. Price chops under the lost put wall while elevated IV bleeds away into expiration, which favors short-premium structures with short strikes outside this band.
If MARA breaks below $6.62 and the $6.45 low: Below these levels there is little structure until the heavy $6.00 put strike. One rough estimate suggests market-maker hedging in this regime amplifies selling rather than cushioning it. The lower edge of the implied range, $5.72, is the market's own 1σ marker.
5 · Three defined-risk structures
Prices are end-of-day midpoints as of October 30, 2026. All structures are hypothetical unless flagged as an entered position. Verify live prices before trading; these will be stale by the open.
The bearish structure leads because it best matches the calibrated read. All three use the November 6 expiration, which ends before the earnings report.
If you lean bearish: Nov 6 $7.00/$7.50 bear call spread
A credit spread: you collect premium up front and keep it if MARA stays below the short strike.
- Trade: Sell the Nov 6 $7.00 call, buy the Nov 6 $7.50 call
- Credit: $0.15 ($15 per spread) · Max profit: $15 · Max loss: $35 · Break-even: $7.15
- Why it fits: The short strike sits on the lost $7.00 put wall, with Friday's unfilled gap and the chart model's $7.01 trend line overhead. You're also selling premium that runs ~41 vol points above realized movement.
- Makes sense only if: MARA keeps failing below $7.00
- Invalidated if: MARA closes above $7.00
- Earnings exposure: Expires six days before the November 12 report, so no earnings-gap risk
- Managing it: Close at about 50% of the credit ($0.07–$0.08). Close on any daily close above $7.00 rather than hoping. Exit by November 5 regardless.
- Liquidity note: The $7 calls trade 2¢ wide ($0.31/$0.33). The $7.50 calls are also 2¢ wide ($0.16/$0.18), but that is about 12% of mid, so work a limit order near the midpoint.
- Analyze this position →
If you expect the range to hold: Nov 6 $5.50/$6.00/$7.50/$8.00 iron condor
Two credit spreads at once: you're paid if MARA stays between the short strikes.
- Trade: Buy the $5.50 put, sell the $6.00 put, sell the $7.50 call, buy the $8.00 call (all Nov 6)
- Credit: $0.16 ($16) · Max profit: $16 · Max loss: $34 · Break-evens: $5.84 and $7.66
- Why it fits: Both short strikes sit outside the chart model's $6.30–$6.95 band and near the edges of the $5.72–$7.82 implied range. Rich premium pays you to define that box.
- Makes sense only if: MARA chops between roughly $6.00 and $7.50 into expiration
- Invalidated if: MARA closes above $7.50 or below $6.00
- Earnings exposure: Expires six days before the November 12 report, so no earnings-gap risk
- Managing it: Take 50% of the credit if offered. In negative gamma, close the threatened side on a close through either short strike.
- Liquidity note: Every leg is only 1–2¢ wide, but on cheap options that is a large percentage (the $8 calls are $0.08/$0.10, the $5.50 puts $0.06/$0.07). Expect slippage and enter as a single limit order at mid.
- Analyze this position →
If you lean bullish: Nov 6 $7.00/$8.00 bull call spread
A debit spread: you pay up front and profit if MARA rises toward the upper strike.
- Trade: Buy the Nov 6 $7.00 call, sell the Nov 6 $8.00 call
- Debit: $0.23 ($23) · Max profit: $77 · Max loss: $23 · Break-even: $7.23
- Why it fits: It targets max pain at $8.00. Selling the $8 call offsets part of the inflated IV you pay on the long leg.
- Makes sense only if: MARA reclaims $7.00 and fills the gap to $7.17
- Invalidated if: MARA closes below $6.62
- Earnings exposure: Expires six days before the November 12 report, so no earnings-gap risk
- Managing it: The short-term bounce would be fighting a downtrend on every horizon. Take profits early, at about 50–60% of max, and don't hold a loser into the final two days.
- Liquidity note: The $7 calls are 2¢ wide ($0.31/$0.33). The $8 calls are 2¢ wide too ($0.08/$0.10), about 22% of mid, so use limit orders.
- Analyze this position →
If none of these: no trade
Standing aside is reasonable here. The premium looks rich, but it is rich for a reason: a stock down about 40% in a month, sitting 5% above its 52-week low, in an estimated negative-gamma regime where moves can feed on themselves. Small credits against larger max losses ($15 to make, $35 to lose on the lead idea) leave little room for one bad gap.
If you can't monitor positions daily, or you'd be tempted to roll into the post-earnings expirations, sitting out costs nothing. Everything from November 13 onward spans the November 12 report.
6 · Quick FAQ
What is MARA's expected move this week? About ±$1.05 (±15.54%) into the November 6 expiration, a $5.72–$7.82 range per straddle pricing as of October 30, 2026.
Is MARA expected to go up or down over the next five days? Options positioning as of October 30 leans slightly bearish: the stock lost its $7.00 put wall and put skew steepened. That is a read of what traders have done, not a forecast. The actionable map is the $5.72–$7.82 range, $6.62 support and $7.00 resistance.
Are MARA options expensive right now? Yes on both lenses:
- IV rank is 55/100, and IV percentile is 97.6, so IV is above almost every day of the past year.
- Options are priced about 41 vol points above the movement MARA has actually delivered, richer than 96% of this stock's own recent readings.
Part of that richness reflects the upcoming earnings report and post-selloff stress, so it isn't free money.
When is MARA's next earnings report? November 12, before the open. That is after the November 6 expiration but before November 13, so options from November 13 onward carry the report's gap risk.
Where is MARA's biggest options support and resistance? For November 6, the put wall is $7.00, now just above the stock, and the call wall is $10.00. Max pain is $8.00.
What invalidates this read? A close above $7.00.
Methodology & disclosures. Data: end-of-day options-chain snapshot for MARA, 2026-10-30, generated 2026-11-01T19:19:18.171Z. Prices shown are midpoints and will differ from live markets. Momentum/positioning scores and volatility-premium comparisons are descriptive measurements of past option flow and past price movement — not investment advice, signals, forecasts, or guarantees. Earnings dates and reported results are from the data provider's earnings feed as of 2026-11-01T19:19:18.171Z; report dates can change. All trade structures are hypothetical. Every structure shown has a defined maximum loss; you can lose the entire max-loss amount. Options involve substantial risk and are not suitable for all investors.