MARA Options Are Pricing a $1.35 Move Into Friday — But the Premium Is the Cheapest Part of the Trade
The options market implies a $10.63–$13.33 range for MARA into the September 18 expiration, with positioning leaning bullish and max pain sitting almost exactly at spot. Here's what's driving it, where the walls sit, and three defined-risk ways to trade the next four days.

The options market implies a $10.63–$13.33 range into the September 18 expiration; here's what's driving it and three defined-risk ways to trade the next four days.
Published Sunday, September 13, 2026 · Data as of Friday, September 11 close
Explore the live MARA options data in the Detailed Options Analyzer →
Quick answer
| Item | Answer |
|---|---|
| Market bias | Bullish |
| Options-implied range (into September 18) | $10.63 – $13.33 (±11.25%, or about ±$1.35) |
| Major support | $10.00 (put wall, September 18 expiration) |
| Major resistance | $15.00 (call wall, September 18 expiration) |
| Max pain (September 18) | $12.00 |
| Dealer gamma regime (estimate) | Positive — hedging tends to dampen moves; flip level ≈ $2.00 (a rough estimate, far below spot) |
| Volatility condition | Falling — IV rank 28/100 · premium thin: options priced ~15 vol points below delivered movement |
| Technical check | Mixed (bearish on the 2-day model, bullish on the 4-day model) |
| Best-fitting strategy | September 18 $12/$13 call debit spread |
| Analysis invalidated if | MARA closes below $11.70 |
1 · What matters today
MARA closed Friday, September 11 at $11.98 after a 3.3% five-session gain and a 30% run over the past month. Our read of options flow leans bullish: call trading dominated the tape, put protection thinned out, and puts are actually cheaper than calls right now — the opposite of this stock's usual posture. The options market is pricing a move of roughly $1.35 either way into the September 18 expiration, i.e. a $10.63–$13.33 range. Max pain — the price where the most option value would expire worthless — sits at $12.00, essentially on top of spot, so the default path is a drift, not a trend.
One caution worth naming up front: option prices are running below how much MARA has actually been moving, so premium here is thin, not rich. The chart models split, near-term soft and four-day firm. A close below $11.70 kills this read.
2 · What the options market is pricing
What changed this week
The flow turned decisively call-side into Friday. The put/call volume ratio — how much put activity there is relative to calls, with anything above 1 meaning puts dominate — printed 0.22, against a 7-day average of 0.39 and a 14-day average of 0.47. For every 100 call contracts traded, only 22 puts changed hands; a week ago it was closer to 40. Total option volume ran 2.1× its 20-day average, so this was a busy, one-sided session rather than a quiet drift. Open interest tells a calmer story: the put/call open-interest ratio sits at 0.66 versus a 7-day average of 0.67 — held positions barely budged, it was the fresh trading that skewed.
The single biggest build in still-live contracts was the September 18 $12.50 calls, which added 1,816 contracts of open interest to 7,725 while trading 47,163 contracts — turnover of about six times the open position, the signature of heavy same-day speculation rather than patient accumulation. Into Friday's expiration, the settled $11.50 calls traded 43,109 contracts (roughly $2.0 million of premium) and the $12 calls 77,893 — history now, but it shows where the chase was concentrated.
Implied volatility — the market's estimate of how much MARA will move, baked into option prices — kept sliding: down 2.1% on the day, 2.7% over five sessions and 13.2% over thirty, to 83.5%.
The short- and long-term trend reads disagree, and that tension is the honest headline. Momentum and price over the past week and the past month both point up (+3.3% and +30.0%), but over roughly the past two-and-a-half months MARA is still down 10.5%. The near-term flow and the bigger trend are pointing in different directions — which argues for short-dated expressions and early profit-taking rather than a position you intend to sit on.
Expected move
The expected move is the move the options market is pricing in — derived from what straddles cost. Into the September 18 expiration, that's ±11.25%, or about ±$1.35 around Friday's $11.98 close: a $10.63 to $13.33 range.
| Expiration | Implied move | Range around $11.98 |
|---|---|---|
| September 18 | ±11.25% | $10.63 – $13.33 |
| September 25 | ±15.93% | $10.07 – $13.89 |
| October 2 | ±19.98% | $9.59 – $14.37 |
| October 9 | ±23.15% | $9.21 – $14.75 |
The rungs scale almost exactly with the square root of time — there is no bulge at any one date, which tells you the chain is pricing generic volatility rather than a specific dated event.
Volatility
At-the-money implied volatility is 83.5%, with an IV rank of 28/100 — where today's IV sits versus the past year, meaning option prices are cheaper than roughly 72% of the past year's readings. The IV percentile tells the same story (22/100). Current IV sits below both its 30-day average (86.6%) and its 90-day average (88.7%), and the 30-day change is −13.2%: this is a steady deflation, not a spike. The front-month read is unavailable in this snapshot — Friday was an expiry day, and front-month implied vol can't be interpolated from a same-day-expiring contract — so there's no term-structure comparison to make today.
Two readings stand out against this stock's own recent history. Realized volatility over the past 20 sessions is running at 98.9%, on the high side of its own norm — MARA has genuinely been moving. But the 5-day-versus-20-day realized-vol ratio is 0.65, unusually depressed for this name: the last week has been noticeably calmer than the month that preceded it. Movement is decelerating even as the overall level stays elevated.
Premium: thin, not rich. The volatility risk premium — the gap between how much movement options are priced for and how much MARA has actually delivered — is negative by about 15 vol points. Option sellers over the past month have been collecting less than the stock's actual movement cost them. That gap sits at the 19th percentile versus this stock's own recent readings: richer than only about a fifth of them, i.e. thinner than four out of five recent days. The gap has been negative every single session for three weeks and has widened slightly over the past four, so this isn't a one-day artifact. Combine that with an IV rank of 28 and the verdict is clear: this is a week to own premium, not sell it. The snapshot's implied-versus-delivered reading is stretched to the cheap side of its own norm too, which only reinforces it.
Skew and sentiment
Skew describes the fact that puts and calls the same distance from the stock price don't cost the same — when puts are pricier, traders are paying up for crash protection. Here it's inverted. The 25-delta put trades at 83.1% implied vol against 87.0% for the equivalent call: puts are running 3.9 vol points cheaper than calls, against a 60-day median of just 0.5 points cheaper. Nobody is paying up for downside insurance; the premium is being paid on the upside. Against this stock's own history, that skew reading is stretched well past its norm — the market is priced for complacency, or for a chase, depending on your temperament.
The call-buying pace tells the same story: today's put/call volume ratio of 0.22 is unusually call-tilted even by MARA's own standards, sitting well below its recent baseline.
Sentiment across expiration dates — how the chain is positioned at different maturities — is what the data calls a "Bullish Recovery" regime. The 0–7 day bucket reads −10 (mildly negative, against a 7-day average of +23), while the 7–30 day bucket reads +42 and the 60–120 day bucket +47. In plain terms: the very front of the curve wobbled on Friday as the expiring contracts settled, but every dated bucket beyond a week is positioned to the call side. Positioning is building further out, not right under the market.
One counterweight deserves a mention. Our leading positioning read — the composite built only from flow, skew and term signals, with lagging price inputs deliberately excluded — has fallen roughly 40 points over the past ten sessions while price rose about 14%. That price-versus-positioning gap is the kind of condition that has historically preceded a turn; it is an early, unconfirmed read, not a confirmed one, and it's the main reason the structures below are short-dated and defined-risk.
The key levels map
| Level | Price | Why it matters |
|---|---|---|
| 52-week high | $23.45 | Price sits 48.9% below it; range position 31.7 out of 100 |
| Call wall (September 18) | $15.00 | Heaviest call open interest at this expiration — 31,448 contracts; the ceiling that matters for the week |
| Swing resistance | $13.80 / $13.16 | Recent pivot clusters from price structure |
| Top of implied range | $13.33 | One standard deviation up through September 18 |
| Heavy call strike | $13.00 | 26,288 calls open at September 18; second-largest gamma strike chain-wide — the first real overhead friction |
| Biggest OI build | $12.50 | Added 1,816 contracts Friday on 47,163 traded — where the chase concentrated |
| 100-day moving average | $12.23 | Price is 2.0% below it — the nearest trend-following resistance |
| Swing resistance | $12.07 | Nearest overhead pivot |
| Max pain (September 18) | $12.00 | Where the most option value expires worthless; also the chain-wide heaviest call strike (97,241 contracts) and the largest total-gamma strike |
| Last close | $11.98 | Chain snapshot and official close agree |
| Swing support | $11.78 / $11.56 | Recent pivot lows |
| Chart-model invalidation | $11.70 | The 4-day technical model's kill switch; also its EMA34 / prior consolidation zone |
| 50-day moving average | $11.27 | Price sits 6.3% above it |
| 200-day moving average | $10.94 | Price sits 9.5% above it; the intermediate uptrend floor |
| Bottom of implied range | $10.63 | One standard deviation down through September 18 |
| Swing support | $10.54 / $10.01 | Older pivot cluster |
| Put wall (September 18) | $10.00 | Heaviest put open interest at this expiration — 58,336 contracts; the biggest single pile of downside positioning |
| Gamma flip estimate | ≈ $2.00 | A rough estimate only — spot sits far above it, so hedging stays in its dampening mode across every plausible price this week |
One discrepancy to flag: the whole chain's heaviest call strike is $12.00 and its heaviest put strike is $10.00, but the September 18 expiration's own call wall sits much higher at $15.00. That difference matters — the $12 pile is mostly built at other dates. For this week, use $15.00 as the wall and $13.00 as the first real overhead cluster.
Positioning and unusual flow
One rough estimate of dealer positioning — market makers hedge the options they've sold, and in a positive-gamma regime that hedging tends to dampen moves rather than amplify them — reads positive both for the whole chain and for the September 18 expiration specifically. The two agree, which is convenient: there's no conflicting read to reconcile for the week. Practically, it argues for chop and mean-reversion around $12 rather than a runaway move.
Three live flows stood out:
- September 18 $12.50 calls — 47,163 contracts traded against 7,725 open, with open interest up 1,816. Turnover of six times the open position: aggressive, short-dated upside speculation right at the edge of the expected move.
- September 18 $12.50 puts — 1,212 traded against 206 open, with open interest up 122. Small in dollar terms, but nearly six times turnover on an in-the-money put; somebody wanted downside on the same strike.
- October 16 $9 puts — 7,997 traded against 1,575 open, about $156,000 of premium changing hands. Deep out-of-the-money protection five weeks out; a cheap tail hedge rather than a directional bet.
3 · Technical check
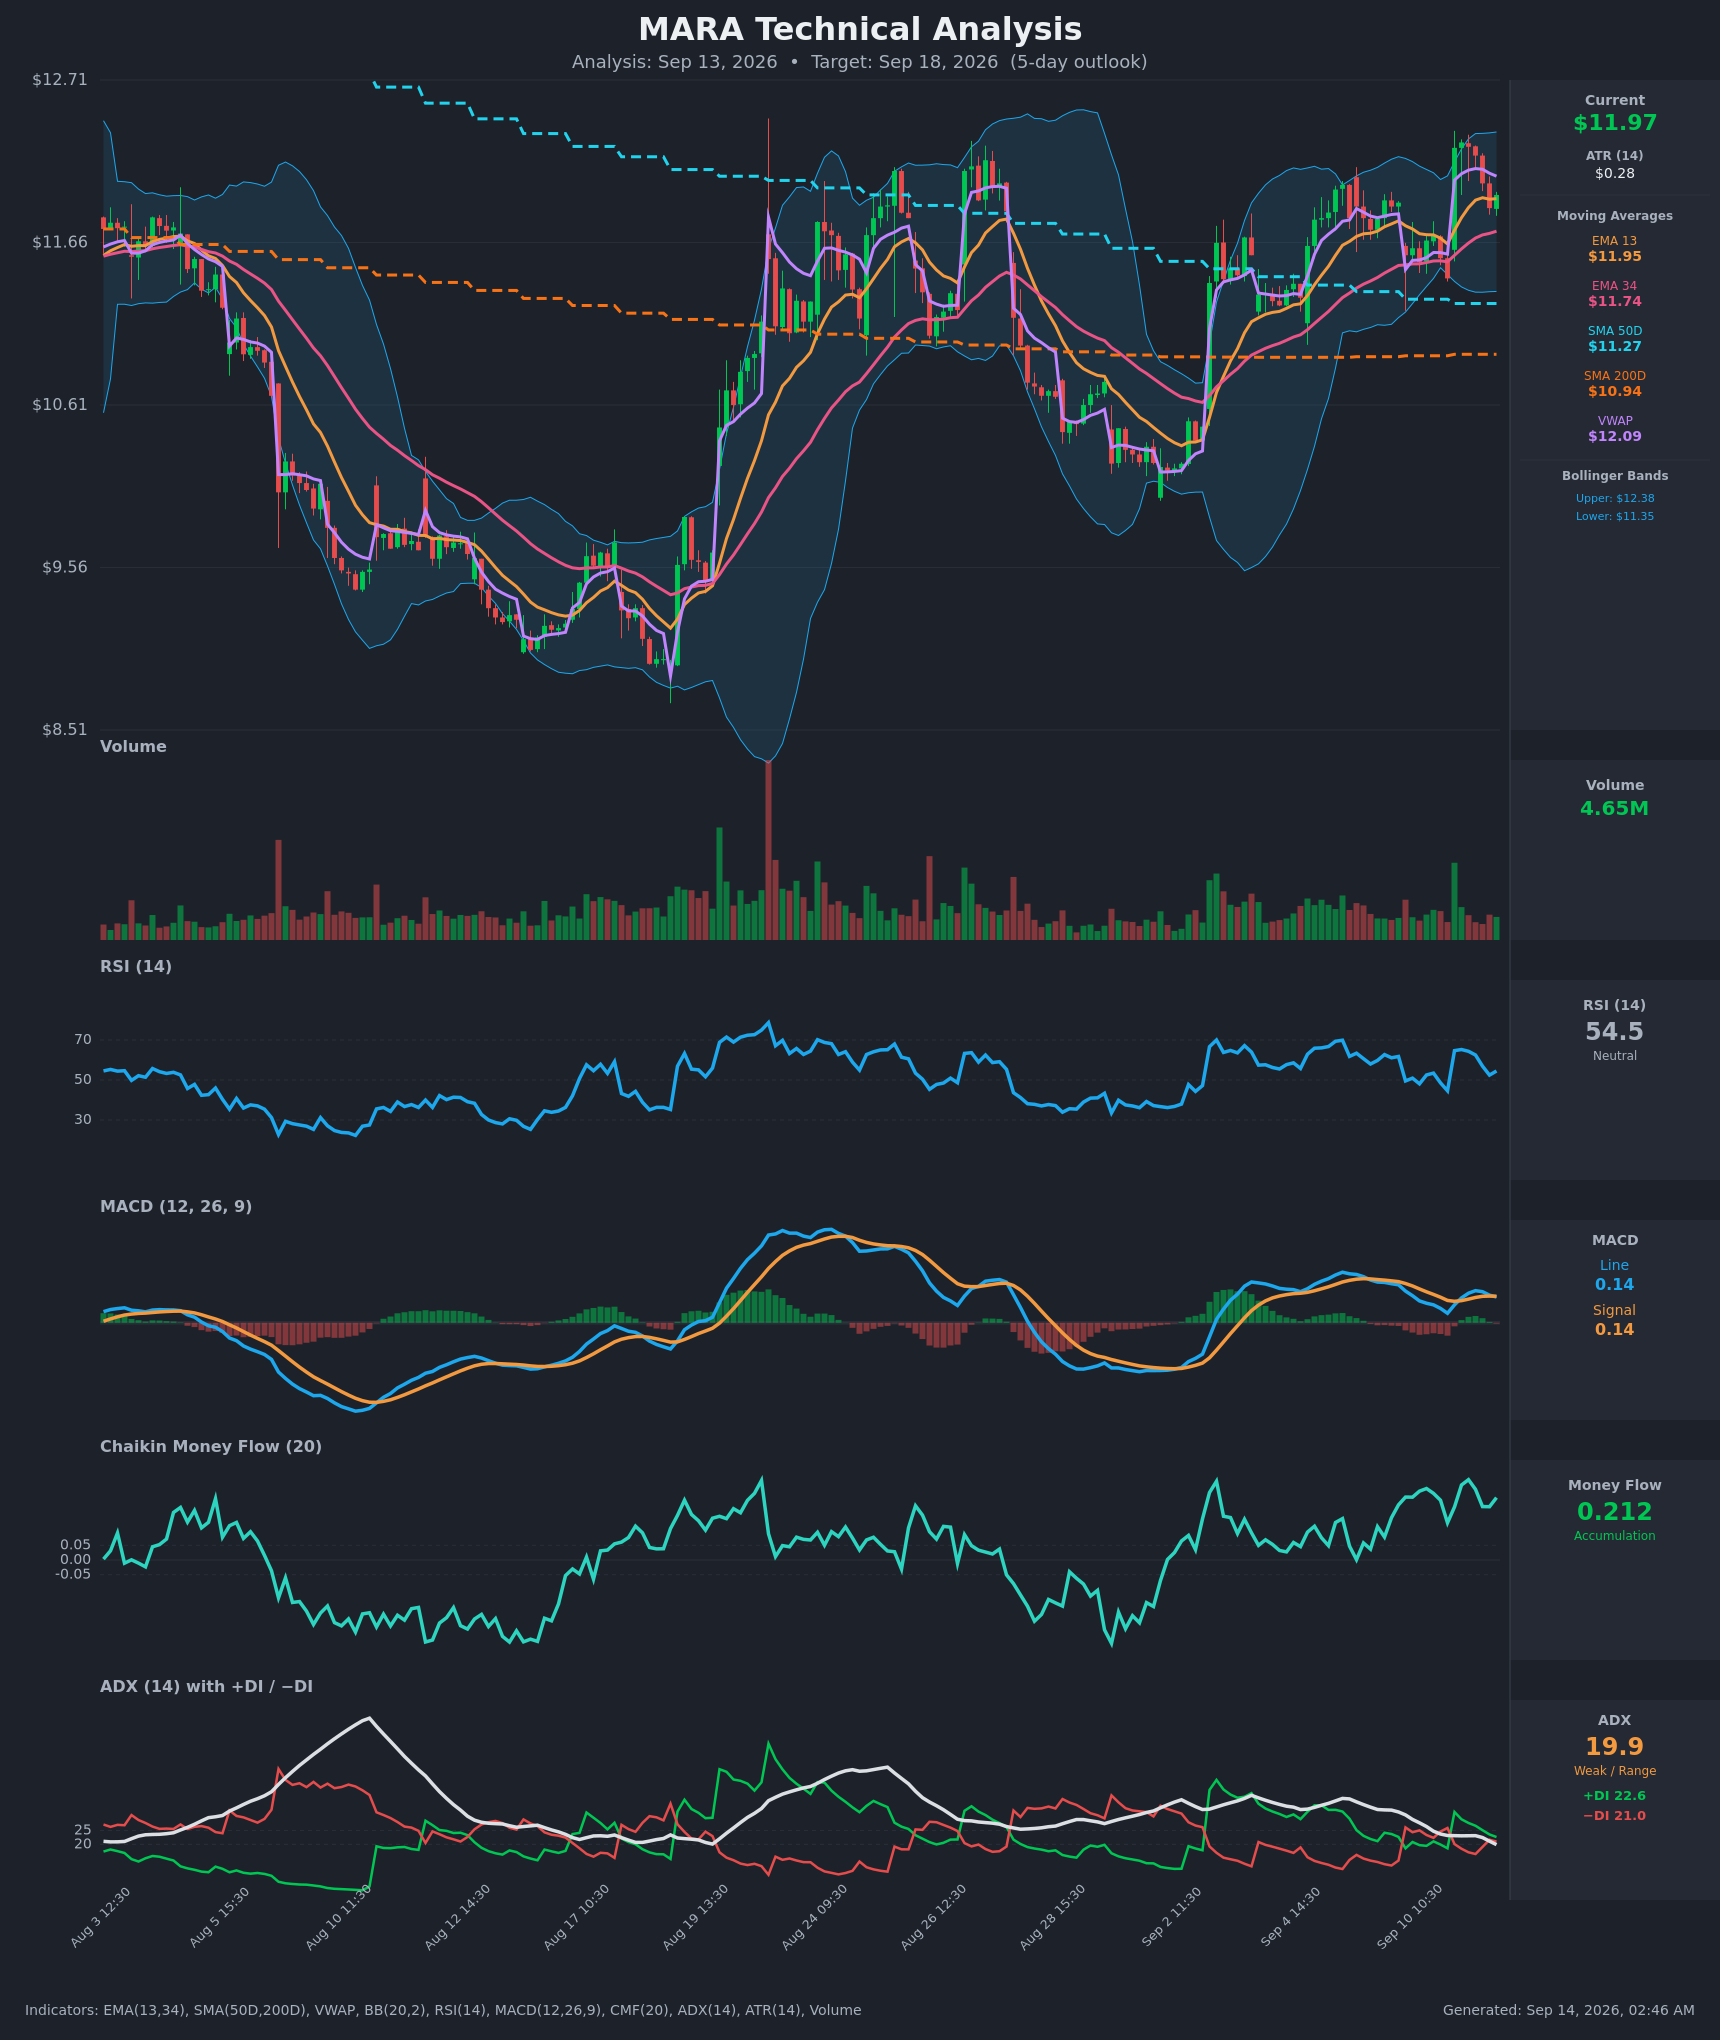
The two chart models split by horizon, which is itself informative. The 2-day model reads bearish, targeting $11.82 by September 16 inside a projected $11.65–$12.15 band, with support at $11.85 and resistance at $12.10. Its most decisive reads are a fresh short-term moving-average crossover to the downside and a negative directional-index tilt with weak overall trend strength — a pullback read, not a reversal read. Its dominant scenario is invalidated on a reclaim above $12.05. Against our bullish options bias, that diverges, though its target sits comfortably inside the options-implied range.
The 4-day model, which targets the September 18 expiration itself, reads bullish: $12.15 inside a projected $11.45–$12.55, support $11.70, resistance $12.31. Its strongest supporting read is sustained money-flow accumulation while price pulled back, with price holding above every major moving average. That confirms the options bias — same direction, target inside the implied range. Its invalidation, a close below $11.70, is the level we've adopted as this article's kill switch.
Model vs. Market: The options market implies $10.63–$13.33 into September 18; the 4-day technical model targets $12.15 inside a much tighter $11.45–$12.55. The chart model is pricing less than half the range options are charging for — which is exactly what a thin volatility premium looks like from the other side, and why the structures below buy rather than sell that range.
The split pushed strike selection toward a spread that pays off on a modest move to $13 rather than one that needs a breakout, and it argues against holding directional risk past the halfway checkpoint on September 16.
Full technical write-ups: 2-day report → · 4-day report →
4 · Three ways the next four days can go
If MARA pushes through $13.00 and toward the call wall ($15.00): The first friction is the 26,288 calls open at $13 for this expiration — the heaviest call open interest below the wall, and the kind of pile that tends to slow a rally as hedging flows meet it. Above $13.33 the stock is outside what the options market priced for, and positioning thins out considerably until the $15 wall. A move that far in four days would be a genuine surprise relative to the pricing.
If MARA drifts between the walls: This is the base case the data supports. Max pain at $12.00 sits two cents above Friday's close, the estimated dealer-gamma regime is in its dampening mode, and the largest gamma concentration on the whole chain is at $12. Expirations sometimes gravitate toward max pain, and here there's nothing pulling price away from it: the $11.56–$12.43 swing band and the pin level are the same neighborhood.
If MARA breaks below the put wall ($10.00): That would require an 16.5% slide in four days — outside the implied range and through every moving average in the file. The usual acceleration story doesn't apply here: spot sits unusually far above the gamma flip estimate (~$2.00) even by this stock's own standards, so on that rough estimate, hedging would stay in its cushioning mode the entire way down rather than flipping to amplify the selling. The more realistic downside path is a fade to $11.27 (the 50-day average), not a cascade.
5 · Three defined-risk structures
Prices are end-of-day midpoints as of September 11. All structures are hypothetical. Verify live prices before trading — these will be stale by the open.
If you lean bullish: September 18 $12/$13 call debit spread
- Trade: Buy the September 18 $12 call, sell the September 18 $13 call
- Debit: $0.32 ($0.515 paid − $0.195 collected) · Max profit: $68 per spread · Max loss: $32 per spread · Break-even: $12.32
- Why it fits: A debit spread means you pay up front and win if price rises — the right posture when the volatility premium is 15 vol points below delivered movement and IV rank is 28. You're buying cheap optionality, not selling thin premium. The short strike sits at $13, the heaviest call open interest below the wall and a natural stall point; the long strike is at max pain, so you only need the pin to break upward. The 4-day chart model's $12.15 target and inverted skew (calls bid over puts) both point the same way.
- Makes sense only if: You want the upside but accept that a flat close at $12.00 loses the full debit — this structure needs movement, not a pin.
- Invalidated if: MARA closes below $11.70.
- Managing it: Take profits at roughly 60–70% of max value rather than holding to expiration — with the near-term chart model bearish and the long-term trend still negative, the odds favor an early exit. Close by the September 16 checkpoint if price hasn't cleared $12.10.
- Liquidity note: The $12 calls traded 3¢ wide on 45,250 contracts ($2.33 million of premium, the most active contract on the board) and the $13 calls 1¢ wide on 16,862. Fills should be easy.
- Analyze this position →
If you expect the range to hold: September 18 $11/$13 iron condor
- Trade: Sell the $11 put / buy the $10 put, and sell the $13 call / buy the $14 call, all September 18
- Credit: $0.23 ($0.11 on the puts, $0.12 on the calls) · Max profit: $23 per condor · Max loss: $77 per condor · Break-evens: $10.77 and $13.23
- Why it fits: A credit structure means you collect up front and win if price stays put. The short strikes sit on the two biggest live open-interest piles at this expiration below the wall — 13,617 puts at $11 and 26,288 calls at $13 — and they bracket max pain at $12.00 with the dealer-gamma estimate in its dampening mode.
- Health warning: You're selling premium that hasn't been rich lately — the volatility risk premium is negative and sits at only the 19th percentile of this stock's recent readings. Worse, the break-evens ($10.77 / $13.23) are inside the implied range ($10.63 / $13.33), so a textbook one-standard-deviation move breaches the position. The risk/reward is $23 to make against $77 to lose, and that is the honest picture.
- Makes sense only if: You specifically believe the max-pain pin holds and realized movement keeps decelerating the way the 5-day-versus-20-day vol ratio suggests.
- Invalidated if: MARA closes outside $11.70–$12.31 (the 4-day model's own support and resistance) — that's your early warning, well before the short strikes are threatened.
- Managing it: Close at ~50% of max credit; exit regardless by September 17. If either short strike trades through, close rather than hope — the width-to-credit ratio leaves no room to defend.
- Liquidity note: These are penny-quoted contracts on a $12 stock, so the percentage spreads look brutal even though the absolute spreads are 1–5¢ ($13 calls 1¢ wide, $11 puts 5¢ wide, $10 puts 1¢ wide, $14 calls 1¢ wide). Work the mid as a package; taking the market on four legs would eat most of the credit.
- Analyze this position →
If you lean bearish: September 18 $12/$11 put debit spread
- Trade: Buy the September 18 $12 put, sell the September 18 $11 put
- Debit: $0.415 ($0.56 paid − $0.145 collected) · Max profit: $58.50 per spread · Max loss: $41.50 per spread · Break-even: $11.585
- Why it fits: This is the direct expression of the 2-day chart model's $11.82 target and of the positioning divergence noted above — price up 14% over ten sessions while the leading positioning read fell about 40 points. Again, buying rather than selling is the right side of a thin volatility premium, and the short strike sits at the $11 put pile so you aren't paying for tail risk you don't need.
- Makes sense only if: You're fading the chase specifically, and accept that this trade fights both the bullish bias above and the 30% one-month uptrend.
- Invalidated if: MARA closes above $12.31 (the 4-day model's resistance and the recent swing high).
- Managing it: Because the short-term direction is fighting the intact month-long uptrend, take profit fast — at $11.82 or better, or at the September 16 checkpoint, whichever comes first. Don't hold a counter-trend debit spread into the final session.
- Liquidity note: The $12 puts quoted 8¢ wide on 5,139 contracts and the $11 puts 5¢ wide on 5,276 — wider than the call side. Expect to give up a couple of cents on entry, or use a limit at the mid and be patient.
- Analyze this position →
If none of these: no trade
There's a defensible case for standing aside. The volatility premium is thin, which rules out the income structures that normally justify a crowded, high-IV name like this one — the condor above exists for completeness, not because the math is good. On the other side, the debit spreads need real movement in four sessions while max pain sits two cents from spot and the estimated gamma regime actively dampens moves. Buying a move in a pinned market is its own kind of losing trade. And the bullish read itself rests on a leading positioning composite that has been falling while price rose. If you can't pick a side confidently, the most expensive thing you can do this week is pay a 32-cent debit for a market that closes at $12.00.
6 · Quick FAQ
What is MARA's expected move this week? About ±$1.35 (±11.25%) into the September 18 expiration — a $10.63 to $13.33 range, per the options market's straddle pricing as of September 11.
Is MARA expected to go up or down over the next four days? Options positioning as of September 11 leans bullish — call volume ran four-to-one over puts, put open interest thinned, and puts are trading 3.9 vol points cheaper than calls — but that's a read of what traders have done, not a forecast. The actionable map is the $10.63–$13.33 range, the $10.00 put wall and the $15.00 call wall, with max pain at $12.00.
Are MARA options expensive right now? No. IV rank of 28/100 says option prices are lower than 72% of the past year's readings; on top of that, they're running about 15 vol points below the movement MARA has actually delivered over the past 20 sessions — thinner than about 81% of this stock's own recent readings. That combination favors owning premium over selling it.
Where is MARA's biggest options support and resistance? For the September 18 expiration: the put wall at $10.00 (58,336 contracts of put open interest) and the call wall at $15.00 (31,448 calls). The nearest real friction above spot is the $13.00 strike, with 26,288 calls open.
What invalidates this week's read? A close below $11.70.
Methodology & disclosures. Data: end-of-day options-chain snapshot for MARA, 2026-09-11, generated 2026-09-14T02:45:57.706Z. Prices shown are midpoints and will differ from live markets. Momentum/positioning scores and volatility-premium comparisons are descriptive measurements of past option flow and past price movement — not investment advice, signals, forecasts, or guarantees. All trade structures are hypothetical. Every structure shown has a defined maximum loss; you can lose the entire max-loss amount. Options involve substantial risk and are not suitable for all investors.