META Options Outlook: Will the $650 Call Wall Cap This Move Into September 18?
The options market is pricing a ±$32.14 move in META through the September 18 expiration, with the heaviest call open interest sitting right at Friday's close. Here's the level map, the three ways the next five days can go, and three defined-risk structures.

The options market implies a $615.89–$680.17 range into the September 18 expiration; here's what's driving it and three defined-risk ways to trade it.
Published Sunday, September 13, 2026 · Data as of Friday, September 11 close
Explore the live META options data in the Detailed Options Analyzer →
Quick answer
| Item | Answer |
|---|---|
| Market bias | Neutral |
| Options-implied range (into September 18) | $615.89 – $680.17 (±4.96%) |
| Major support | $600.00 (put wall, September 18 expiration) |
| Major resistance | $650.00 (call wall, September 18 expiration) |
| Max pain (September 18) | $625.00 |
| Dealer gamma regime (estimate) | Positive — market-maker hedging tends to dampen moves; flip level ≈ $595 |
| Volatility condition | Neutral — IV rank 39/100 · premium fair: options priced about 0.1 vol points below delivered movement, but that gap is richer than roughly three-quarters of this stock's own recent readings |
| Technical check | Mixed (bearish at 3 days, bullish at 5 days) |
| Best-fitting strategy | Iron condor — defined risk, but only if you accept modest premium |
| Analysis invalidated if | META closes above $656.60 |
1 · What matters today
META closed Friday, September 11 at $648.03 after a 6.1% five-session run — and it closed almost exactly on top of the biggest pile of call contracts held open for the September 18 expiration, at $650. That is the whole story this week. Our read of options flow comes out genuinely neutral: bullish positioning signals (call open interest building fast, call-side sweeps dominating) are offset by the fact that price is pinned directly under its own overhead supply, with max pain — the strike where the most option value would expire worthless — sitting $23 lower at $625.
The options market is pricing a ±$32.14 move through September 18, or roughly $615.89 to $680.17. The technical models split: bearish over the next three days, bullish over five. A daily close above $656.60 would tell you the ceiling gave way and this read is wrong.
2 · What the options market is pricing
What changed this week
The underlying did the heavy lifting: META is up 6.12% over five trading days and 9.09% over twenty, a run that included an unfilled 5.73% opening gap on September 9 (from a $613.48 prior close to a $648.64 open). Option positioning followed. Put open interest relative to call open interest finished at 0.40 — about 40 puts held open for every 100 calls — against a 14-day average of 0.66 and a reading of 0.53 five sessions ago. Traders have been retiring downside protection at a fast clip, and Friday's flow added 30,031 call contracts of open interest against 5,426 on the put side.
Implied volatility — the market's estimate of how much META will move, baked into option prices — tells a calmer story. At-the-money IV sits at 36.7%: up 5.7% over five days but down 5.97% on Friday alone and down 3.62% over a month. That leaves it just above its 30-day average of 35.9% and below its 90-day average of 38.5%. Total option volume ran 1.06× its 20-day average, so this was an ordinary-sized session, not a stampede. Into Friday's settled expiration, the $665 calls added 3,444 contracts of open interest on 36,539 contracts of volume — real flow, but now history. The forward-looking builds were smaller and more scattered: 2,488 new contracts at the September 25 $647.50 calls, 1,810 at the October 16 $700 calls, and 1,438 at the September 18 $600 puts, which is the strike doing the work as this expiration's support shelf. The short-, medium- and long-horizon trend reads all point the same way (higher over the past week and past month, flat over the past two-plus months), so there's no near-term-versus-long-term tension to resolve here.
Expected move
Into September 18, the options market is pricing a ±4.96% move — ±$32.14 around Friday's $648.03 close, or a range of $615.89 to $680.17. That figure is derived from what at-the-money straddles cost: it's the one-standard-deviation move the chain is charging for, not a prediction.
| Expiration | Implied move | Range around $648.03 |
|---|---|---|
| September 14 (3 DTE) | ±2.40% | $632.48 – $663.58 |
| September 16 (5 DTE) | ±3.95% | $622.43 – $673.63 |
| September 18 (7 DTE) | ±4.96% | $615.89 – $680.17 |
| September 25 (14 DTE) | ±7.11% | $601.96 – $694.10 |
The ladder rises smoothly with time — there's no step-change between rungs, which is what a chain without a scheduled event inside the window looks like. The jump from ±2.40% to ±4.96% between the September 14 and September 18 rungs is just four extra calendar days of vol, not a catalyst being priced.
Volatility
IV rank is 39/100: today's implied volatility is cheaper than about 61% of the past year's readings, though the percentile measure (60/100) says more than half of the last year's sessions were quieter than this one — the two disagree because the 52-week high sits far above where IV has actually spent most of its time. Realized volatility, meaning how much META has actually been moving, is 36.0% over ten days, 36.8% over twenty and 37.3% over thirty. Two "versus its own norm" readings are worth flagging: the 20-day realized number is unusually low for this stock compared with its own recent history, while the ratio of five-day to twenty-day movement is running at 1.31 — unusually high. Translation: META has been quiet by its own standards for a month, and then it got busy again in the last week. Front-month term structure — comparing option prices across expiration dates — is unavailable today, an expiry-day artifact rather than missing data.
Premium rich or cheap? The volatility risk premium is the gap between how much movement options are priced for and how much META has actually delivered; when it's positive, option sellers have been collecting more than realized movement cost them. Right now that gap is essentially zero — options are priced about 0.1 vol points below the stock's delivered 20-day movement. But zero is unusually generous for this name: the reading sits at the 76th percentile of its own recent history, meaning today's gap is richer than roughly three-quarters of META's recent readings, and the series has climbed from about 12 vol points below delivered movement in late August. The snapshot reading on that same gap confirms the direction — it is running comfortably above this stock's own norm. The so-what: with IV rank at 39 and a premium that is merely fair in absolute terms, this is not a week where selling volatility carries an obvious edge. Structures that buy defined premium are on more honest footing, and anything you sell should be sold for structure reasons (the walls), not because the premium is fat.
Skew and sentiment
Skew measures whether puts and calls the same distance from the stock price cost the same. Here they don't — and not in the usual direction. The 25-delta put prints at 36.5% implied volatility against 37.5% for the 25-delta call, so calls are running about 1.0 vol point richer than puts. Traders are paying up for upside, not crash protection. That said, against this name's own 60-day median of 1.2 vol points of call richness, today is marginally less call-tilted than normal — a small step back from the extreme.
Put volume ran at 0.48× call volume on Friday, versus a three-day average of 0.58 and a seven-day average of 0.52 — call-heavy, and slightly more so than the recent norm. On the peer-relative screen, 19 call contracts cleared the unusual-volume bar against 11 puts, a call-side sweep dominance that is running above this stock's own recent baseline. Sentiment in short-dated options is where the picture muddies: the 0–7 day bucket scores −6 (essentially flat, and down from +61 two sessions before Friday), while the 7–30 day bucket sits at +16 and the 30–60 day bucket at +16. The one-phrase summary from the term reads: calm, with every bucket inside ±20. The seven-day average for the front bucket is +11, so Friday's flat print is a wobble, not a regime change.
The key levels map
| Level | Price | Why it matters |
|---|---|---|
| Swing resistance | $686.08 | The only clustered swing-pivot resistance above spot in the price structure |
| Top of implied range (Sept 18) | $680.17 | The upper rail of the ±4.96% move the chain is pricing |
| Secondary call shelf | $670.00 | 13,092 calls held open at the September 18 expiration; second-heaviest gamma strike across the whole chain |
| Technical resistance | $656.60 | Upper Bollinger Band and recent swing high per the 5-day chart model — the invalidation line for this read |
| Call wall (Sept 18) | $650.00 | 13,563 calls held open — the heaviest call strike for this expiration, and also the whole chain's heaviest call strike (49,161) and largest gamma strike. The two agree |
| Friday's close | $648.03 | Price is sitting 0.3% under its own overhead supply |
| Swing support | $642.70 | Nearest clustered swing-pivot support |
| Gamma shelf | $640.00 | Third-heaviest gamma strike chainwide; max pain for both the Sept 14 and Sept 25 expirations |
| Technical support | $636.77 | EMA34 and the stated support level in both chart reports |
| Swing support | $626.01 | Prior swing cluster |
| Max pain (Sept 18) | $625.00 | The price at which the most option value would expire worthless — expirations sometimes gravitate toward it |
| 200-day moving average | $623.23 | Price sits 3.98% above it |
| Bottom of implied range (Sept 18) | $615.89 | The lower rail of the priced-in move |
| Put wall (Sept 18) | $600.00 | 6,827 puts held open — this expiration's heaviest put strike, matching the whole chain's put wall (18,536) |
| Gamma flip estimate | ≈ $595 | One rough estimate suggests that below this price market-maker hedging amplifies selling rather than cushioning it |
| 20-day moving average | $586.47 | Price is 10.5% above it — the rally has stretched well clear |
Positioning and unusual flow
One rough estimate of dealer positioning puts the September 18 expiration in a positive-gamma regime, and the whole chain agrees. In that state, market makers hedge the options they've sold in a way that tends to dampen moves — selling into strength and buying into weakness. That is the mechanical argument for chop rather than a runaway leg, and it sits alongside a second observation: spot is currently an unusually large distance above the gamma flip estimate for this name, about 7.4% clear of it, which is the supportive rather than fragile side.
Three flow items stand out among contracts that are still live. The September 18 $670 calls traded 7,505 contracts against 13,092 held open — $3.87 million of premium, the most active single contract at the target expiration, and a leg 10¢ wide. The September 14 $660 puts traded 5,805 contracts against just 107 open, a 54× turnover worth $8.16 million: a deep in-the-money put moving that size against almost no standing position is usually a repositioning or synthetic trade, not a directional bet a reader should copy. And the September 16 $657.50 calls traded 1,732 against 87 open, at the top of their peer volume group. The common thread is that the fresh, urgent money is clustering in the $655–$670 band — right where the call wall's overhead supply begins.
3 · Technical check
The two chart models disagree with each other, which is itself informative. The 3-day model reads bearish, targeting $642.00 by September 16 with a projected range of $630.00 to $653.00. Its case: a MACD line that has crossed below its signal, money flow that has stayed in distribution territory (CMF −0.074) for essentially the entire rally, and RSI rolling down from 78.9 to 60.4. The 5-day model reads bullish, targeting $654.50 by September 18 with a projected range of $631.00 to $663.00, on the basis that price sits above every major moving average with ADX at 37.9 and +DI well clear of −DI — a strong, intact trend digesting a sharp breakout.
Against the options-implied range, both are mixed rather than confirming: the 5-day target of $654.50 sits comfortably inside the $615.89–$680.17 band the chain is pricing, and its projected high of $663.00 stops $17 short of the implied upper rail. The chart models are describing a tighter, chop-and-resolve path than the options market is charging for. Where they align with our read is the ceiling: both name $656.60 as resistance, and that is within $7 of the call wall. That agreement is why the strike selection below shades short calls to $670 and $672.50 — above both the wall and the technical ceiling — rather than trying to sell the $655 area.
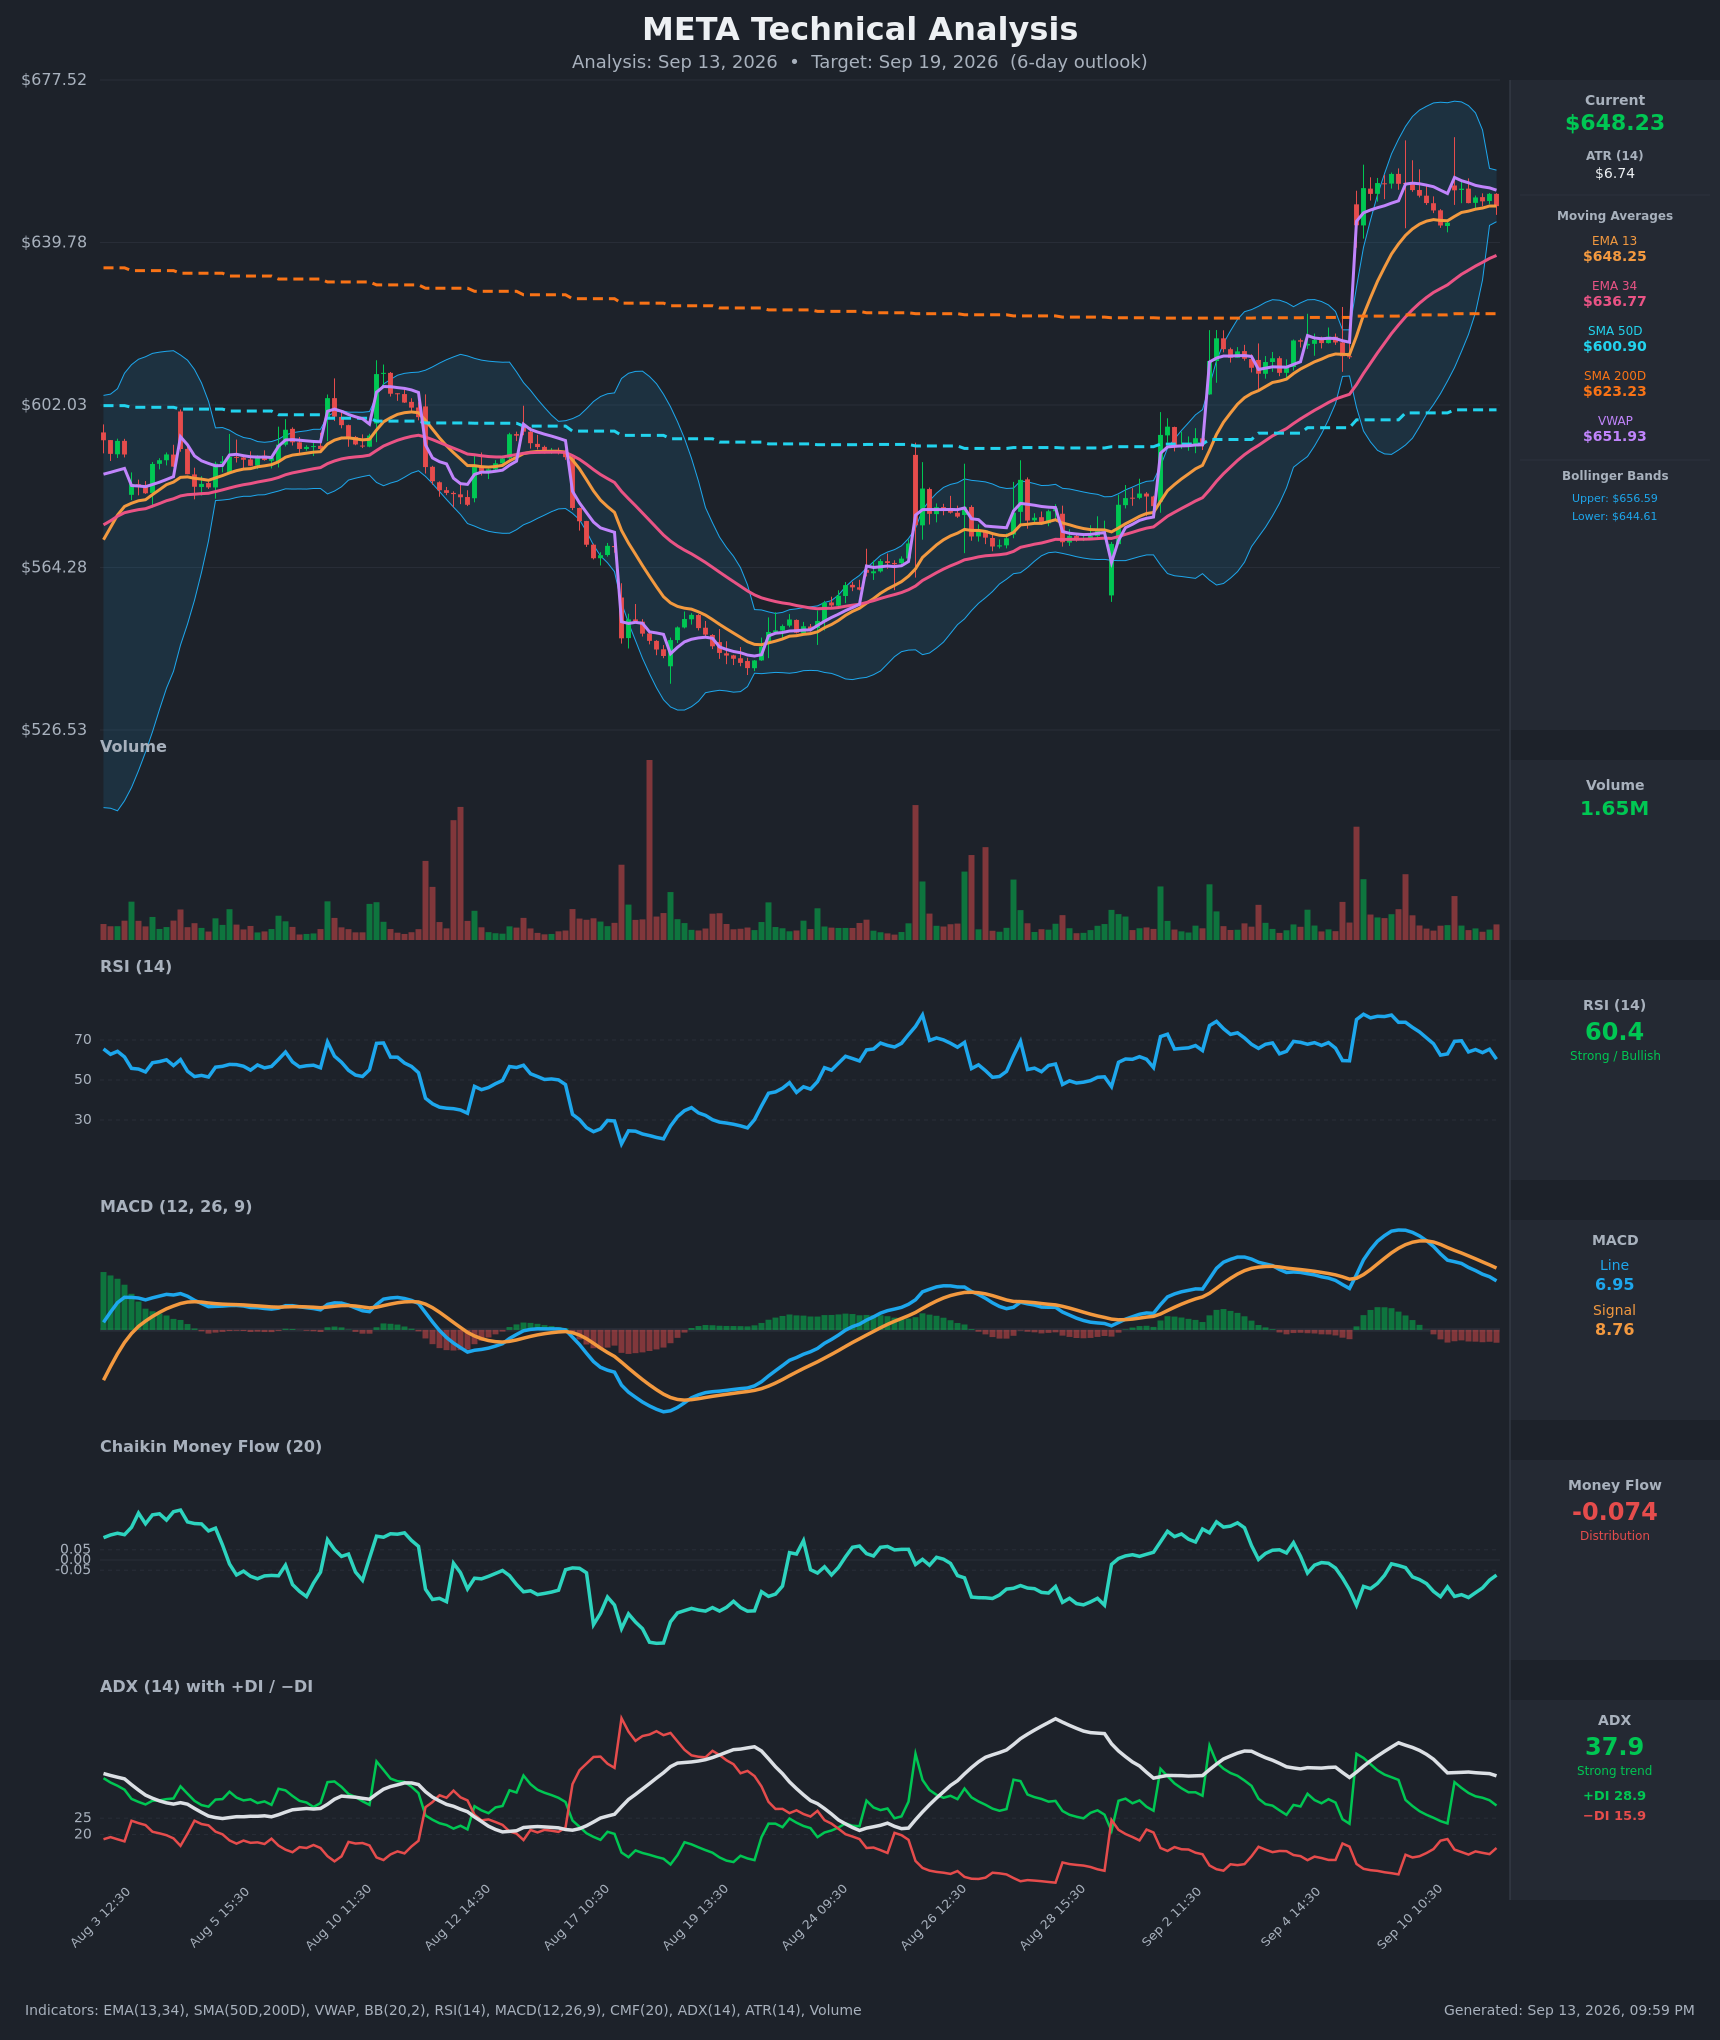
Model vs. Market: The options market implies $615.89–$680.17 into September 18; the 5-day technical model targets $654.50 within a $631.00–$663.00 band. The chart is pricing consolidation where the chain is pricing a $32 move in either direction — and whoever is right gets settled at $656.60.
Full technical write-ups: 3-day report → · 5-day report →
4 · Three ways the next five days can go
If META pushes above the call wall ($650): the heaviest call open interest for this expiration sits right there, and in a positive-gamma estimate that overhead concentration tends to slow rallies rather than fuel them — dealers hedging short calls sell into the advance. A clean break through $656.60 changes the read; above that the next dense shelf is the $670 strike, with another 13,092 contracts held open. That band, roughly $656 to $670, is where the market has drawn its line.
If META drifts between the walls: this is the path positioning is most naturally set up for. Max pain for September 18 sits at $625, $23 below Friday's close, and the corridor between the $600 put wall and the $650 call wall is nearly $50 wide. With the estimated gamma regime on the dampening side and no scheduled event in the window, expiring open interest and hedging flows tend to pull price toward the middle of that corridor rather than out of it. The $640 and $645 strikes carry the next-largest gamma concentrations and would act as the friction points on the way down.
If META breaks below the put wall ($600): that would require an 7.4% move, well outside the $615.89 lower rail the chain is pricing. Spot currently sits an unusually large distance above the gamma flip estimate near $595 for this name — further above it than on most recent sessions — so the fragile, hedging-amplifies-selling regime is not close at hand. Getting there inside five days would mean the implied move was badly underpriced.
5 · Three defined-risk structures
Prices are end-of-day midpoints as of 2026-09-11. All structures are hypothetical. Verify live prices before trading — these will be stale by the open.
If you lean bullish: September 18 $650/$670 call debit spread
- Trade: Buy the September 18 $650 call, sell the September 18 $670 call. A debit spread means you pay up front and you're betting the stock finishes above your long strike by more than you paid.
- Debit: $6.95 ($695 per spread) · Max profit: $1,305 · Max loss: $695 · Break-even: $656.95
- Why it fits: the break-even sits within 35¢ of the $656.60 level both chart models name as resistance, so this structure pays exactly and only if the call wall gives way. With the volatility premium merely fair rather than rich, paying defined premium is the more honest side of this market than collecting it — and the short $670 leg caps your cost at the next major open-interest shelf rather than paying for blue sky.
- Makes sense only if: you believe the aligned short- and medium-term trend reads matter more than the overhead call concentration.
- Invalidated if: META closes below $640.
- Managing it: this is a seven-day debit — theta bites hard in the back half. Take profit at roughly 60–70% of the spread's width if $670 is tagged early; because the short-term chart read fights the trade for the first three days, the interim checkpoint is September 16 — if you are still under $650 then, the odds of recovering the debit are thin and closing beats hoping.
- Liquidity note: the $650 calls were 30¢ wide (about 2.5% of mid) on 3,471 contracts and $4.20 million of premium; the $670 calls were 10¢ wide on 7,505 contracts. Fills are easy on both legs.
- Analyze this position →
If you lean bearish: September 18 $640/$625 put debit spread
- Trade: Buy the September 18 $640 put, sell the September 18 $625 put.
- Debit: $5.575 ($557.50 per spread) · Max profit: $942.50 · Max loss: $557.50 · Break-even: $634.43
- Why it fits: the short strike is placed exactly at $625, this expiration's max pain — the level expiring open interest tends to gravitate toward. You collect the maximum if the pin case plays out, and the long $640 strike sits just below the nearest swing support at $642.70 and the third-heaviest gamma concentration in the chain. The 3-day chart model's $642.00 target is the first milepost on this path.
- Makes sense only if: you read the MACD cross and persistent money-flow distribution as the honest signal and the call-side flow as late chasing.
- Invalidated if: META closes above $656.60.
- Managing it: the September 16 checkpoint is the decision point — if the pullback hasn't started by then, exit rather than pay for the last two days of decay. Take profit at around 70% of max value; don't wait for a perfect close at $625.
- Liquidity note: the $640 puts were 20¢ wide (about 2.2% of mid) on 1,853 contracts; the $625 puts were also 20¢ wide but that's 4.6% of a $4.35 mid, so use limits and expect to give up a few cents on the short leg.
- Analyze this position →
If you expect the range to hold: September 18 iron condor
- Trade: Sell the $622.50 put / buy the $617.50 put, and sell the $672.50 call / buy the $677.50 call, all September 18. A credit structure means you collect premium up front and keep it if the stock finishes between your short strikes.
- Credit: $1.845 ($184.50) · Max profit: $184.50 · Max loss: $315.50 · Break-evens: $620.66 and $674.35
- Why it fits: this is the structure that matches the neutral read most directly. Both short strikes sit outside the technical ceiling and the gamma shelves, the profit band is $53.69 wide against an implied move of ±$32.14, and the estimated positive-gamma regime is the mechanical argument for a range holding. Health warning: you're selling premium that hasn't actually been rich — the gap between implied and delivered movement is roughly zero, so the edge here comes from the walls and the corridor, not from overpriced volatility.
- Makes sense only if: you accept a sub-1:1 payoff ratio in exchange for a wide window, and you size it small.
- Invalidated if: META closes above $656.60 — that puts the short call inside striking distance with days left.
- Managing it: close at roughly 50% of the credit collected rather than holding to expiration; exit the whole structure by September 16 if either short strike is breached. Seven-day condors go wrong quickly.
- Liquidity note: the $672.50 calls were 20¢ wide (4.4% of mid) and the $677.50 calls 15¢ wide; the $617.50 puts were 14¢ wide. The $622.50 put is the weak leg — 20¢ wide on a $3.80 mid, about 5.3%, so budget for slippage there or shift that strike.
- Analyze this position →
If none of these: no trade
There is a real case for standing aside. IV rank at 39/100 is the middle of nowhere: not cheap enough to make owning premium a bargain, not rich enough to make selling it a gift — and the gap between implied and delivered movement is essentially zero, so the condor above is being paid in structure rather than in volatility edge. On top of that, the directional read is genuinely neutral, the two chart models point opposite ways inside the same week, and price is sitting within a rounding error of the single heaviest strike in the chain, which is the definition of a coin-flip location. Seven-day defined-risk trades are all gamma and no theta cushion. If you don't have a view on whether $650 breaks, the honest answer is that neither does the data — waiting for a decisive close on either side of the $625–$656.60 band costs you nothing but a few days.
6 · Quick FAQ
What is META's expected move this week? ±$32.14 (±4.96%) into the September 18 expiration, which works out to a $615.89–$680.17 range around the $648.03 close, per the options market's straddle pricing as of September 11.
Is META expected to go up or down over the next five days? Options positioning as of September 11 reads neutral — bullish flow signals (call open interest building, put protection being unwound, call-side sweeps dominating) are offset by price sitting directly beneath the heaviest call strike in the chain, with max pain $23 lower. That's a read of what traders have done, not a forecast. The actionable map is the $615.89–$680.17 range and the $600/$650 levels.
Are META options expensive right now? IV rank 39/100 says option prices are higher than about 39% of the past year's readings — the middle of the range. On top of that, they're running about 0.1 vol points below the movement META has actually delivered, though that gap is richer than roughly 76% of this stock's own recent readings. Verdict: fair, with no strong edge in either buying or selling volatility this week.
Where is META's biggest options support and resistance? Put wall $600.00 and call wall $650.00 for the September 18 expiration — and those match the whole chain's heaviest put and call strikes, so the near-dated and aggregate reads agree.
What invalidates this read? A daily close above $656.60 — through the call wall and the recent swing high both chart models flag as resistance.
Methodology & disclosures. Data: end-of-day options-chain snapshot for META, 2026-09-11, generated 2026-09-13T21:59:22.403Z. Prices shown are midpoints and will differ from live markets. Momentum/positioning scores and volatility-premium comparisons are descriptive measurements of past option flow and past price movement — not investment advice, signals, forecasts, or guarantees. All trade structures are hypothetical. Every structure shown has a defined maximum loss; you can lose the entire max-loss amount. Options involve substantial risk and are not suitable for all investors.