META Options Are Pricing a $36 Move — and the Chain's Weight Sits $18 Below Spot
The options market implies META trades between $629.67 and $701.83 into the September 25 expiration, but every piece of that expiration's open interest — call wall, put wall and max pain — sits below the current price. Here's what that positioning says, and three defined-risk ways to trade it.
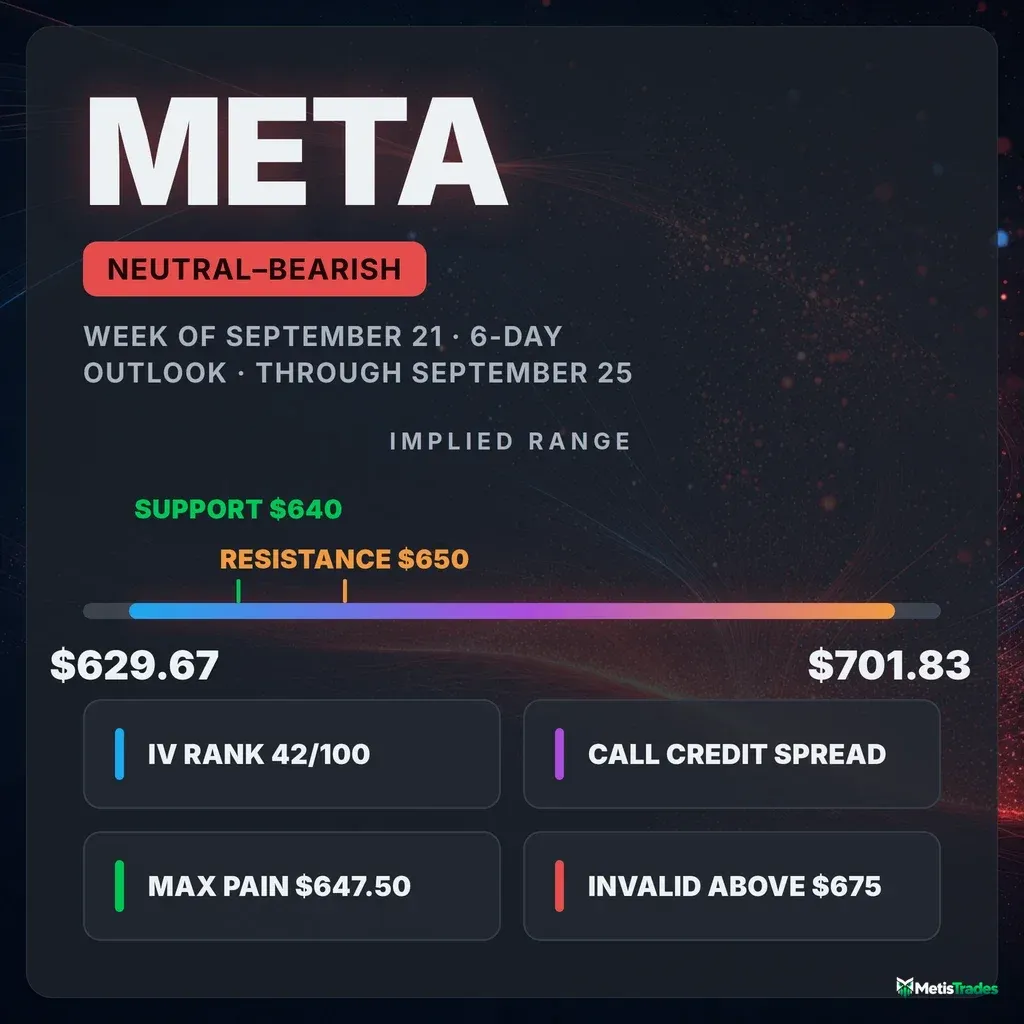
The options market implies a $629.67–$701.83 range into the September 25 expiration; here's what's driving it and three defined-risk ways to trade it.
Published Saturday, September 19, 2026 · Data as of Friday, September 18, 2026 close
Explore the live META options data in the Detailed Options Analyzer →
Quick answer
| Item | Answer |
|---|---|
| Market bias | Neutral-bearish |
| Options-implied range (into Sep 25) | $629.67 – $701.83 (±5.42%, or about ±$36.08) |
| Major support | $640.00 — the Sep 25 put wall |
| Major resistance | $650.00 — the Sep 25 call wall (the whole chain's heaviest call strike sits far above, at $700) |
| Max pain (Sep 25) | $647.50 |
| Dealer gamma regime (estimate) | Positive — market-maker hedging tends to dampen moves; flip level ≈ $625 |
| Volatility condition | Rising — IV rank 42/100 · premium rich: options priced about 7.9 vol points above delivered movement |
| Technical check | Confirms (bearish, 3-day and 6-day models) |
| Best-fitting strategy | Sep 25 $680/$690 call credit spread |
| Analysis invalidated if | META closes above $675 |
1 · What matters today
META closed Friday, September 18 at $665.75 after a violent two-day round trip from $682. Our read of the options data leans neutral-bearish into the September 25 expiration — not because traders are panicking, but because of where the positioning physically sits. Every anchor at that expiration is below the market: the heaviest call open interest at $650, the heaviest put open interest at $640, and max pain — the price at which the most option value would expire worthless — at $647.50. Short-dated puts are also pricing far richer than calls versus their own recent norm. The options market prices a ±$36.08 move (about ±5.42%), or a $629.67–$701.83 band, into Friday's expiration. Both technical models we checked agree on the direction. A close above $675 kills the thesis.
2 · What the options market is pricing
What changed this week
The five-day price tape is still green — META is up 2.73% over the last five sessions and a remarkable 21.97% over twenty — but Friday undid a lot of it, with the stock giving back roughly $16.50 from Thursday's $682.31 close on 27.5 million shares, 1.48× its 20-day average volume. That is the session that flipped the tone.
Underneath, option flow stayed call-tilted in volume terms: put/call volume came in at 0.49, meaning roughly one put traded for every two calls, against a 7-day average of 0.56 and a 14-day average of 0.52. Open interest tells the same story more emphatically — the put/call open-interest ratio sits at 0.28 (0.28 puts held open for every call), down from a 14-day average of 0.46, so put positions have been thinning out for weeks. Against that backdrop, Friday's single-day open-interest shift ran the other way: call open interest fell while put open interest built, an unusually put-heavy day for this name versus its own recent norm. Implied volatility — the market's estimate of how much META will move, baked into option prices — crept up 0.33% on the day and 2.85% over five sessions, and now sits about 5.5% above its 30-day average.
The short- and long-term trend reads still agree on up: price is higher over the past week and sharply higher over the past two months, and our trend engine labels the horizons aligned and bullish. But the momentum composite registered a fresh bearish crossover on Friday — a weak one, the narrowest possible flip, yet the first turn since late August. That is the tension in this week's data: price structure says uptrend, Friday's flow says the near-term push is tired.
Expected move
Into the September 25 expiration, the options market is pricing a move of about ±$36.08 (±5.42%) — the move implied by what straddles cost — which frames a $629.67 to $701.83 band around Friday's $665.75 close. That rung of the chain prices at roughly 39.2% implied volatility.
| Expiration | Implied move | Range around $665.75 |
|---|---|---|
| Fri, Sep 25 (7 days) | ±5.42% | $629.67 – $701.83 |
| Mon, Sep 28 (10 days) | ±5.93% | $626.27 – $705.23 |
| Fri, Oct 2 (14 days) | ±7.42% | $616.35 – $715.15 |
| Fri, Oct 16 (28 days) | ±10.46% | $596.11 – $735.39 |
The ladder steps up smoothly with time, with no kink or jump between rungs — the chain is not bracing for any single dated event inside this window; it is simply charging for more calendar. (Two nearer expirations, September 21 and 23, are excluded: their call- and put-side quotes disagreed too much to price a reliable expected move.)
Volatility
At-the-money implied volatility across the chain sits at 37.75%, with an IV rank of 42/100 — where today's IV sits versus the past year, so 42 means option prices are richer than roughly 42% of the past year's readings and cheaper than the other 58%. That is squarely middling, and it has barely budged: the 7-day average IV rank is 43.3 and the 14-day average 40.5. Current IV is about 5.5% above its 30-day moving average of 35.8% but still below the 90-day average of 38.9%. Front-month term structure — comparing option prices across expiration dates — is unavailable in Friday's snapshot because the nearest expiration was that day's expiry, a normal artifact rather than missing data.
One "vs its own norm" reading stands out: META's 20-day realized volatility, at 29.9%, is running unusually low for this stock — well below its own recent history — even as the five-day pace of movement is essentially in line with the 20-day. In plain terms, the actual day-to-day movement of the past month has been calmer than this name normally delivers.
That gap is the whole story on premium. The volatility risk premium — the gap between how much movement options are priced for and how much META has actually delivered — is running at about 7.9 vol points, and sits in the 96th percentile against this stock's own recent readings, meaning richer than roughly 96% of them. It got there fast: the gap was under one vol point on September 14, spiked above eleven by September 16, and has eased back to today's level. Nothing on the earnings calendar sits close enough to inflate it mechanically. The combination — a middling IV rank of 42/100 layered on a premium over delivered movement near the top of its own range — favors collecting premium this week rather than owning it, and that is why the credit structures lead the trade section below.
Skew and sentiment
The clearest sentiment signal in Friday's data comes from the front of the curve. In expirations inside seven days, 25-delta puts are pricing about 7.4 vol points over the equivalent calls, against a roughly 3.7-point call-side tilt that has been the norm over the prior ~59 trading days — an 11-point swing toward downside protection. Puts and calls the same distance from the stock price don't normally cost the same, and when puts get this much pricier, traders are paying up hard for crash protection. The 7-to-30-day expirations show the same tilt, about 4.9 points richer on the put side than usual. (A chain-wide 25-delta skew reading wasn't available Friday; the 60-day median for this stock is about 1.1 vol points on the call side, which is the baseline that front-end swing is running against.)
Our read of sentiment by expiration bucket reflects it: the 0–7 day bucket scores −32 and the 7–30 day bucket −31, both meaningfully more negative than their own 7-day averages of −15 and −12. Further out, the picture inverts — the 30–60 day bucket reads +33 and the 60–120 day bucket +19, both call-tilted. The overall regime label is "Mixed," and it earns it: near-dated traders are hedging while longer-dated positioning keeps leaning up. Delta-weighted volume stayed call-dominated in every bucket, so this is protection being bought on top of bullish exposure, not wholesale liquidation.
The key levels map
| Level | Price | Why it matters |
|---|---|---|
| Implied range high (Sep 25) | $701.83 | Top of the ±5.42% band the options market is pricing |
| Whole chain's heaviest call strike | $700.00 | 45,377 calls open across all expirations and the second-largest gamma cluster — a genuine ceiling, but months of expirations deep |
| Swing resistance | $686.08 | Heuristic level from recent swing-pivot clustering (an estimate, not a guaranteed reaction zone) |
| Recent high | $682.31 | Thursday's close, rejected hard on Friday |
| Technical resistance | $673.33 | Both chart models put the reclaim level here |
| Spot / last close | $665.75 | Friday's close |
| Call wall (Sep 25) | $650.00 | The heaviest call open interest at Friday's expiration (4,585) — it sits below spot, so it is not overhead resistance this week; it is also the whole chain's largest gamma strike and its aggregate put wall (16,761 puts) |
| Max pain (Sep 25) | $647.50 | The price at which the most option value would expire worthless — expirations sometimes gravitate toward it |
| Swing support | $642.70 | Nearest heuristic support level from price structure (an estimate) |
| Put wall (Sep 25) | $640.00 | Heaviest put open interest at Friday's expiration (6,185) — the level with the most hedging interest beneath the market |
| Implied range low (Sep 25) | $629.67 | Bottom of the ±5.42% band |
| Gamma flip estimate | ≈ $625.00 | One rough estimate of where market-maker hedging would start amplifying selling rather than cushioning it |
| 200-day moving average | $624.16 | Price sits 6.66% above it — the longer trend is intact |
| 20-day moving average | $614.61 | Price is still 8.32% above it, a sign of how stretched this run has been |
The single most important observation here: for the September 25 expiration, both walls sit below the market. That is unusual, and it drives the bias. The whole-chain aggregate paints a very different picture — heaviest calls at $700, heaviest puts at $650 — but that is a blend of twelve expirations out to November, and this week's contracts are the ones that actually settle Friday.
Positioning and unusual flow
The dealer gamma estimate reads positive for the September 25 expiration and for the chain overall, which under the model's assumed sign convention means market-maker hedging tends to dampen moves rather than accelerate them. Treat that as an estimate built on an assumed dealer positioning convention, not observed inventory — but if it holds, it argues for chop inside the range rather than a one-way slide.
Three flow items stood out on Friday, all still live:
- September 21 $675 calls: 19,226 contracts traded against just 1,167 open — about $5.4 million of premium changing hands in three-day lottery tickets on a bounce back to the highs. Open interest only rose 603, so most of that volume opened and closed intraday.
- September 25 $650 puts: 2,011 contracts traded against 2,333 open, the top of their peer group for turnover — traders positioning right at the strike that anchors this expiration's whole structure.
- October 2 $692.5 calls: 1,126 contracts, roughly $1.1 million of premium, on zero prior open interest — a fresh upside bet a week past this article's window.
Elsewhere, the largest genuine open-interest builds were modest and call-side: +735 at the September 25 $675 calls and +716 at the November 20 $700 calls. That is the bullish counterweight to the put-rich front-month skew.
3 · Technical check (the 20%)
Both technical models we ran are bearish, and both land inside the options-implied range — a Confirms on each count. The 3-day model (target date September 22) projects $657.50 with a $648.00–$674.00 band, citing a MACD bearish crossover, RSI collapsing from above 70 to 42.6, and a fresh −DI over +DI flip on a strongly trending ADX reading of 43.2. The 6-day model (target date September 25, matching our expiration) projects $653.00 with a $638.00–$674.00 band, adding that money-flow has shown sustained distribution (CMF at −0.247) through the entire final leg of the rally — the flow measure never confirmed the price highs.
Both write-ups make the same important caveat, and it matches the options data: price remains well above the 50-day ($607.38) and 200-day ($624.16) averages, so this is a pullback inside a larger uptrend, not a trend reversal. The dominant bearish scenario in the 6-day model invalidates on a strong close back above $675 — which is where we set this article's kill switch too.
Model vs. Market: The options market implies $629.67–$701.83 into September 25; the 6-day technical model targets $653.00 within a $638.00–$674.00 band. The chart model is picking the lower half of a range the options market treats as symmetric — and its $674 ceiling sits nearly $28 below the options' upside rail. If both are right, the resolution is a drift down through the middle rather than a violent break either way.
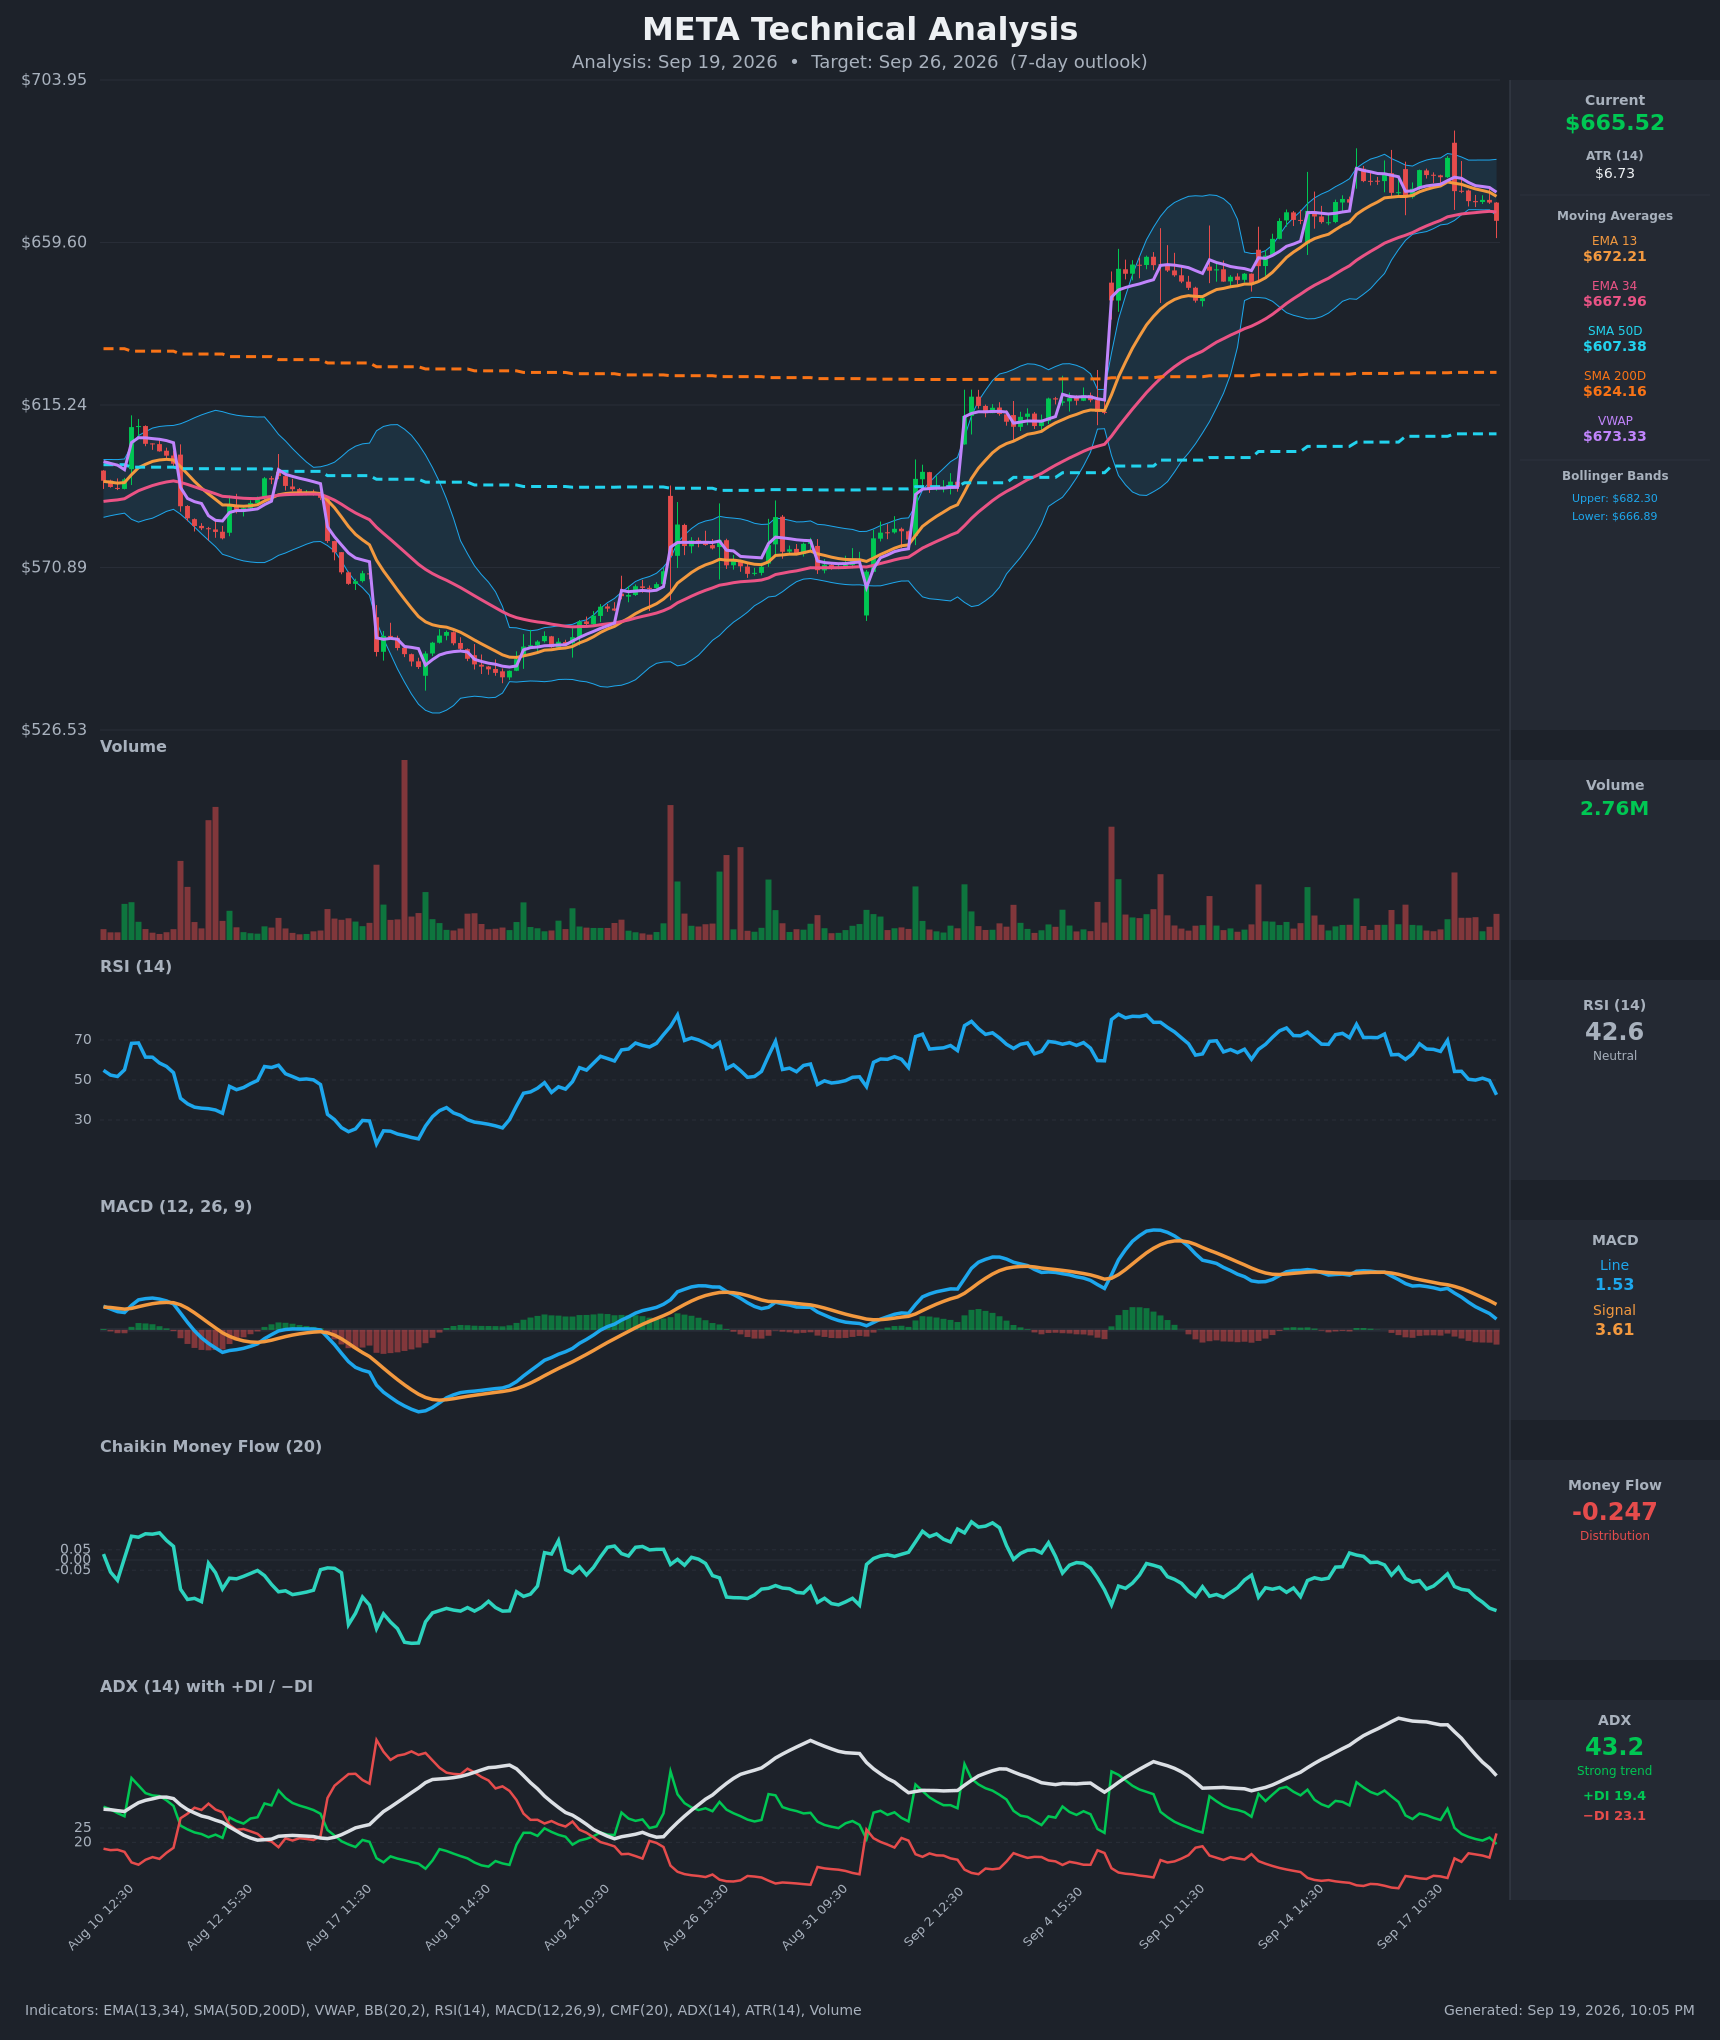
The TA did adjust strike selection below: the short call in the lead structure sits at $680, just above both models' $674 ceiling and above the $673.33 resistance both cite, rather than further out where the credit would be thinner.
Full technical write-ups: 3-day report → · 6-day report →
4 · Three ways the next six days can go
If META pushes back above $675 and holds: the September 21 and 25 call buying gets paid, and the positioning map thins out quickly above $686 — there is no meaningful call open interest at this expiration overhead, because the heaviest call strike sits down at $650. That means a reclaim would face less option-related friction than usual, with the next real cluster not until $700 in later expirations. This is also the level that invalidates everything below.
If META drifts between $640 and $675: this is the base case, and it is what a positive dealer gamma estimate tends to produce — hedging flows that lean against each move instead of chasing it. With max pain at $647.50 and both walls beneath the market, the pull of expiring open interest points gently lower into Friday rather than sideways. Note that max pain sits below the implied range's midpoint but comfortably inside the band; a drift into the $645–$655 zone would satisfy both the positioning map and both chart models.
If META breaks below the $640 put wall: the heaviest hedging interest at this expiration gets breached, and the next structural markers are the $629.67 implied-range floor and then the $624.16 200-day average. Spot currently sits comfortably above the gamma flip estimate near $625 — the supportive side of that line — so the cushioning effect of hedging would remain in place for most of that move. Below roughly $625, one rough estimate suggests market-maker hedging starts amplifying selling rather than absorbing it, which is a materially different regime from the one the chain is in today.
5 · Three defined-risk structures
Prices are end-of-day midpoints as of 2026-09-18. All structures are hypothetical. Verify live prices before trading — these will be stale by the open.
If you lean bearish (the bias): Sep 25 $680/$690 call credit spread
- Trade: Sell the September 25 $680 call, buy the September 25 $690 call
- Credit: $2.90 ($290 per spread) · Max profit: $290 · Max loss: $710 · Break-even: $682.90
- Why it fits: A credit spread means you collect premium up front and keep it if the stock stays below your short strike. This one gets paid by the two things the data actually supports: a premium over delivered movement in the 96th percentile of its own range, and a September 25 positioning map whose entire weight sits below spot. The $680 short strike sits above both chart models' $674 ceiling and above Thursday's $682.31 high is the pain point — note the break-even at $682.90 sits just above it.
- Makes sense only if: you believe Friday's rejection at $682 holds and the stock does not reclaim the $673–$675 zone with conviction.
- Invalidated if: META closes above $675.
- Managing it: close at roughly 50% of max credit; with a short-term bearish read fighting a very much intact longer-term uptrend, take profits early rather than holding for the last few cents. If META closes through $680, close the spread rather than hoping for a Friday reversal.
- Liquidity note: the $680 calls quoted 65¢ wide and the $690 calls 45¢ (about 7–8% of mid), on 2,009 and 2,753 contracts of volume respectively. Workable, but use limit orders — you will not get filled at the midpoint by accident.
- Analyze this position →
If you expect the range to hold: Sep 25 $635/$645/$685/$695 iron condor
- Trade: Sell the $645 put and buy the $635 put; sell the $685 call and buy the $695 call, all expiring September 25
- Credit: $4.85 ($485) · Max profit: $485 · Max loss: $515 · Break-evens: $640.15 and $689.85
- Why it fits: An iron condor is two credit spreads — you collect on both sides and keep the full credit if the stock finishes between the short strikes. The lower break-even at $640.15 sits essentially on the $640 put wall; the short put at $645 sits just under max pain at $647.50, and the short call at $685 sits above Thursday's high. With a 96th-percentile premium over delivered movement and a positive dealer gamma estimate that tends to dampen moves, this is the structure the volatility data most directly argues for.
- Makes sense only if: you think the ±$36.08 the market is pricing overstates what actually happens — which is exactly what the realized-volatility reading has been saying for a month.
- Invalidated if: META closes outside $640 or $686 — at that point one side is under real pressure and the trade is no longer a range bet.
- Managing it: close at roughly 50% of max credit, or roll the threatened side. Exit the whole position by Wednesday, September 23 if it hasn't worked — gamma risk in the last two sessions dominates whatever theta is left.
- Liquidity note: every leg quoted 30–65¢ wide, roughly 7–10% of mid. The $645 puts traded 305 contracts against 1,632 open and the $635 puts 711 against 1,227, so fills exist but slippage is real on a four-leg order — leg in or use a marketable limit on the package.
- Analyze this position →
If you lean bullish: Sep 25 $650/$640 put credit spread
- Trade: Sell the September 25 $650 put, buy the September 25 $640 put
- Credit: $2.95 ($295) · Max profit: $295 · Max loss: $705 · Break-even: $647.05
- Why it fits: This is the trade for readers who think Friday was profit-taking inside a 22%-in-a-month uptrend and that the put-side skew is hedging rather than conviction — a reading the longer-dated buckets support, since 30–60 day and 60–120 day positioning both still lean call-side. The short strike is $650, the expiration's call wall and the chain's largest gamma strike; the long strike is the $640 put wall. Break-even at $647.05 sits within pennies of max pain.
- Makes sense only if: you expect the $640–$650 shelf to hold into Friday, which is precisely what a positive gamma regime plus the heaviest open interest in the expiration would suggest.
- Invalidated if: META closes below $640.
- Managing it: close at roughly 50% of max credit; with the near-term flow leaning against you, do not hold this one into Friday morning hoping for the last of the decay.
- Liquidity note: the $650 puts quoted 50¢ wide on 2,011 contracts, the $640 puts 40¢ wide on 1,165 contracts and 6,185 open — the most liquid put pair at this expiration.
- Analyze this position →
If none of these: no trade
Premium is genuinely rich here — the 96th-percentile gap over delivered movement is not an artifact of an upcoming report, and that is the strongest argument in this article for selling something. So standing aside has to clear a real bar. Two things clear it. First, execution: every relevant strike at this expiration quotes 7–10% of mid wide, which on a $290 credit means a meaningful slice of the edge disappears at entry and again at exit. Second, direction: a slightly bearish positioning read is fighting a stock up 21.97% in twenty sessions and sitting 9.6% above its 50-day average. Momentum like that can absorb a bad week and keep going. If you can't work the spreads patiently, or you'd be uncomfortable defending a short call against a fresh leg higher, no position is the honest answer.
6 · Quick FAQ
What is META's expected move this week? About ±$36.08 (±5.42%) into the September 25 expiration — a $629.67 to $701.83 band around the $665.75 close, per the options market's straddle pricing as of September 18.
Is META expected to go up or down over the next six days? Options positioning as of September 18 leans neutral-bearish — the September 25 call wall ($650), put wall ($640) and max pain ($647.50) all sit below spot, and short-dated puts are pricing about 7.4 vol points over matching calls — but that's a read of what traders have done, not a forecast. The actionable map is the $629.67–$701.83 range and the $640/$650 levels.
Are META options expensive right now? Two lenses. IV rank of 42/100 says option prices are higher than about 42% of the past year's readings — middling. But they're also running roughly 7.9 vol points above the movement META has actually delivered, richer than about 96% of this stock's own recent readings. On balance that favors collecting premium rather than buying it, and no scheduled report is inflating the number.
Where is META's biggest options support and resistance? For the September 25 expiration, the put wall is $640.00 and the call wall is $650.00 — both below the current price, which is what makes this week's map unusual. Across the whole chain, the heaviest call strike sits far above at $700.
What invalidates this week's read? A close above $675. That is also where the 6-day technical model's dominant bearish scenario invalidates.
Methodology & disclosures. Data: end-of-day options-chain snapshot for META, 2026-09-18, generated 2026-09-19T22:05:35.049Z. Prices shown are midpoints and will differ from live markets. Momentum/positioning scores and volatility-premium comparisons are descriptive measurements of past option flow and past price movement — not investment advice, signals, forecasts, or guarantees. All trade structures are hypothetical. Every structure shown has a defined maximum loss; you can lose the entire max-loss amount. Options involve substantial risk and are not suitable for all investors.