MSFT Options Are Pricing a ±$15.71 Move Into Friday — Our Chart Model Only Sees $500.75
The options market implies a $479.92–$511.34 range for Microsoft into the September 18 expiration, with max pain and the heaviest put open interest both parked at $480. Here's what's driving the setup and three defined-risk ways to trade it.

The options market implies a $479.92–$511.34 range into the September 18 expiration; here's what's driving it and three defined-risk ways to trade it.
Published Sunday, September 13, 2026 · Data as of the September 11, 2026 close
Explore the live MSFT options data in the Detailed Options Analyzer →
Quick answer
| Item | Answer |
|---|---|
| Market bias | Neutral |
| Spot (chain snapshot) | $495.63 |
| Options-implied range (into Sept 18) | $479.92 – $511.34 (±3.17%, or ±$15.71) |
| Major support | $480.00 (Sept 18 put wall) |
| Major resistance | $525.00 (Sept 18 call wall) |
| Max pain (Sept 18) | $480.00 |
| Dealer gamma regime (estimate) | Positive — market-maker hedging tends to dampen moves; flip level ≈ $350 (chain-wide estimate, far below spot) |
| Volatility condition | Falling — IV rank 18/100 · premium mildly rich: options priced ~1.9 vol points above delivered movement |
| Technical check | Mixed (bullish on both the 3-day and 5-day chart models, but entirely inside the options range) |
| Best-fitting strategy | Iron condor — $475/$480 puts, $510/$515 calls, Sept 18 |
| Analysis invalidated if | MSFT closes below $480 |
1 · What matters today
Microsoft closed at $495.63 after slipping 2.84% over five sessions — but it's essentially flat over twenty, which tells you this was a wobble inside a range, not a trend change. The options market is pricing a move of roughly $15.71 up or down into Friday, September 18, giving a $479.92–$511.34 corridor. That's the move the options market is pricing in, derived from what at-the-money straddles cost.
Two numbers anchor the week. The heaviest pile of put contracts for that expiration sits at $480 — and max pain, the price where the most option value would expire worthless, sits at $480 too. The heaviest call pile is all the way up at $525. The chain is bracketing a wide corridor with its downside anchor right at the bottom edge of the expected move. Our read of the flow lands genuinely neutral: bullish and bearish signals roughly cancel. Two chart models lean modestly higher, and both of their projections fit comfortably inside what the options already price. A close below $480 breaks the whole picture.
2 · What the options market is pricing
What changed this week
Price did less than the flow suggests. MSFT is down 2.84% over the trailing five sessions and down just 0.24% over twenty — a round trip, not a breakdown. Implied volatility (the market's estimate of how much MSFT will move, baked into option prices) fell 8.2% in a single session on Friday and is down 28.9% over thirty days, leaving at-the-money IV at 23.7% against a 30-day average of 27.1% and a 90-day average of 32.5%. Option prices have been deflating steadily all month.
Underneath that, hedging quietly built. Put open interest relative to call open interest climbed from 0.30 to 0.39 across five sessions — for every call contract held open there are now 0.39 puts, against a 14-day average of 0.33. That's still a call-dominated chain, but the drift is one-directional. Friday's session cut the other way: put volume ran at just 0.46 of call volume versus a 0.59 seven-day average, the most call-tilted day in over a week.
The biggest genuine open-interest builds were all October-dated: the October 16 $470 puts added 2,396 contracts, the October 16 $485 puts added 2,204, and the October 16 $495 calls added 2,222. Traders are building structure a month out on both sides rather than committing to this Friday. Into Friday's now-settled September 11 expiration, meanwhile, the $497.50 and $500 calls churned 42,537 and 39,670 contracts on the way to expiring — noise from a lottery-ticket expiry, not positioning that carries forward.
One tension worth naming: the short- and long-term trend reads disagree. The past week's price action reads bearish (−2.8%), the past month reads flat, and the past ten weeks read strongly bullish (+28.8%). The near-term flow and the bigger trend are pointing different ways, which is exactly the condition that produces a chop-and-reverse week rather than a clean move.
Expected move
Into September 18, the options market is pricing roughly ±$15.71 (±3.17%) around $495.63 — a $479.92 to $511.34 corridor by Friday's close.
| Expiration | Implied move | Range around $495.63 |
|---|---|---|
| Wed, Sept 16 | ±2.41% | $483.69 – $507.58 |
| Fri, Sept 18 | ±3.17% | $479.92 – $511.34 |
| Fri, Sept 25 | ±4.47% | $473.48 – $517.79 |
| Fri, Oct 2 | ±5.67% | $467.53 – $523.73 |
The step from Wednesday to Friday is steeper than two extra calendar days should justify: the September 16 rung carries 20.6% at-the-money IV while the September 18 monthly carries 22.9%. Monthly expirations attract the institutional hedging and the wider strike ladder, and they price accordingly. Beyond that, the ladder scales smoothly — there's no event bump anywhere in the next three weeks.
Volatility
At-the-money IV of 23.7% puts MSFT's IV rank at 18/100 — where today's IV sits versus the past year, meaning option prices are cheaper than about 82% of the past year's readings. The IV percentile agrees at 17.9. Direction is down across every window: −8.2% on the day, −1.3% over five sessions, −28.9% over thirty. The front-month read is unavailable today — the September 11 snapshot was itself an expiry day, so the front-month tenor can't be interpolated — which also means the term-structure comparison across expiration dates sits out this week.
The stock has been unusually still by its own standards. Twenty-day realized volatility is 21.8%, a reading well below this name's own recent norm, and the five-day-versus-twenty-day ratio of 0.78 says movement has been decelerating, not accelerating. Compare that against this stock's own recent history — "unusually quiet" here means unusual for MSFT, not versus the broader market.
Premium rich or cheap: the volatility risk premium — the gap between how much movement options are priced for and how much MSFT has actually delivered — sits at about 1.9 vol points positive. Option sellers have been collecting a bit more than realized movement has cost them. That gap ranks around the 61st percentile against this stock's own recent readings, meaning it's richer than roughly 61% of them: modestly rich, not stretched. Worth naming honestly: the deeply negative readings from late August flipped positive on August 27, and that flip was mechanical — a large prior gap rolling out of the 20-day realized-vol window — not traders changing their minds. The verdict: IV rank of 18 says premium is cheap in absolute terms, while a 61st-percentile premium over delivered movement says sellers are still being paid slightly above fair. That combination doesn't hand you an edge in either direction; it argues for structures that collect a little premium with both wings defined rather than for outright long or short volatility bets.
Skew and sentiment
25-delta skew — the fact that puts and calls the same distance from the stock price don't cost the same — sits at 0.70 vol points of put richness, against a 60-day median of roughly −0.09 vol points. In plain terms: puts normally trade a hair under calls for this name, and right now they trade about 0.8 vol points over. Traders are paying up for downside protection by MSFT's own standards, though the absolute gap is small (25-delta puts at 24.4% IV versus 25-delta calls at 23.7%). Note that today's 0.70 reading is actually below the 1.39-point three-day average — the put bid has eased since midweek.
Flow was the other way on Friday. Net new open interest came in unusually call-heavy for this name: call open interest grew 53,256 contracts against 11,119 for puts in a single session, one of the more lopsided call builds in recent memory. Seven call contracts cleared the unusual-volume bar against five puts. Total option volume ran at 0.89 of its 20-day average — an ordinary, not frantic, session.
Sentiment in short-dated options is genuinely split. The 0–7 day bucket reads meaningfully bullish, the 7–30 day bucket is barely positive, and everything past 30 days leans mildly bearish — the longest bucket most of all. The one-phrase summary the data gives is mixed: no single regime dominates. That split is the single biggest reason this article's bias lands where it does.
The key levels map
| Level | Price | Why it matters |
|---|---|---|
| 52-week high | $553.72 | 10.5% overhead; the ceiling of the past year |
| Heaviest call strike, whole chain | $550.00 | 76,471 contracts, but concentrated in October — not this Friday's level |
| Call wall (Sept 18) | $525.00 | 28,772 call contracts held open — the level that caps upside for this expiration |
| Secondary call shelf (Sept 18) | $520.00 | 13,347 contracts; the next stop if $515 gives way |
| Swing resistance | $515.72 | Heuristic level from recent swing-pivot clustering — an estimate, not a guaranteed reaction zone |
| Call open interest cluster (Sept 18) | $510.00 | 16,508 contracts; also the second-heaviest gamma strike chain-wide |
| Top of implied range | $511.34 | Upper rail of Friday's expected move |
| Sept 1 gap origin | $507.29 | The stock gapped down 1.93% from here and hasn't reclaimed it |
| Largest gamma strike, chain-wide | $500.00 | 17,485 Sept 18 calls open; round-number magnet with the heaviest total gamma of any strike |
| Spot / 20-day moving average | $495.63 / $494.43 | Price is sitting 0.24% above its 20-day average — dead centre |
| Put cluster (Sept 18) | $490.00 | 3,908 put contracts; first real downside shelf |
| Put cluster (Sept 18) | $485.00 | 2,722 put contracts |
| Put wall + max pain (Sept 18) | $480.00 | 12,462 put contracts and the max-pain strike; also the chain-wide put wall at 20,825 contracts |
| Bottom of implied range | $479.92 | Lower rail of Friday's expected move — effectively the same level |
| Swing support | $477.15 | First price-structure support below the put wall (estimate) |
| Swing support | $466.32 | Next cluster down (estimate) |
| 50-day moving average | $453.67 | 9.25% below spot — the trend cushion is a long way down |
| 200-day moving average | $431.26 | 14.9% below; the long-term uptrend is nowhere near threatened |
| Gamma flip estimate | ≈ $350 | One rough estimate of where hedging flips from dampening to amplifying — far below spot and not in play this week |
Worth flagging: the whole-chain call wall ($550) and this Friday's call wall ($525) are different levels. The $550 pile is October-dated. For the next five days, $525 is the number that matters — and the two put walls agree at $480, which is unusually tidy.
Positioning and unusual flow
The dealer gamma estimate for the September 18 expiration is positive, and it's the largest single-expiration reading in the near-dated chain. Under the standard assumption that market makers are net long calls and net short puts, positive gamma means their hedging tends to dampen moves — selling into strength, buying into weakness. Treat that as an estimate built on an assumed convention, not observed dealer inventory. But it does fit the picture: the flip level where that hedging would reverse sits far below at roughly $350, and spot is currently sitting unusually far above that estimate even by this stock's own history. Fragility is not this week's problem.
Three non-expired flow items stood out. The September 18 $512.50 calls traded 2,161 contracts against just 223 held open — a turnover ratio near 10, the signature of fresh speculative buying rather than existing positions being managed. The $517.50 calls for the same date traded 468 against 41 open. Both are lottery tickets positioned above the implied-move ceiling. The real money, though, sat lower: the September 18 $500 calls changed hands on about $1.64 million of premium (3,703 contracts against 17,485 open), and the $495 calls on roughly $1.06 million. The $490 puts, the heaviest put flow of the day, moved about $796,000. In dollar terms this was a balanced, at-the-money session — not a directional stampede.
3 · Technical check
Both chart models lean bullish, and both are modest about it. The 3-day model targets $499.00 by September 16 with a projected range of $488.50–$503.50, citing a MACD histogram that flipped positive around September 11, a short-term moving-average cross back to the upside, and money-flow turning from mild distribution to mild accumulation. Its dominant scenario — a continuation toward the $500–$503 band — is invalidated on a close back below $493.
The 5-day model, which lands exactly on our September 18 target date, targets $500.75 with a projected range of $486.00–$508.50. It reads the past three weeks as a range between roughly $483 and $513 and puts 45% odds on a push toward the $506–$509 shelf, with invalidation on a close below $489. It also notes trend strength is building but not yet established — the sort of hedge that matches what we see in the options.
Classification: Mixed. The direction leans higher where the options data is flat, but the magnitude confirms rather than challenges — the entire 5-day projected range ($486.00–$508.50) nests inside the options-implied range ($479.92–$511.34), and the $500.75 target is barely 1% above spot. In other words, the chart model is picking a side within a box the options market has already drawn.
Model vs. Market: The options market implies $479.92–$511.34 into Friday; the 5-day technical model targets $500.75 inside a narrower $486.00–$508.50 band. The gap isn't about direction — it's about tails. Options are pricing about $6 more downside room than the chart model contemplates, which is exactly what you'd expect when 25-delta puts are running richer than their own norm.
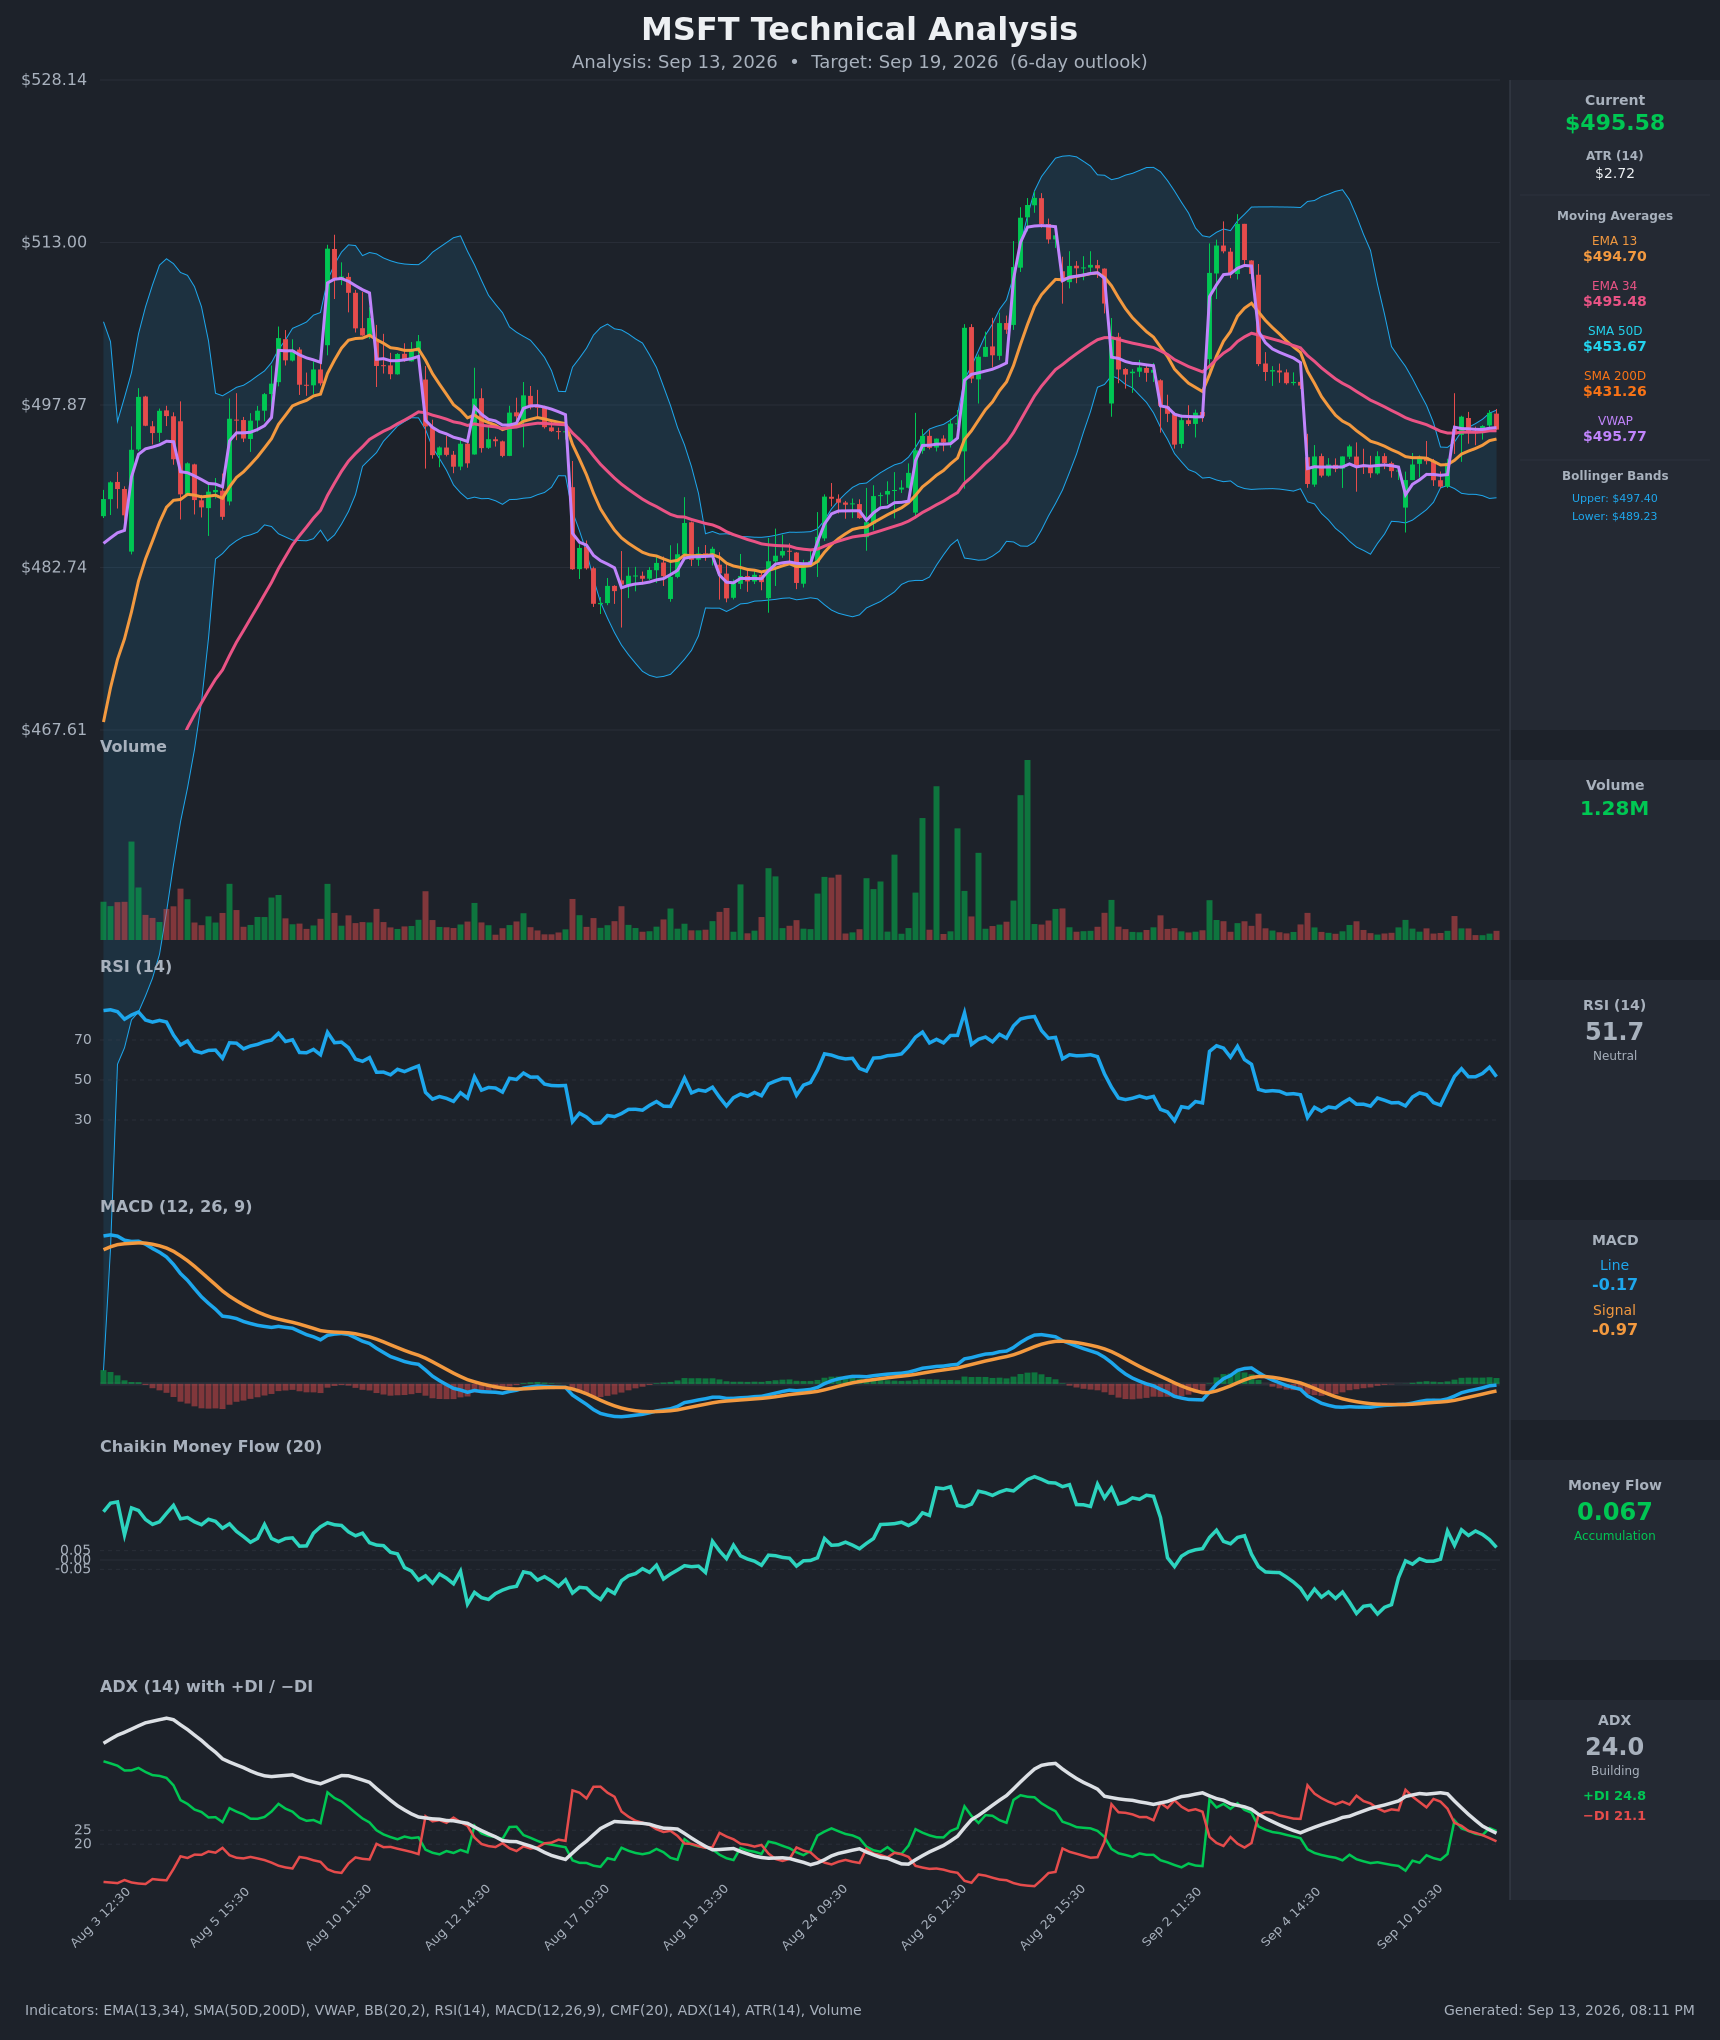
How this shaped the strikes below: the bullish chart read pushed the short call in the range structure out to $510 rather than $505, and it's why the bearish structure sits above the September 1 gap origin rather than closer to spot. It did not move the bias.
Full technical write-ups: 3-day report → · 5-day report →
4 · Three ways the next five days can go
If MSFT pushes above $511 and presses the call wall ($525): the $510, $515 and $520 strikes hold a combined pile of call open interest that tends to slow rallies as hedgers sell into strength — and with the gamma estimate positive, that dampening is the expected behaviour rather than the exception. Getting through $515.72 (the swing-resistance estimate) and then $520 would leave the $525 wall as the last dense obstacle before genuinely thin positioning above.
If MSFT drifts between the walls: this is the base case, and it has a twist. Max pain sits at $480 — the very bottom of the corridor, not the middle. Expirations sometimes gravitate toward max pain, and here that pull points down, not sideways. Meanwhile the $500 strike carries the heaviest total gamma in the whole chain, which tends to act as a round-number anchor. A quiet week likely means chop between roughly $485 and $505 with expiring open interest arguing for the lower half of it.
If MSFT breaks below the put wall ($480): that would put the stock outside the options-implied range and through both the heaviest put strike and max pain in one move. The 12,462 put contracts open there stop being a cushion and start being a source of hedging supply. The good news is that the gamma flip estimate — below which one rough estimate suggests market-maker hedging amplifies selling rather than cushioning it — sits far down near $350, so a break of $480 would be a positioning event, not a structural one. The next price-structure supports are estimated at $477.15 and $466.32.
5 · Three defined-risk structures
Prices are end-of-day midpoints as of September 11, 2026. All structures are hypothetical. Verify live prices before trading — these will be stale by the open.
If you expect the range to hold: September 18 iron condor
- Trade: Sell the $480 put / buy the $475 put, and sell the $510 call / buy the $515 call, all expiring September 18.
- Credit: ~$1.27 ($127 per condor) · Max profit: $127 · Max loss: $373 · Break-evens: $478.73 and $511.27
- Why it fits: a credit spread means you collect premium up front and keep it if the stock stays where you need it to. Here the break-evens land within a dollar of the options-implied rails ($479.92 and $511.34) — you're being paid to bet the market's own expected move is not exceeded. The short put sits exactly at the put wall and max pain; the short call sits at a 16,508-contract call shelf, well under the $525 wall. With a mildly rich premium (about 1.9 vol points over delivered movement, 61st percentile for this name) and split short-dated sentiment, this is the structure the data actually supports.
- Makes sense only if: you accept that a 3.2% move in either direction costs you roughly three times what you collected. This is a high-probability, low-payout trade.
- Invalidated if: MSFT closes below $480 or above $510 — through either short strike.
- Managing it: close at ~50% of max credit; check it at Wednesday's halfway mark and take the profit early if it's there, since a short-term downturn fighting an intact longer-term uptrend is exactly the setup that reverses on you. If MSFT closes through a short strike, close the position rather than hope.
- Liquidity note: the $510 calls quote $1.52/$1.72 (20¢ wide) on 16,508 open contracts and the $515 calls only 7¢ wide — both easy. The put wings are looser: the $480 puts quote $1.35/$1.59 (24¢ wide on a $1.47 mid) and the $475 puts 17¢. That's above the comfortable band, so submit the four legs as one package with a limit near the mid; a market order here gives up a meaningful slice of a $127 credit.
- Analyze this position →
If you lean bullish: September 18 $485/$480 put credit spread
- Trade: Sell the September 18 $485 put, buy the September 18 $480 put.
- Credit: ~$0.90 ($90) · Max profit: $90 · Max loss: $410 · Break-even: $484.10
- Why it fits: you collect premium and keep all of it as long as MSFT holds above $485 — a level with 2,722 put contracts open beneath it, with the $480 put wall and max pain sitting directly under your long strike as a second cushion. Both chart models target higher ($499.00 and $500.75) and both put their own invalidation near $489–$493, so this structure only loses money in a scenario both technical reads explicitly call a failure.
- Makes sense only if: you think the $480 zone holds. Note the pull of max pain at $480 runs mildly against you here — that's the honest cost of leaning bullish this week.
- Invalidated if: MSFT closes below $480.
- Managing it: close at ~50% of max credit; exit by Wednesday, September 16 if MSFT is trading below $490 rather than carrying assignment risk into Friday's gamma. Given the short-term trend runs against the longer-term one, take profits earlier than you'd like rather than later.
- Liquidity note: the $485 puts quote $2.20/$2.54 — 34¢ wide on 1,044 contracts traded — and the $480 puts 24¢ wide on 2,292 traded. Workable, but use a limit; paying the spread on both legs eats a third of the credit.
- Analyze this position →
If you lean bearish: September 18 $505/$515 call credit spread
- Trade: Sell the September 18 $505 call, buy the September 18 $515 call.
- Credit: ~$1.76 ($176) · Max profit: $176 · Max loss: $824 · Break-even: $506.76
- Why it fits: you keep the credit as long as MSFT stays below $505. That short strike sits just under the September 1 gap origin at $507.29, which the stock has failed to reclaim for two weeks, and under the $510 call shelf where hedging supply thickens. Skew is telling you the same thing from the other side: puts are running richer than their own norm, meaning calls are the relatively cheaper side to be short.
- Makes sense only if: you're willing to fight two bullish chart reads. Both models target the $499–$501 area, which is comfortably below your short strike — but the 5-day model's upside scenario points at $506–$509, right through it.
- Invalidated if: MSFT closes above $507.29 — the September 1 gap origin.
- Managing it: close at ~50% of max credit; exit regardless by Wednesday's checkpoint if MSFT has printed a close above $505, and don't carry a tested short call through Friday's expiry.
- Liquidity note: the $505 calls quote $2.55/$2.84 (29¢ wide) on 2,325 contracts traded and about $627,000 of premium; the $515 calls are 7¢ wide on 2,273 traded. This is the tightest of the three structures.
- Analyze this position →
If none of these: no trade
There's a real case for standing aside. IV rank of 18 means you are selling some of the cheapest premium MSFT has offered in a year, and the 61st-percentile richness over delivered movement is a thin edge to build a week around — the condor pays $127 to risk $373, and a single 3% session erases it. If you would not be comfortable holding that risk through a surprise gap, the honest answer is that neither the direction nor the premium is compelling enough to force a position. Waiting for either IV rank to lift or the stock to actually resolve the $480/$511 corridor costs nothing but patience.
6 · Quick FAQ
What is MSFT's expected move this week? About ±$15.71, or ±3.17%, into the September 18 expiration — a $479.92 to $511.34 range around the $495.63 close, per the options market's straddle pricing as of September 11.
Is MSFT expected to go up or down over the next five days? Options positioning as of September 11 reads genuinely neutral — the short-dated sentiment leans bullish while longer-dated leans mildly bearish, and the two roughly cancel — but that's a read of what traders have done, not a forecast. The actionable map is the $479.92–$511.34 range and the $480 support / $525 resistance levels.
Are MSFT options expensive right now? Two lenses, two answers. IV rank of 18/100 says option prices are lower than about 82% of the past year's readings — cheap in absolute terms. On top of that, they're running roughly 1.9 vol points above the movement MSFT has actually delivered, which is richer than about 61% of this stock's own recent readings. Net: slightly rich relative to reality, cheap relative to history — which favours defined-risk premium collection over outright long or short volatility bets.
Where is MSFT's biggest options support and resistance? For the September 18 expiration, the put wall is $480 (12,462 contracts open) and the call wall is $525 (28,772 contracts). Note that the whole chain's heaviest call strike is $550, but that open interest is October-dated and isn't this week's ceiling.
What invalidates this week's read? A close below $480. That level is simultaneously the put wall, max pain, and the bottom of the implied range — losing it means the anchor holding the whole picture together is gone.
Methodology & disclosures. Data: end-of-day options-chain snapshot for MSFT, 2026-09-11, generated 2026-09-13T20:11:29Z. Prices shown are midpoints and will differ from live markets. Momentum/positioning scores and volatility-premium comparisons are descriptive measurements of past option flow and past price movement — not investment advice, signals, forecasts, or guarantees. All trade structures are hypothetical. Every structure shown has a defined maximum loss; you can lose the entire max-loss amount. Options involve substantial risk and are not suitable for all investors.