MSFT Options Are Pricing a $39 Swing in Five Days — The Chart Model Sees $6
Microsoft's front-week implied volatility quadrupled in a single session, leaving options priced roughly 27 vol points above what the stock has actually delivered. Here's the level map into the September 25 expiration and three defined-risk ways to trade the richest premium of the year.
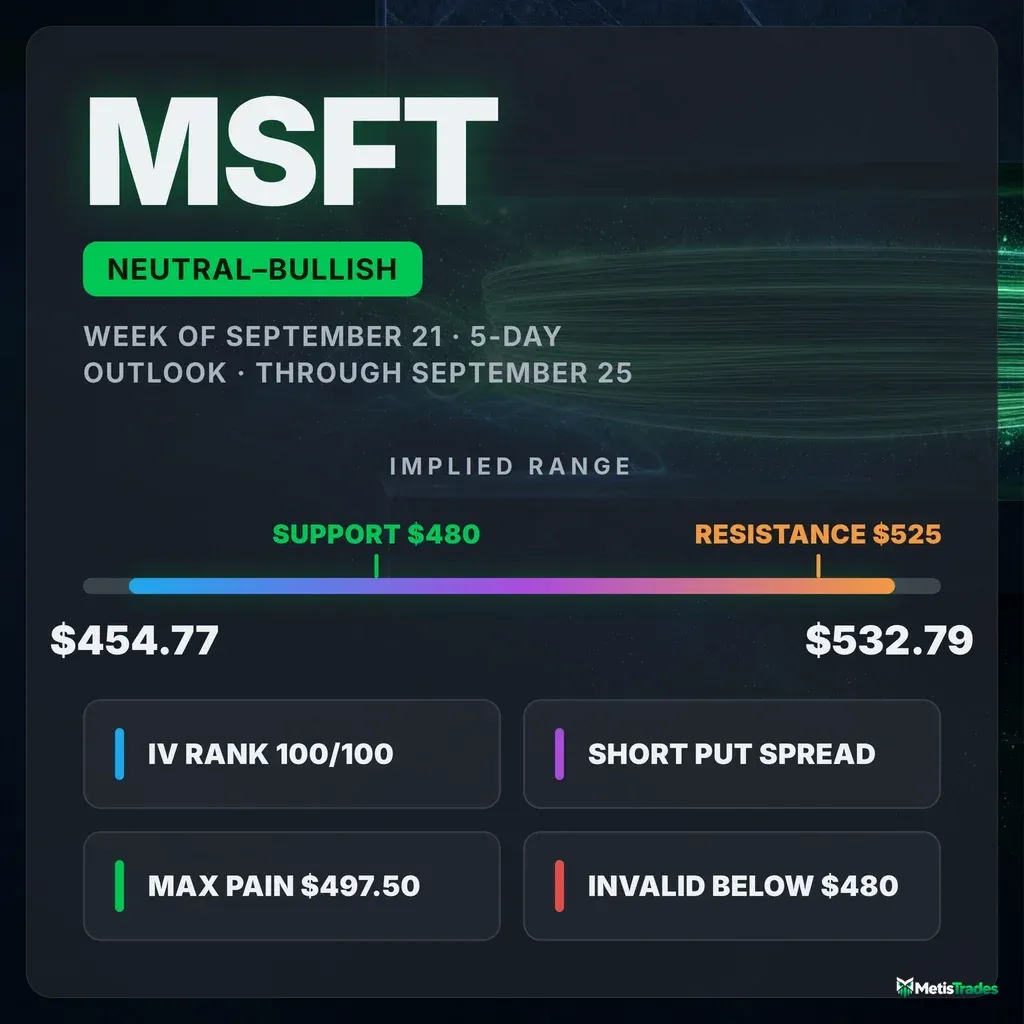
The options market implies a $454.77–$532.79 range into the September 23 expiration — an extraordinary width built on a one-day volatility spike. Here's what's driving it and three defined-risk ways to trade it.
Published Sunday, September 20, 2026 · Data as of Friday, September 18 close
Explore the live MSFT options data in the Detailed Options Analyzer →
Quick answer
| Item | Answer |
|---|---|
| Market bias | Neutral with a bullish tilt |
| Options-implied range (into the Sep 23 expiration) | $454.77 – $532.79 (±7.90%) |
| Major support | $480.00 (Sep 25 put wall) |
| Major resistance | $525.00 (Sep 25 call wall) |
| Max pain (Sep 25) | $497.50 |
| Dealer gamma regime (estimate) | Positive — hedging tends to dampen moves; flip level ≈ $350 |
| Volatility condition | Rising sharply — IV rank 100/100 · premium rich: options priced ~27 vol points above delivered movement |
| Technical check | Mixed (bearish on the 4-day read, neutral on the 6-day read) |
| Best-fitting strategy | Short put spread (defined risk, sells the richest premium of the year) |
| Analysis invalidated if | MSFT closes below $480 |
1 · What matters today
Microsoft closed Friday, September 18 at $493.78, essentially flat over five sessions. What changed was the price of insurance, not the price of the stock: at-the-money implied volatility — the market's estimate of how much MSFT will move, baked into option prices — jumped from roughly 24% to 48.8% in one session, the highest reading of the past year. That is why the options market is pricing a ±$39.01 move (±7.90%) into the September 23 expiration, a range of $454.77 to $532.79 that looks nothing like the stock's recent behavior.
Our read of positioning is neutral with a slight upward tilt: flow in short-dated options leans call-side, the corridor between walls leaves more room up than down, and momentum is mildly negative. The single level that changes the picture is $480 — the heaviest put open interest for the September 25 expiration. The chart models, for their part, are more cautious than the options market is wide.
2 · What the options market is pricing
What changed this week
The volatility repricing is the story. ATM implied volatility finished at 48.8%, up 101% in a single day and up 106% over five sessions, against a 30-day average of 26.1% and a 90-day average of 32.4%. IV rank — where today's IV sits versus the past year — printed 100 out of 100, meaning option prices are higher than every other reading in the trailing twelve months. For context, that metric averaged 28.3 over the trailing 14 sessions and 34.1 over the trailing 7, so Friday's print is a step change, not a drift.
The underlying itself barely moved: down 0.37% over five trading days, up 2.62% over twenty. Share volume was heavy at 39.5 million, 1.88 times its 20-day average — a September expiration Friday — while total options volume ran at 0.95 times its own 20-day average. So this was a repricing of risk on ordinary options turnover, not a flood of new contracts.
Positioning moved modestly toward protection. Put open interest relative to call open interest sits at 0.40, up from a 14-day average of 0.36 — for every call contract held open there are now four puts for every ten, slightly more hedging than this name usually carries. The largest single open-interest build in a live contract was 3,264 new October 16 $350 puts, a far-out-of-the-money hedge rather than a directional bet; closer to home, the September 25 $480 puts added 776 contracts on 1,374 traded, thickening the very level this article calls support. Into Friday's settled expiration, the $525 calls shed 1,989 contracts of open interest as they expired worthless — history now, not a live magnet.
The short- and long-term trend reads agree rather than fight: price is up 28.5% over roughly the last fifty sessions while the past week and month are flat, and the flow-based momentum read flipped from bearish to bullish on September 17. That is a bullish longer arc with a becalmed foreground — which is exactly the setup a tilted-but-neutral label describes.
Expected move
The expected move is the move the options market is pricing in, derived from what straddles cost. Into the September 23 expiration, that's ±$39.01, or ±7.90% of the $493.78 spot — a $454.77 to $532.79 range. The September 25 expiration that anchors this article's trade structures could not be priced: the call-side and put-side at-the-money volatilities disagreed too much for a reliable blend, so that rung is blank rather than zero. The same quote-quality break affects every expiration from October 2 onward, which is why the ladder below stops at September 30.
| Expiration | Implied move | Range around $493.78 |
|---|---|---|
| Sep 21 | ±6.30% | $462.67 – $524.89 |
| Sep 23 | ±7.90% | $454.77 – $532.79 |
| Sep 28 | ±9.44% | $447.17 – $540.39 |
| Sep 30 | ±10.12% | $443.81 – $543.75 |
Each rung widens with time, as it should — but every rung is wide in absolute terms because the front-week volatility inputs (69.5% for September 21, 67.5% for September 23) are running at roughly three times the stock's delivered movement. Treat the precise width with some skepticism; treat the direction of the signal — premium is extremely rich — as unambiguous.
Volatility
ATM IV at 48.8% with an IV rank of 100 means option prices are richer than 100% of the past year's readings. The one-day change of +101% and the five-day change of +106% both point the same way, and current IV sits 87% above its own 30-day average. Front-month term structure — comparing option prices across different expiration dates — is unavailable today, a normal artifact of a September expiration Friday, so there is no clean read on whether the front or the back of the curve is doing the work.
Underneath the implied numbers, the stock has been quiet. Twenty-day realized volatility is 21.97%, an unusually depressed reading compared against Microsoft's own recent history, though the five-day-versus-twenty-day ratio at 1.22 says movement has been picking up modestly in the last week.
Premium rich or cheap. The volatility risk premium — the gap between how much movement options are priced for and how much MSFT has actually delivered — stands at roughly 27 vol points (48.8% implied against 22.0% realized). When that gap is positive, option sellers have been collecting more than realized movement cost them, and this reading sits at the 100th percentile of the stock's own recent history: richer than every comparable day in the trailing window. A week ago the same gap was about 2 vol points; it was still only 2.4 points on September 17 before Friday's jump, so this is a one-session repricing, not a slow build. The snapshot's own implied-versus-realized gauge is likewise stretched well above its norm. That combination — IV rank 100 and a 100th-percentile premium over delivered movement — favors collecting premium over owning it this week, with the honest caveat that a gap this extreme can close as violently as it opened.
Skew and sentiment
Today's 25-delta skew read — how much more expensive puts are than equidistant calls — could not be computed from Friday's chain, so there is no fresh crash-protection premium to quote. Over the trailing seven sessions it averaged about 1.2 vol points of put richness against a 60-day median of 0.2, meaning traders have been paying a modest but above-normal premium for downside protection through the month.
Flow tells a friendlier story. Put volume ran at 0.52 times call volume, right on its 7-day average of 0.51 and below its 14-day average of 0.56 — calls dominated the tape roughly two to one. Seventeen call contracts cleared the peer-relative unusual-volume bar versus eight puts, an unusually heavy call-side sweep count for this name compared against its own recent history. Sentiment in short-dated options is positive across the curve: +25 in the 0–7 day slice, +24 in the 7–30 day slice, and a standout +63 in the 30–60 day slice, 38 points above its nearest neighbor — localized positioning building further out rather than a broad directional surge.
The key levels map
| Level | Price | Why it matters |
|---|---|---|
| 52-week high | $553.72 | 10.8% above Friday's close |
| Whole-chain heaviest call strike | $550.00 | 85,482 contracts aggregated across all expirations — not this week's cap |
| Top of 5-day implied range | $532.79 | One standard deviation up, per Sep 23 pricing |
| Call wall (Sep 25) | $525.00 | 2,943 contracts — the heaviest call open interest for this window; rallies tend to slow into it |
| Swing resistance | $513.11 / $517.78 | Price-structure pivots from recent swings |
| Largest gamma strike (chain-wide) | $510.00 | Biggest concentration of gamma across all expirations |
| 20-day moving average | $497.51 | Price closed 0.75% beneath it |
| Max pain (Sep 25) | $497.50 | Where the most option value would expire worthless — expirations sometimes gravitate here |
| Spot | $493.78 | Friday's close |
| Swing support | $486.00 | Nearest heuristic support cluster (an estimate, not a guaranteed reaction zone) |
| Put wall (Sep 25) | $480.00 | 1,979 contracts here, and also the heaviest put strike chain-wide at 23,774 — the floor this article is built on |
| Next swing support | $477.15 | Second structural shelf |
| 50-day moving average | $464.68 | 6.26% below price — the longer trend's anchor |
| Bottom of 5-day implied range | $454.77 | One standard deviation down, per Sep 23 pricing |
| Gamma flip estimate | ≈ $350.00 | A rough estimate of where market-maker hedging would flip from dampening to amplifying — very far below spot |
Note the disagreement worth naming: the September 25 expiration's own call wall is $525, while the whole chain aggregated across twelve expirations puts its heaviest call strike at $550. For a five-day view, $525 is the level that matters; $550 is an October-and-beyond artifact.
Positioning and unusual flow
One rough estimate of dealer positioning has market makers net long gamma for the September 25 expiration, a regime in which their hedging tends to dampen moves rather than amplify them, and the estimated flip level sits near $350 — far below spot. The snapshot puts today's distance from that flip estimate unusually high versus this stock's own norm, i.e. firmly on the supportive side of the ledger. Read it as an estimate built on an assumed convention, not as observed dealer inventory.
Three live flow items stood out. The September 25 $502.50 calls traded 5,734 contracts against just 317 held open — roughly eighteen times turnover, and the top of their peer group — about $1.55 million of premium chasing a strike $9 above spot. The September 25 $500 calls added 222 contracts of open interest on 4,671 traded, about $1.75 million of premium. Against that, the September 25 $480 puts added 776 contracts of open interest, which is what thickened the put wall. Call-side dollars dominated, but the hedges being added were placed precisely at the level that defines this week's floor.
3 · Technical check
The near-term chart model is bearish. Over a 4-day horizon into September 23 it targets $489.50 within a projected $483.50–$503.00 band, citing price trading below both its short-term exponential averages and a Chaikin Money Flow reading of −0.105 that signals sustained distribution. Crucially, though, it also flags ADX at 13.2 — well under 20 — meaning the trend it is leaning on has very little conviction behind it. That read diverges from our neutral-with-a-bullish-tilt positioning call, even though its target sits comfortably inside the options-implied range.
The 6-day model, running to the September 25 expiration this article is anchored to, is explicitly neutral: target $494.00 within $482.50–$505.50, with support marked at $488.50 and resistance at $499.00. It reads the tape as genuine range consolidation — a nascent bullish momentum crossover offsetting the ongoing distribution signal. That one confirms the options read's directionless core. Both reports were generated Sunday against a $493.46 reference, within a rounding error of the options snapshot's $493.78 close, so neither is stale.
Model vs. Market: The options market implies $454.77–$532.79 into September 23; the 4-day technical model targets $489.50 inside a $483.50–$503.00 band. The chart tool is projecting a range roughly a quarter as wide as the one options are charging for — which is precisely the argument for selling defined-risk premium rather than buying it.
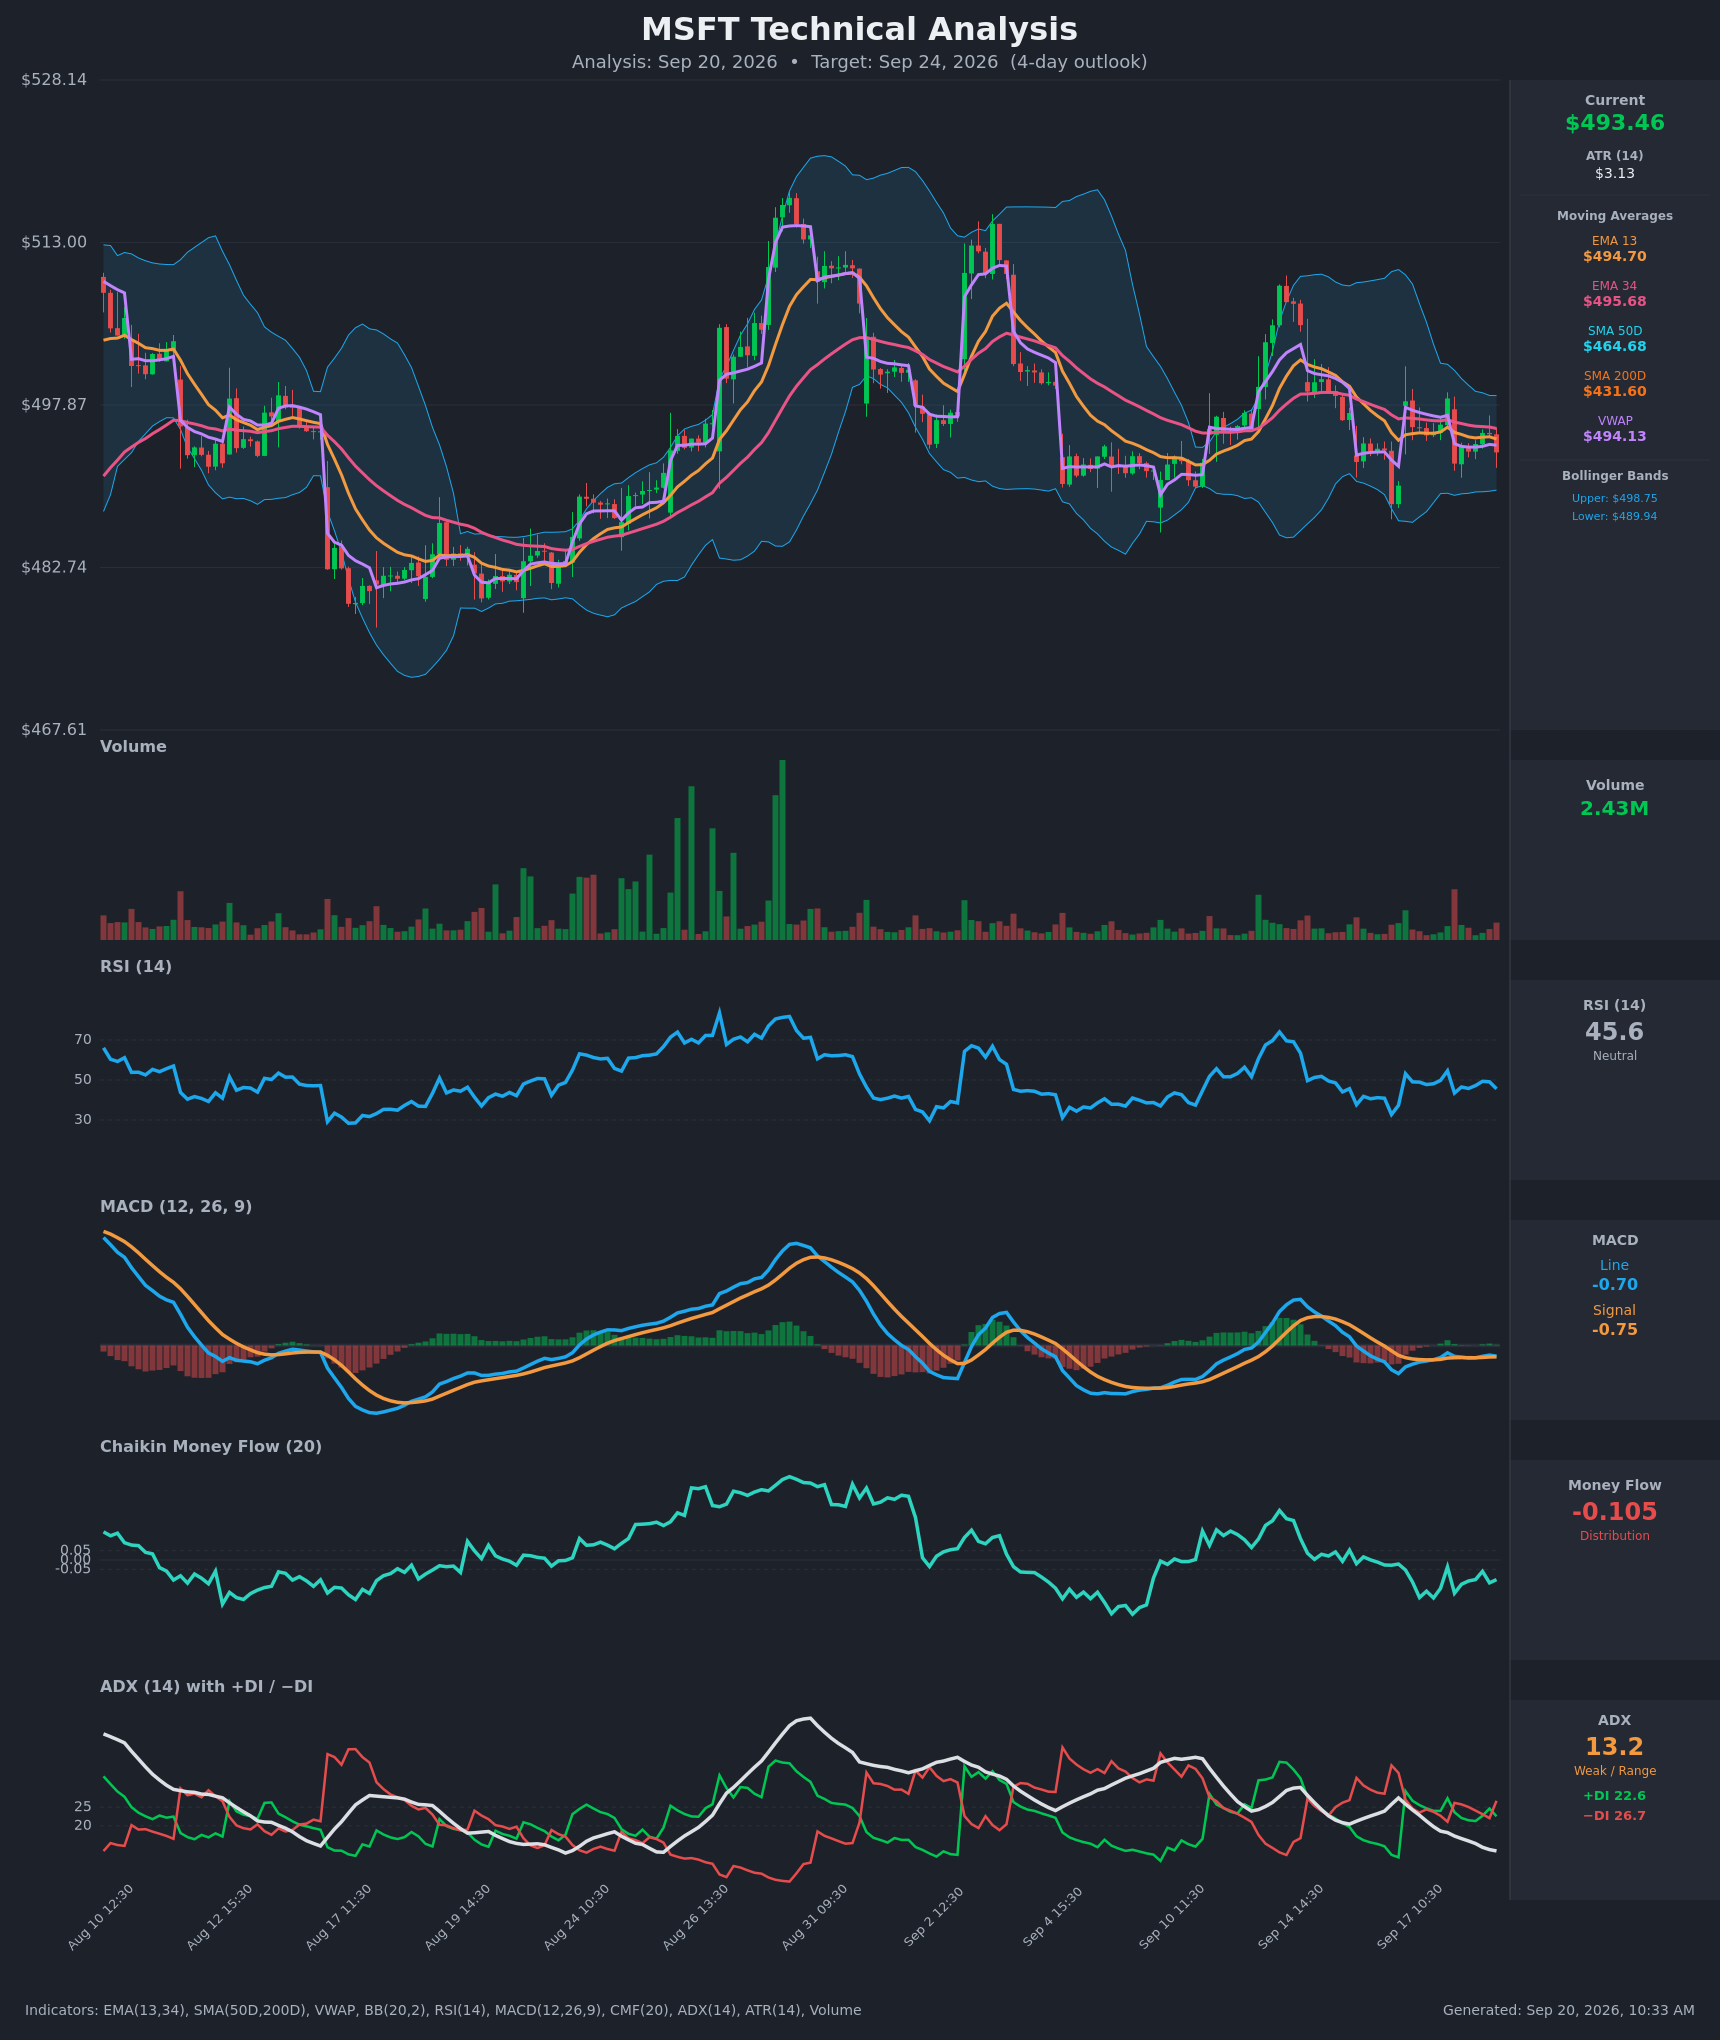
The technicals did shade strike selection: the 6-day model's $499 resistance and $488.50 support pushed the range-bound structure's short strikes to $515 and $485, comfortably outside both chart-model boundaries rather than hugging them.
Full technical write-ups: 4-day report → · 6-day report →
4 · Three ways the next five days can go
If MSFT pushes above the call wall ($525): that strike carries the heaviest call open interest for the September 25 expiration, and positioning like that tends to slow advances as hedging flows lean against the move. A clean break through would leave notably thinner expiration-specific positioning above until the $532.79 upper implied rail and then the swing-resistance shelf at $553.72. Getting there requires a 6.3% move in five sessions — inside what options are pricing, but far outside anything either chart model projects.
If MSFT drifts between the walls: this is the base case the positioning describes. Max pain for September 25 sits at $497.50, $3.72 above Friday's close, and the estimated dealer-gamma regime is the dampening kind, which tends to compress rather than extend intraday swings. A drift into the $493–$500 zone with expiring open interest doing the pulling is the outcome most consistent with a 100th-percentile volatility premium that has no realized movement behind it.
If MSFT breaks below the put wall ($480): that level holds both this expiration's heaviest put strike and the chain's heaviest put strike overall, so a close beneath it would mean the layer traders built protection against has been breached — the signal that kills this article's read. Below it, the next structural shelf is $477.15 and then the 50-day moving average at $464.68. Note the acceleration mechanism is not obviously in play here: one rough estimate puts the gamma flip near $350, and spot sits unusually far above it for this name, so hedging flows would still be expected to cushion rather than amplify a decline in that zone.
5 · Three defined-risk structures
Prices are end-of-day midpoints as of September 18, 2026. All structures are hypothetical. Verify live prices before trading — these will be stale by the open.
If you lean bullish: short put spread (Sep 25 $485/$475)
- Trade: Sell the September 25 $485 put, buy the September 25 $475 put
- Credit: $1.73 · Max profit: $173 · Max loss: $827 · Break-even: $483.27
- Why it fits: You collect a credit for the stock staying above $485 and lose only if it falls through. The $480 put wall sits $5 below the short strike and the $486 swing shelf sits right at it, so the structure is selling premium into the level where hedging demand is densest — at a moment when that premium is richer than every other reading of the past year.
- Makes sense only if: you accept that the implied range is far wider than anything the chart models project, and you are being paid for that gap rather than betting against it.
- Invalidated if: MSFT closes below $480.
- Managing it: close at roughly 50% of max credit; exit on the morning of September 25 regardless; if MSFT closes through $485, close rather than hope — five-day spreads give you no time to be rescued.
- Liquidity note: the $485 puts quoted 49¢ wide against a $2.81 mid on 2,309 contracts traded; the $475 puts are 37¢ wide on a thinner $1.08 mid. Both are wider than ideal — work the order with a limit near the midpoint and expect to give up a few cents.
- Analyze this position →
If you expect the range to hold: iron condor (Sep 25 $480/$485/$515/$520)
- Trade: Sell the September 25 $485 put and $515 call, buy the September 25 $480 put and $520 call
- Credit: $1.43 · Max profit: $143 · Max loss: $357 · Break-evens: $483.57 and $516.43
- Why it fits: This is the purest expression of the volatility-premium gap. Both short strikes sit outside the 6-day chart model's entire projected $482.50–$505.50 band and well inside this expiration's $480/$525 wall corridor, and the estimated dealer-gamma regime is the kind that dampens moves. You are paid if MSFT does what it has actually been doing — very little.
- Makes sense only if: you want two-sided exposure and are comfortable being short a 100th-percentile premium that could compress or expand hard.
- Invalidated if: MSFT closes below $480 or above $525 — either wall giving way means the corridor thesis is broken.
- Managing it: take profit at about 50% of max credit, which on a five-day condor often arrives within two sessions of decay; close the threatened side if either short strike is breached rather than waiting for the other side to save you. With the short-term trend flat against a strongly bullish fifty-day arc, take profits earlier rather than later.
- Liquidity note: the $520 calls are the cleanest leg at 5¢ wide on a 38¢ mid with 2,253 contracts traded; the $515 calls are the worst at 43¢ wide on a 71¢ mid. Enter as a single four-leg order with a limit, never leg by leg.
- Analyze this position →
If you lean bearish: short call spread (Sep 25 $505/$515)
- Trade: Sell the September 25 $505 call, buy the September 25 $515 call
- Credit: $1.37 · Max profit: $137 · Max loss: $863 · Break-even: $506.37
- Why it fits: This is the structure for readers who side with the 4-day chart model's bearish read and its distribution signal. The $505 short strike sits above max pain at $497.50, above the 20-day moving average at $497.51, and above the 6-day model's $499 resistance — but below the $525 call wall, so you are not fighting the level where positioning is heaviest.
- Makes sense only if: you believe the 20-day average keeps acting as a ceiling. The risk/reward is poor by design: you risk $863 to make $137.
- Invalidated if: MSFT closes above $510.
- Managing it: close at 50% of max credit; exit if MSFT closes above the 20-day average at $497.51 two sessions running, well before the short strike is threatened. A bearish tactical bet inside an intact fifty-day uptrend deserves a short leash.
- Liquidity note: the $505 calls quoted 26¢ wide on a $2.07 mid with 1,469 contracts traded — acceptable; the $515 long leg at 43¢ wide on a 71¢ mid is the slippage risk.
- Analyze this position →
If none of these: no trade
Premium this rich usually argues loudly for selling it, so standing aside needs a real justification — and there is one. The 27-point gap between implied and realized volatility opened entirely in a single session, and every quoted spread in this chain is wide: the tightest structure leg above is 5¢ on a 38¢ mid, the worst is 43¢ on a 71¢ mid. A premium edge that large can be handed straight back at the fill, and a volatility print that quadruples overnight is as likely to be repriced down as to be paid out slowly. If you cannot get filled near the midpoint on a four-leg order, or if you would be forced to size up to make the credits meaningful, waiting for spreads to normalize is the better trade. Standing aside is a position too.
6 · Quick FAQ
What is MSFT's expected move this week? ±$39.01, or ±7.90%, into the September 23 expiration — a $454.77 to $532.79 range around the $493.78 close, per the options market's straddle pricing as of September 18. The September 25 expiration could not be priced reliably because its call and put volatilities disagreed too much to blend.
Is MSFT expected to go up or down over the next five days? Options positioning as of September 18 leans neutral with a slight upward tilt — short-dated flow is call-heavy and spot sits closer to the put wall than the call wall inside this expiration's corridor — but that is a read of what traders have done, not a forecast. The actionable map is the $454.77–$532.79 implied range and the $480 / $525 levels.
Are MSFT options expensive right now? Extremely. IV rank of 100/100 says option prices are higher than every reading of the past year, and on top of that they are running about 27 vol points above the movement MSFT has actually delivered — richer than 100% of this stock's own recent readings. That favors collecting premium rather than owning it, provided you can get filled near the midpoint.
Where is MSFT's biggest options support and resistance? Put wall $480.00 and call wall $525.00 for the September 25 expiration. Note the whole chain's heaviest call strike is $550, but that reflects October and November positioning, not this week's.
What invalidates this read? A close below $480.
Methodology & disclosures. Data: end-of-day options-chain snapshot for MSFT, 2026-09-18, generated 2026-09-20T10:33:11.243Z. Prices shown are midpoints and will differ from live markets. Momentum/positioning scores and volatility-premium comparisons are descriptive measurements of past option flow and past price movement — not investment advice, signals, forecasts, or guarantees. All trade structures are hypothetical. Every structure shown has a defined maximum loss; you can lose the entire max-loss amount. Options involve substantial risk and are not suitable for all investors.