MSTR Options Are Pricing a $14.18 Move — The Chart Model Sees $154.80
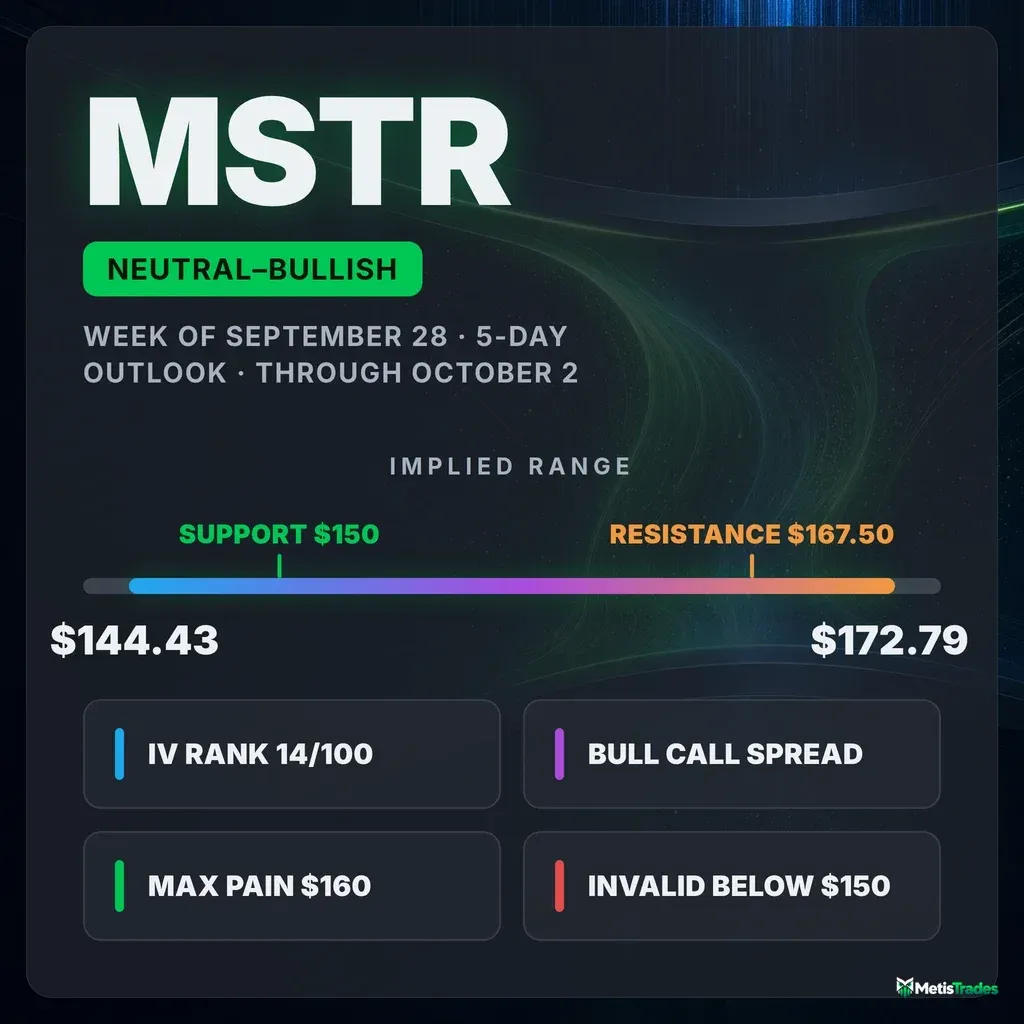
The options market implies a $144.43–$172.79 range for MSTR into the October 2 expiration, and call-heavy flow keeps positioning slightly bullish while both chart models lean bearish. Here's the level map and three defined-risk ways to trade the next five days.
Listen to this analysis — prefer audio? This MSTR outlook is also available as a podcast episode:
The options market implies a $144.43–$172.79 range into the October 2 expiration. Here's what's driving it, where the key strikes sit, and three defined-risk ways to trade it.
Published Sunday, September 27, 2026 · Data as of Friday, September 25, 2026 close
Explore the live MSTR options data in the Detailed Options Analyzer →
Quick answer
| Item | Answer |
|---|---|
| Market bias | Slightly bullish |
| Options-implied range (into October 2) | $144.43 – $172.79 (±8.94%, or ±$14.18) |
| Major support | $150.00 (October 2 put wall) |
| Major resistance | $167.50 (October 2 call wall) |
| Max pain (October 2) | $160.00 |
| Dealer gamma regime (estimate) | Positive — hedging tends to dampen moves; flip level ≈ $135 |
| Volatility condition | Falling — IV rank 13.67/100 · premium thin: options priced ~39 vol pts below delivered movement |
| Technical check | Diverges (bearish, 3-day and 5-day models) |
| Best-fitting strategy | Bull call spread (October 2 $157.50/$167.50), sized small |
| Analysis invalidated if | MSTR closes below $150.00 |
1 · What matters today
MSTR closed Friday, September 25 at $158.61 after giving back part of a big mid-September rally, and options positioning still leans slightly bullish. The main reason: traders bought calls hard into the dip. Put volume ran at barely a quarter of call volume, and short-dated calls are still priced richer than puts. The options market is pricing a move of about $14.18 either way by the October 2 expiration, which puts the working range at $144.43 to $172.79. The biggest piles of open contracts sit at $150 below and $167.50 above. The single level that changes the picture is $150. A close below it breaks the heaviest put support and ends the bullish lean. Both chart-based technical models disagree and point lower, so treat this as a lean worth expressing with small, defined-risk positions, not a high-conviction call.
2 · What the options market is pricing
What changed this week
MSTR ended the five sessions up 3.05%, but the path matters more than the total. The stock gapped up to $168.50 on September 21, then slid four straight sessions to $158.61. Over the same stretch, at-the-money implied volatility fell 7.1%, and IV rank dropped to 13.67 from a 7-day average near 23.9. Options got cheaper even as the stock swung.
The flow split in two directions:
- Volume was call-heavy. The put/call volume ratio (how much put activity there is relative to calls; above 1 means puts dominate) printed 0.27 on Friday, against a 7-day average of 0.57.
- Open interest leaned the other way. Open interest means contracts currently held open. The put/call open-interest ratio climbed from 0.48 to 0.66 over five days, against a 7-day average of 0.61. Traders chased calls intraday while quietly adding put protection that stayed on the books.
The biggest single change was a build in the October 2 $167.50 calls. Open interest there jumped from 755 to 14,996 contracts, a gain of 14,241, which turned that strike into the week's call wall. The October 2 $175 calls also added 9,263 contracts.
For settled history: into Friday's September 25 expiration, the $180 calls shed 4,058 contracts of open interest as that upside bet expired far out of the money.
The short- and long-term trend reads all agree on direction. Price is up over the past week, up 15.4% over the past month, and up 68.7% over the past two-plus months. The four-day pullback is a dent inside an intact uptrend, not a break of it.
Expected move
The expected move is the move the options market is pricing in, derived from what straddles cost. Into October 2, it comes to ±8.94%, or about $14.18 either way from $158.61. Here is how it widens further out:
| Expiration | Implied move | Range around $158.61 |
|---|---|---|
| October 2 | ±8.94% (±$14.18) | $144.43 – $172.79 |
| October 9 | ±12.48% (±$19.79) | $138.82 – $178.40 |
| October 16 | ±15.48% (±$24.55) | $134.06 – $183.16 |
| October 23 | ±17.85% (±$28.31) | $130.30 – $186.92 |
The rungs scale smoothly with time, with no sudden jump between expirations. That means no single scheduled event is being priced into any one of these dates.
Volatility
Implied volatility (IV) is the market's estimate of how much MSTR will move, baked into option prices. At-the-money IV sits at 65.05%. That sounds high in absolute terms, but for MSTR it is cheap.
- IV rank is 13.67/100. IV rank shows where today's IV sits versus the past year, so 13.67 means cheaper than roughly 86% of the past year's readings.
- IV percentile is 11.1. Only about 11% of the past year's sessions had lower IV than today.
- The direction is down. IV fell 3.2% on Friday, 7.1% over five sessions, and 2.2% over 30 sessions. It now sits below both its 30-day average (70.98%) and its 90-day average (76.98%).
Term structure (comparing option prices across different expiration dates) is only partly readable today. The front-month read is unavailable because Friday was an expiry day. The per-expiration table still shows a gentle upward slope, from about 64.5% at October 2 to roughly 69–70% for November through January. That is a calm shape, with no sign of near-term stress premium.
Premium rich or cheap? The volatility risk premium is the gap between how much movement options are priced for and how much MSTR has actually delivered. When it is positive, option sellers have been collecting more than realized movement cost them. Right now it is deeply negative:
- Options are priced about 39 vol points below the stock's 20-day realized volatility of roughly 104%. Realized movement is running well above this stock's own recent norm.
- The gap sits at the 3rd percentile of this stock's own recent readings. It is richer than only 3% of them, which is unusually depressed even for MSTR.
- The gap widened from about −29 points on September 8 to about −43 on September 24, then eased slightly on Friday.
Much of that is mechanical. The violent mid-September gap-and-run sits inside the 20-day realized window. As those sessions roll off, delivered volatility will fall on its own. The past week's movement is already slower than the month's.
Still, the combination of IV rank near 14 and a 3rd-percentile premium over delivered movement favors owning premium rather than selling it over the next five days.
Skew and sentiment
Skew means puts and calls the same distance from the stock price don't cost the same. When puts are pricier, traders are paying up for crash protection. MSTR has the opposite setup:
- Upside calls are priced at 71.1% IV versus 63.9% for downside puts. Puts are running about 7.3 vol points cheaper than calls, against a 60-day norm of about 3.1 points cheaper. Traders are paying extra for upside exposure.
- That call premium has faded a little. Skew steepened by about 1.3 points over five sessions, a hint that put demand is creeping back.
Three readings stand out against this stock's own recent history (unusual here means unusual for MSTR, not versus the broader market):
- Friday's call-dominated volume was unusually heavy.
- Put open interest has been building faster than normal.
- The largest outsized trades tilted to puts, 10 put contracts versus 7 calls. That is well beyond this name's typical balance.
Sentiment in short-dated options is split. The 0–7 day window reads slightly negative at −6, but only one thin input was available on an expiry day. The 7–30 day window reads strongly bullish at +58, driven by call buying and call open-interest growth. The overall read across expirations is "Mixed," versus a "Bullish Recovery" profile on the 7-day average.
Our read of options flow overall sits at +28, in line with its 7-day average of +29 and well above the 14-day average of +8. Flow has turned decisively more constructive since the mid-September low.
The key levels map
A call wall or put wall is the strike with the biggest pile of open call or put contracts; these often act like magnets or barriers. Max pain is the price where the most option value would expire worthless, and expirations sometimes gravitate toward it.
The October 2 expiration's own walls ($150 put, $167.50 call) differ sharply from the whole chain's heaviest strikes, which are inverted: calls at $150 and puts at $160. For the next five days, the October 2 levels are the ones that matter.
| Level | Price | Why it matters |
|---|---|---|
| Upper implied rail (October 2) | $172.79 | Top of the ±$14.18 expected move |
| Swing resistance | $171.19 | Only overhead price-structure resistance from recent pivots |
| Call wall (October 2) | $167.50 | 14,996 contracts, most of them added Friday; heaviest overhead barrier this week |
| September 21 gap open | $164.58 | Top of Monday's gap; the stock has slid back through it |
| Max pain (October 2) / largest-gamma strike | $160.00 | Pin candidate; also the whole chain's heaviest put strike |
| Spot (Friday close) | $158.61 | Reference price |
| Largest-gamma strike | $155.00 | Third-heaviest gamma concentration; tends to slow moves through it |
| September 18 close (gap base) | $153.92 | Where the September 21 gap would be fully filled |
| Put wall (October 2) | $150.00 | 11,164 contracts; key support and the thesis kill switch |
| Swing support | $144.92 | Nearest price-structure support below the wall |
| Lower implied rail (October 2) | $144.43 | Bottom of the expected move |
| 20-day moving average | $141.09 | Short-term trend line; price sits 12.4% above it |
| 200-day moving average | $136.54 | Long-term trend line |
| Gamma flip (estimate) | $135.00 | One rough estimate of where hedging could flip from cushioning to amplifying |
Positioning and unusual flow
Market makers hedge the options they've sold. In a positive-gamma regime, their hedging tends to dampen moves. One rough estimate places MSTR in positive dealer gamma both chain-wide and for the October 2 expiration specifically.
The gamma flip level is the price below which market-maker hedging tends to accelerate selling rather than cushion it. The estimate puts it at about $135. Spot sits roughly 15% above that, a bit more cushion than usual for this name. That supports a "drift and pin" backdrop rather than a free-fall setup.
Three live flows stand out:
- October 2 $162.50 calls: 32,928 contracts traded against only 663 open, about $13.7 million in premium. That is heavy, short-term upside speculation just above max pain.
- October 2 $170 calls: 51,657 contracts traded, about $11.3 million in premium, yet open interest rose only 2,781. Most of that was day-trading or rolling rather than new bets held overnight.
- October 2 $167.50 calls: the +14,241 open-interest build. It could be fresh buying or call overwriting by holders capping upside. Either way, it made $167.50 the ceiling to watch.
3 · Technical check
Both technical reports lean bearish, which diverges from the slightly bullish options read.
- 3-day model: targets $156.80 by September 30, with a projected range of $154.00–$160.50. Its key levels are support at $155.00 and resistance at $160.30. Its dominant scenario, a pullback continuation, is invalidated by a reclaim above $161.00.
- 5-day model: targets $154.80 by October 2, with a projected range of $151.50–$162.00. It sees support at $157.11 and resistance at $160.30, and it flips if MSTR closes back above $160.30.
The most decisive technical reads are a bearish MACD crossover after the parabolic run and sellers holding directional control inside a strengthening trend (ADX 26.7). Money-flow readings have just turned slightly positive, which is the one hint of dip-buying underneath.
Both targets sit comfortably inside the options-implied range. The disagreement is about direction, not magnitude: the chart models expect the pullback to extend toward the gap-fill zone, while options flow shows traders buying that dip.
Model vs. Market: The options market implies $144.43–$172.79 into October 2; the 5-day technical model targets $154.80. A close back above $160.30–$161.00 would resolve the tension in the options' favor, while a slide through $153.92 would hand the round to the charts.
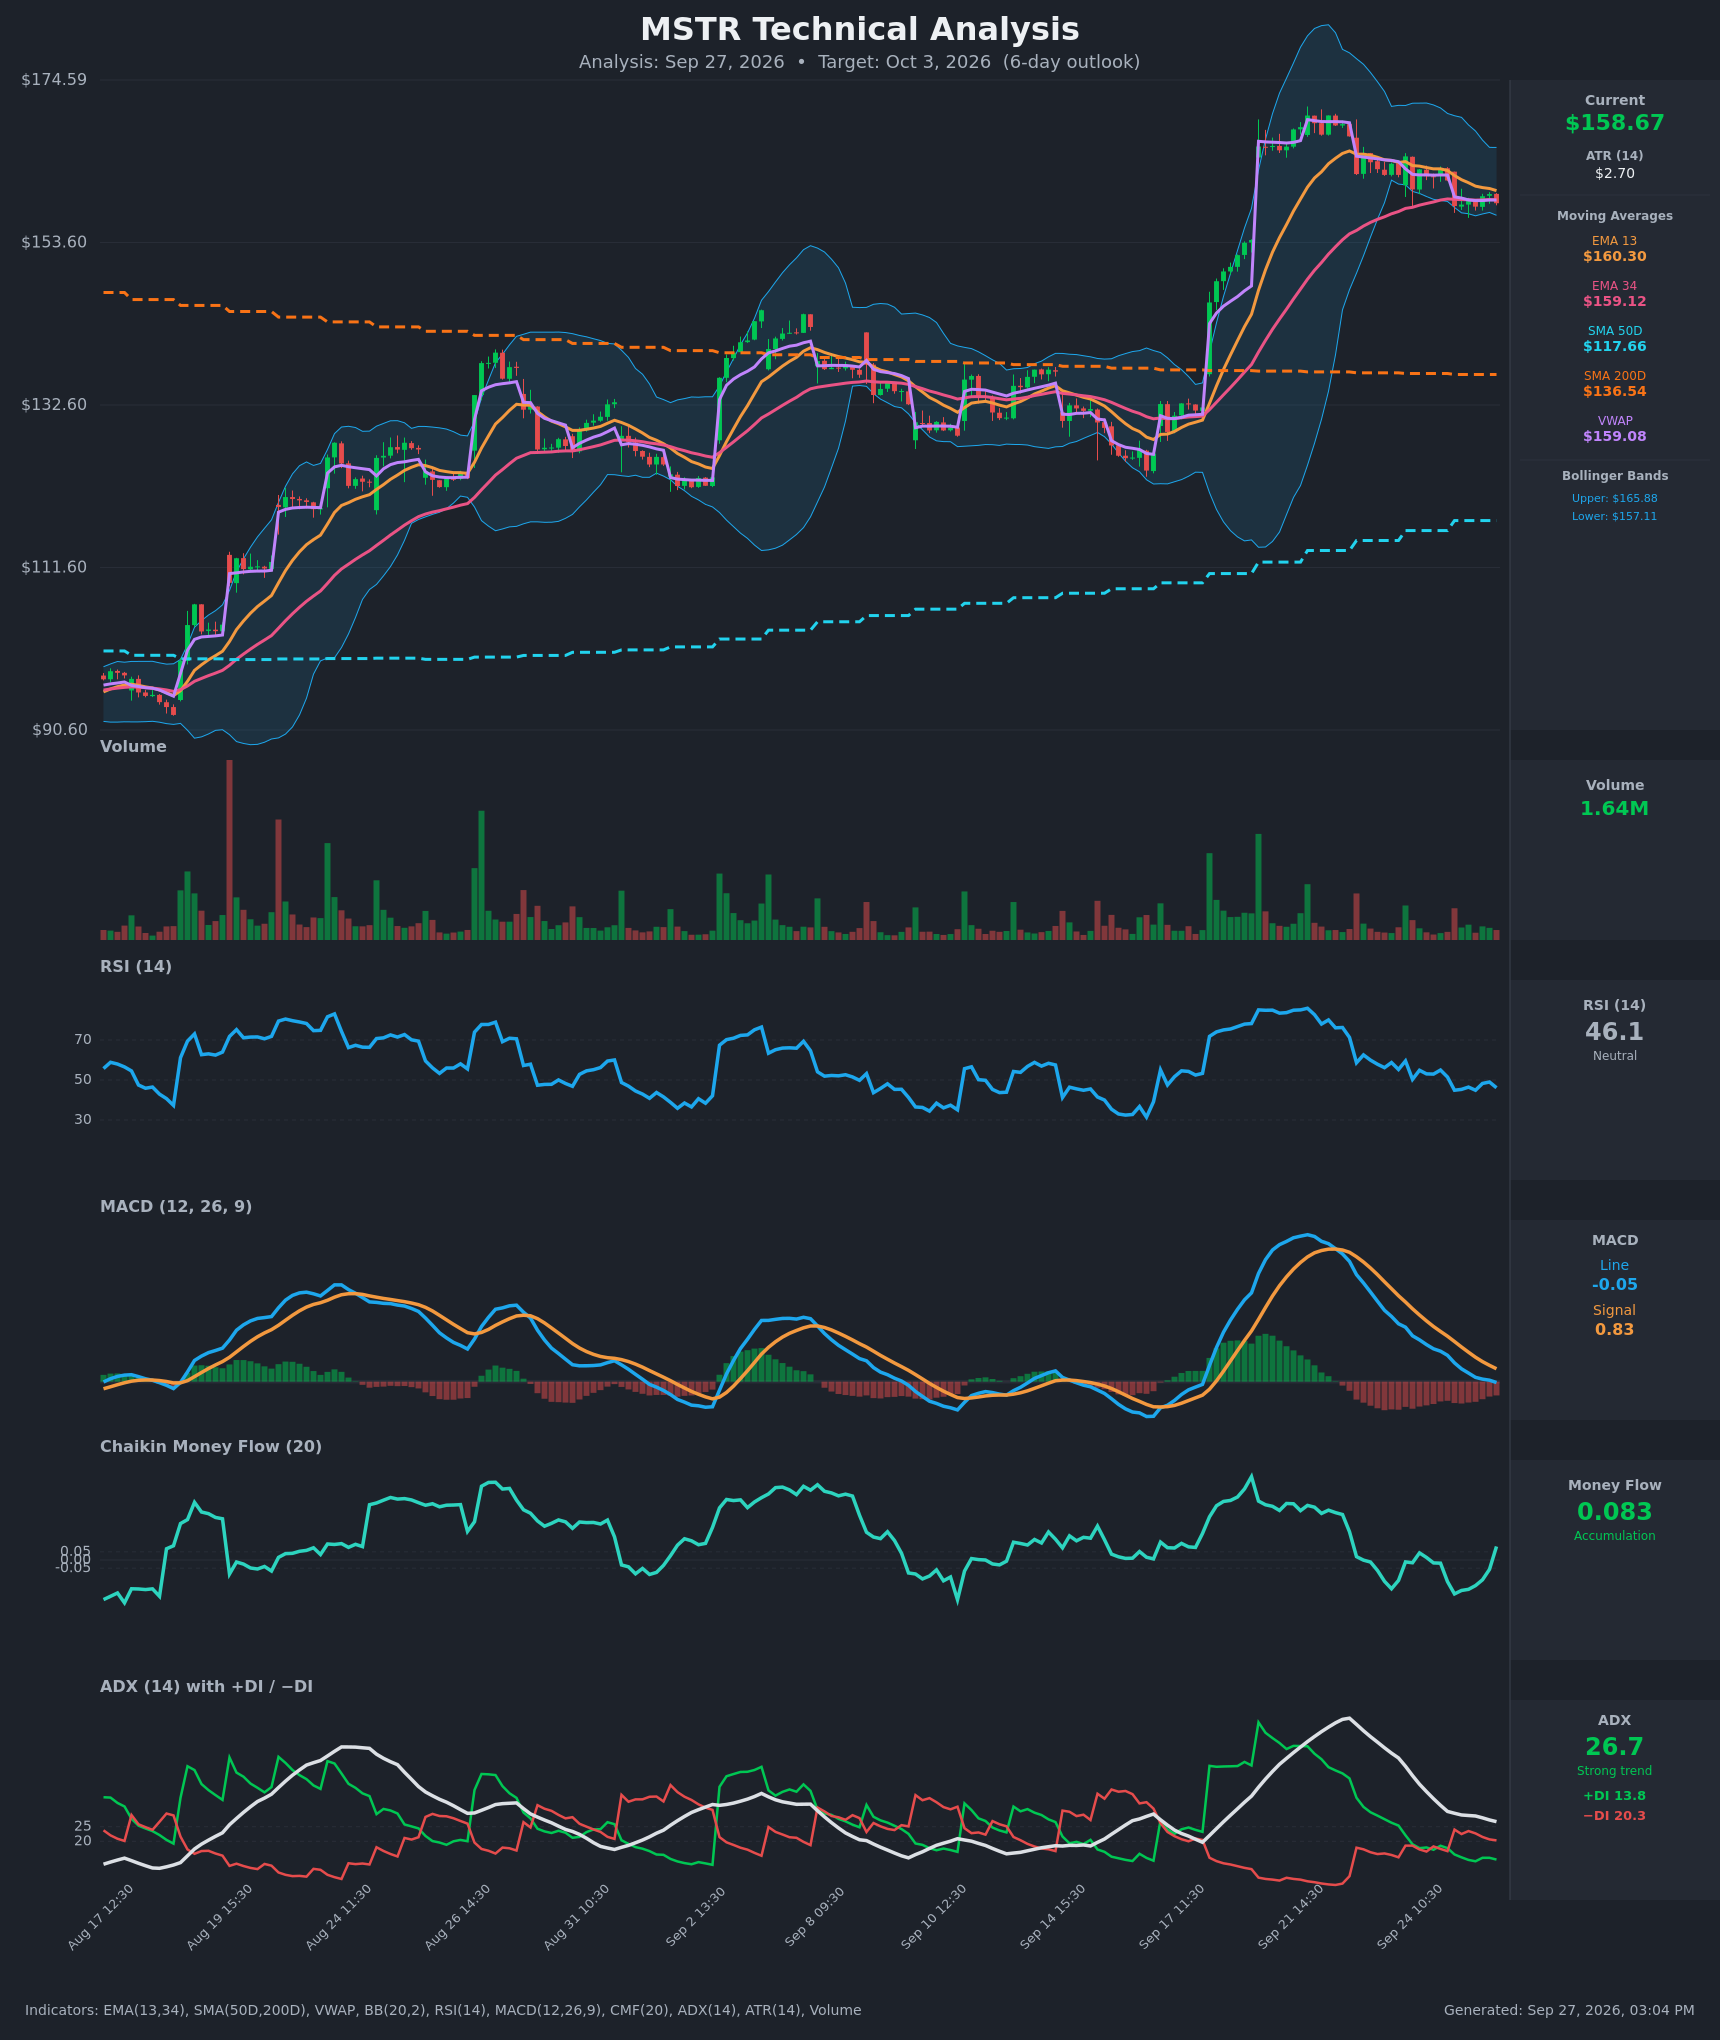
The bearish TA shaped strike selection below. The bull spread buys a strike just below spot rather than chasing, and the bearish spread's break-even is placed right at the 5-day model's target.
Full technical write-ups: 3-day report → · 5-day report →
4 · Three ways the next five days can go
If MSTR pushes above the call wall ($167.50): The freshly built pile of calls there tends to slow rallies, especially if some of that open interest is overwriting. A clean break would open the $171.19 swing high and the $172.79 upper rail, with another 13,339 open $175 calls above that.
If MSTR drifts between the walls: This is the pin case. Positive dealer gamma tends to dampen swings, and max pain at $160, the chain's largest-gamma strike, sits just above spot. Expiring open interest and hedging flows often pull price toward that zone into October 2.
If MSTR breaks below the put wall ($150): Losing the heaviest put strike removes the main cushion and exposes $144.92 swing support and the $144.43 lower rail. The gamma flip estimate (~$135) is far enough away that one rough estimate suggests hedging would still be dampening rather than accelerating the move. Even so, this is where the bullish lean is invalidated.
5 · Three defined-risk structures
Prices are end-of-day midpoints as of Friday, September 25, 2026. All structures are hypothetical. Verify live prices before trading — these will be stale by the open.
With IV rank near 14 and options priced well below delivered movement, all three structures are debit trades: you pay a known amount up front, and that amount is your maximum loss.
If you lean bullish: October 2 $157.50/$167.50 bull call spread
- Trade: Buy the October 2 $157.50 call, sell the October 2 $167.50 call. You pay a debit and profit if MSTR rises toward the call wall.
- Credit/Debit: $3.62 debit ($362 per spread) · Max profit: $638 · Max loss: $362 · Break-even: $161.12
- Why it fits: Call-heavy flow, richer-than-normal call skew, and the trend reads all agree on direction. The short strike sits at the $167.50 call wall, where rallies tend to stall anyway. Cheap IV keeps the entry cost reasonable.
- Makes sense only if: MSTR holds above the September 21 gap base and reclaims $160–$161 early in the window.
- Invalidated if: MSTR closes below $153.92, where the gap is fully filled. The article-level kill switch is a close below $150.
- Managing it: Take profits at roughly 50–60% of max gain. Given only five days, close by October 1 regardless rather than holding into expiration-day pin risk.
- Liquidity note: The $157.50 calls quoted 25¢ wide ($6.20/$6.45). The $167.50 calls quoted 15¢ wide ($2.63/$2.78), about 5.5% of mid. Work a limit near the mid.
- Analyze this position →
If you expect the range to hold: October 2 $155/$160/$165 call butterfly
- Trade: Buy one October 2 $155 call, sell two October 2 $160 calls, buy one October 2 $165 call. This is a small debit that pays most if MSTR finishes near $160.
- Credit/Debit: $0.775 debit ($77.50 per butterfly) · Max profit: $422.50 (at $160) · Max loss: $77.50 · Break-evens: $155.78 and $164.23
- Why it fits: Max pain and the largest-gamma strike both sit at $160, and estimated positive dealer gamma favors pinning. Unlike an iron condor, this is a debit trade, so it doesn't require selling premium that is historically thin.
- Makes sense only if: MSTR stays range-bound between $155 and $165 into expiration.
- Invalidated if: MSTR closes below $155 or above $165.
- Managing it: Butterflies gain most in the final day or two. Take profits if the position is worth 2–3× the debit, and exit by October 1 if price is outside the break-evens.
- Liquidity note: The $155 calls quoted 30¢ wide, the $160 calls 20¢ wide, and the $165 calls 15¢ wide, all under 5% of mid. Enter as a single order.
- Analyze this position →
Iron condor alternative: A 145/150/167.50/172.50 condor would collect about $1.93 at mid. You would be selling premium that hasn't been rich lately, so the butterfly is the preferred range expression.
If you lean bearish: October 2 $157.50/$150 bear put spread
- Trade: Buy the October 2 $157.50 put, sell the October 2 $150 put. You pay a debit and profit if MSTR falls toward the put wall.
- Credit/Debit: $2.89 debit ($289 per spread) · Max profit: $461 · Max loss: $289 · Break-even: $154.61
- Why it fits: This expresses the chart models' view. The break-even sits almost exactly at the 5-day model's $154.80 target, and the short strike sits at the $150 put wall, where declines tend to find support. Rising put open interest and put-heavy outsized trades give it some footing in the options data too.
- Makes sense only if: MSTR fails at $160–$161 and closes below the $157.11 technical support.
- Invalidated if: MSTR closes above $161.00.
- Managing it: Take profits near the $153.92 gap fill. Close by October 1 regardless.
- Liquidity note: The $157.50 puts quoted 15¢ wide ($4.90/$5.05). The $150 puts quoted 11¢ wide ($2.03/$2.14), about 5.3% of mid. Use limit orders.
- Analyze this position →
If none of these: no trade
Standing aside is a legitimate call here. Options flow and the chart models point in opposite directions, and bullish options reads on MSTR have historically been a shaky basis for short-window trades. Realized movement is running near 104% annualized, so a normal day can swing several dollars and knock out a tight structure before the thesis plays out.
If you can't size small enough to be comfortable losing the full debit, or if price is still chopping between $155 and $161 by midweek, waiting for a close outside that band gives a cleaner signal than forcing a position now.
6 · Quick FAQ
What is MSTR's expected move this week? About ±$14.18 (±8.94%) into the October 2 expiration, based on straddle pricing as of the September 25 close. That implies a range of $144.43–$172.79.
Is MSTR expected to go up or down over the next week? Options positioning as of September 25 leans slightly bullish, driven by heavy call buying and call-rich skew. That is a read of what traders have done, not a forecast, and both technical models lean bearish. The actionable map is the $144.43–$172.79 range, with $150 support and $167.50 resistance.
Are MSTR options expensive right now? No. IV rank of 13.67/100 means option prices are cheaper than roughly 86% of the past year's readings. They are also running about 39 vol points below the movement MSTR has actually delivered, thinner than 97% of this stock's own recent readings. That favors buying premium over selling it.
Where is MSTR's biggest options support and resistance? For the October 2 expiration, the put wall is at $150 and the call wall is at $167.50, with max pain at $160.
What invalidates this week's read? A close below $150.00.
Methodology & disclosures. Data: end-of-day options-chain snapshot for MSTR, 2026-09-25, generated 2026-09-27T15:04:32.843Z. Prices shown are midpoints and will differ from live markets. Momentum/positioning scores and volatility-premium comparisons are descriptive measurements of past option flow and past price movement — not investment advice, signals, forecasts, or guarantees. All trade structures are hypothetical. Every structure shown has a defined maximum loss; you can lose the entire max-loss amount. Options involve substantial risk and are not suitable for all investors.