MU Options Are Pricing a ±$70.80 Move Into September 21 — Our Chart Model Sees $958
Micron's options market implies a $904.46–$1,046.06 range into the September 21 expiration, with positioning leaning mildly higher while both technical models point down toward $958. Here's the level map and three defined-risk ways to trade the gap.

The options market implies a $904.46–$1,046.06 range into the September 21 expiration; here's what's driving it and three defined-risk ways to trade it.
Published Monday, September 14, 2026 · Data as of Friday, September 11 close · Export generated 2026-09-14
Explore the live MU options data in the Detailed Options Analyzer →
Quick answer
| Item | Answer |
|---|---|
| Market bias | Neutral with a bullish tilt |
| Spot (Friday, September 11 close) | $975.26 |
| Options-implied range (into September 21) | $904.46 – $1,046.06 (±7.26%, about ±$70.80) |
| Major support | $950.00 — the heaviest call open interest for the September 21 expiration sits here, and it doubles as chart support (the September 21 put wall prints at $1,000.00, above spot, on very thin open interest) |
| Major resistance | $1,000.00 — the whole chain's heaviest call strike, 35,153 contracts held open |
| Max pain (September 21) | $980.00 |
| Dealer gamma regime (estimate) | Positive — in this regime market-maker hedging tends to dampen moves; flip level ≈ $1,000.00 |
| Volatility condition | Falling — IV rank 22.74/100 · premium rich: options priced about 5 vol points above delivered movement (earnings-inflated) |
| Next earnings | October 9, 2026 — well after the September 21 expiration |
| Technical check | Diverges (bearish, 4-day and 7-day models) |
| Best-fitting strategy | Short put spread, if you want the positioning lean expressed with defined risk |
| Analysis invalidated if | MU closes below $950.00 |
1 · What matters today
Micron closed Friday, September 11 at $975.26 after a wild fortnight, and the options market is pricing roughly a $70.80 move in either direction over the next seven days — the move the options market is pricing in, derived from what straddles cost. That works out to a $904.46 to $1,046.06 band into the September 21 expiration.
Our read of options flow leans mildly bullish: short-dated sentiment is call-tilted across every part of the curve, call open interest is building faster than put open interest, and puts are actually cheaper than calls at equivalent distances from spot — not what you see when traders are scared. It is a lean, not a conviction call, and the chart models disagree: both the 4-day and 7-day technical reads target $958.
The one level that changes everything is $950. A close below it kills this read.
2 · What the options market is pricing
What changed this week
MU is up 1.78% over the past five sessions and 1.91% over the past twenty — but that flat-looking net figure hides a round trip through $1,026.90 on September 9 and back down. Implied volatility (the market's estimate of how much MU will move, baked into option prices) has been the big mover: chain-wide at-the-money IV fell 7.28% in a single session, 3.81% over five days, and 35.49% over the past 30 days.
Positioning tells a two-sided story. Put volume ran at 0.56 contracts for every call traded on Friday, below the 7-day average of 0.58 and the 14-day average of 0.60 — a call-heavy tape, and unusually call-tilted even by this stock's own recent standards. But open interest moved the other way: the put/call open-interest ratio climbed from 0.65 to 0.79 over five sessions, a 22% jump, meaning traders have been holding more downside protection even while trading calls intraday. The single biggest open-interest build outside Friday's expiring contracts was in the November 20 $1,100 calls, which added 7,250 contracts to reach 9,278 held open — a long-dated, far-out-of-the-money upside bet, not a hedge. (Into Friday's expiration, flow was frantic: the expiring $1,000 calls traded 69,720 contracts and the $975 puts 51,006, but all of that is settled history now.)
One timing note worth holding onto: the short-term trend read turned bullish on September 3 and is firmly positive over the past week, but stretch the lens to roughly fifty sessions and MU is still down 5.25% with a flat momentum read. Near-term flow and the bigger picture are not yet telling the same story — an argument for shorter-dated directional structures and earlier profit-taking rather than patient position-building.
Expected move
Into September 21, the options market prices roughly ±$70.80 around $975.26 — that's ±7.26%, or a $904.46 to $1,046.06 band. Here is the full ladder of tradeable rungs:
| Expiration | Implied move | Range around $975.26 |
|---|---|---|
| September 16 | ±5.24% | $924.16 – $1,026.36 |
| September 18 | ±6.69% | $910.02 – $1,040.50 |
| September 21 (our horizon) | ±7.26% | $904.46 – $1,046.06 |
| September 25 | ±9.65% | $881.15 – $1,069.37 |
The rungs step up smoothly — roughly $6 of extra priced-in range for each additional calendar day out to the 21st — which tells you the market isn't bracing for a specific dated event inside this window.
Volatility
Chain-wide at-the-money IV sits at 59.63%, with an IV rank of 22.74/100 — where today's IV sits versus the past year, meaning option prices are cheaper than roughly 77% of the past year's readings. The IV percentile is even lower at 12.3. Current IV also sits well under its own 30-day average of 69.18% and its 90-day average of 87.96%, and the 30-day change is −35.49%. This is a volatility deflation tape. The front-month read is unavailable today because Friday was an expiration day — that's a calendar artifact, not missing data.
Two readings stand out against this stock's own recent history: 20-day realized volatility at 54.42% is unusually low for MU, while the 5-day-versus-20-day realized ratio at 1.22 says actual movement has been accelerating over the past week relative to its own month. Quiet by MU standards, but getting less quiet.
Premium rich or cheap. The volatility risk premium — the gap between how much movement options are priced for and how much MU has actually delivered — sits at about 5 vol points positive, which means option sellers have recently been collecting more than realized movement cost them. That gap is richer than about 80% of this stock's own recent readings. But the important caveat: MU reports earnings on October 9, inside the 30-day window that mechanically inflates this measure, so some of that richness is the market pre-pricing the October 9 report, not free premium. The path matters too: the gap has compressed hard, from roughly 14 vol points on September 8 to about 5 today, as implied volatility collapsed faster than realized movement faded. And note where the richness actually lives — the September 21 rung itself prices at-the-money IV at just 43.88%, far under the chain-wide 59.63%. Within our seven-day window, premium is not obviously expensive at all.
Skew and sentiment
Skew — the observation that puts and calls the same distance from the stock price don't cost the same — is inverted here. The 25-delta put prices at 56.30% IV versus 58.11% for the 25-delta call: puts are 1.8 vol points cheaper than calls. That's exactly in line with this name's own 60-day median of −1.8 vol points, though it has flattened from the past week's average of −3.9 points, when calls were even richer. Translation: nobody is paying up for crash protection in MU; if anything, traders are still paying a premium for upside, just less of one than a week ago.
Short-dated sentiment confirms it. Our read of directional lean by expiration bucket scores the 0–7 day bucket at +33 and the 7–30 day bucket at +30, against 7-day averages of +38 and +35 — every bucket on the curve leans bullish, driven by call-side delta-weighted flow and call open interest building faster than put open interest. The one dissenting voice is our leading positioning read, which flagged a divergence on Friday: price pushed nearly 7% higher across the trailing window while the positioning composite faded by more than 30 points. That's the kind of pull-apart that has historically preceded turns, and it is the main reason this article's bias is a tilt rather than a call.
The key levels map
| Level | Price | Why it matters |
|---|---|---|
| Implied range top (Sep 21) | $1,046.06 | Upper rail of the ±7.26% move the options market prices |
| Swing resistance | $1,035.82 | Prior pivot cluster from the daily price structure |
| Swing resistance | $1,011.77 | Nearest overhead pivot above the round number |
| Call wall (whole chain) / gamma flip (estimate) | $1,000.00 | 35,153 calls held open — the single heaviest strike in the book, the largest gamma strike, and one rough estimate places the dealer gamma flip here; also the September 21 put wall, on only 63 contracts |
| Swing resistance | $990.53 | First real chart friction above spot |
| Max pain (Sep 21) | $980.00 | Where the most option value would expire worthless — expirations sometimes gravitate toward it; also the chain's second-largest gamma strike |
| Spot | $975.26 | Friday's close |
| 20-day moving average | $962.81 | Price is 1.29% above it — the first trend line to lose |
| Call wall (Sep 21) | $950.00 | Heaviest call open interest for our horizon expiration, though on just 141 contracts; the chain's third-largest gamma strike sits here and both technical models name it as support |
| Swing support | $924.88 | Next structural shelf below |
| 50-day moving average | $928.61 | Price is 5.02% above it |
| Implied range floor (Sep 21) | $904.46 | Lower rail of the priced-in move |
One honesty note on the walls: the September 21 expiration is thinly held — its heaviest call strike carries 141 contracts and its heaviest put strike 63. Those are not magnets in any meaningful sense. The gravitational strikes for this stock are the whole-chain levels: $1,000, $980, and $950, in that order of gamma weight. When the horizon expiration's own walls and the aggregate disagree this sharply, trust the aggregate.
Positioning and unusual flow
One rough estimate of dealer positioning puts the chain in a positive gamma regime — market makers hedge the options they've sold, and in this regime their hedging tends to dampen moves rather than amplify them. The same estimate places the flip level at $1,000, meaning that dampening effect is strongest above spot and thins out below it. Treat both as estimates built on an assumed convention, not observed dealer inventory.
Three flow items are worth naming, all in live contracts:
- September 18 $975 calls — 4,744 contracts traded against 466 held open, about $12.5 million of premium, and the highest volume percentile in its peer group. That's fresh at-the-money upside exposure in the front week, the largest single-contract premium print in the chain.
- September 21 $965 calls — 336 contracts traded against a single contract of prior open interest, roughly $1.1 million of premium. Brand-new positioning directly at our horizon expiration, and call-side.
- November 20 $1,100 calls — open interest up 7,250 to 9,278, the biggest build anywhere in the book. Far out of the money, far-dated, and unambiguously a bet on upside rather than a hedge.
3 · Technical check
Both technical timeframes read bearish, and both land on the same target. The 4-day model (checkpoint September 18) projects $958 with a $940 to $985 range, citing RSI rolling over from the high 60s to 41.4, price closing below both short-term moving averages, and a MACD histogram that is negative and widening. It flags support at $950 and resistance at the $982.36 moving-average and VWAP cluster, and names a close back above $986 as the invalidation of its dominant scenario.
The 7-day model (target September 21) reaches the same $958 with a wider $933 to $1,006 band, support at $951.89 and resistance at $997.72. Its one genuinely useful nuance: ADX at 17.2 with the directional indicators essentially tied means there is no strong trend at all right now — sellers have a statistical edge that is real but very slim, and the longer-term uptrend above the 50-day ($928.61) and 200-day ($622.07) moving averages is untouched.
Classification: diverges. The technical direction contradicts the options-positioning lean, even though its target sits comfortably inside the options-implied range. That divergence is why this article's bias is a tilt rather than a call, and why the bullish structure below is built with its short strike down at $950 rather than anywhere near spot.
Model vs. Market: The options market implies $904.46 to $1,046.06 into September 21; the 7-day technical model targets $958 inside a $933 to $1,006 band. The chart model's entire projected range fits inside the options' rails — the disagreement isn't about how far MU travels, it's about which way. A daily close back above $990 would resolve it in the options market's favour; a close below $950 resolves it in the chart's.
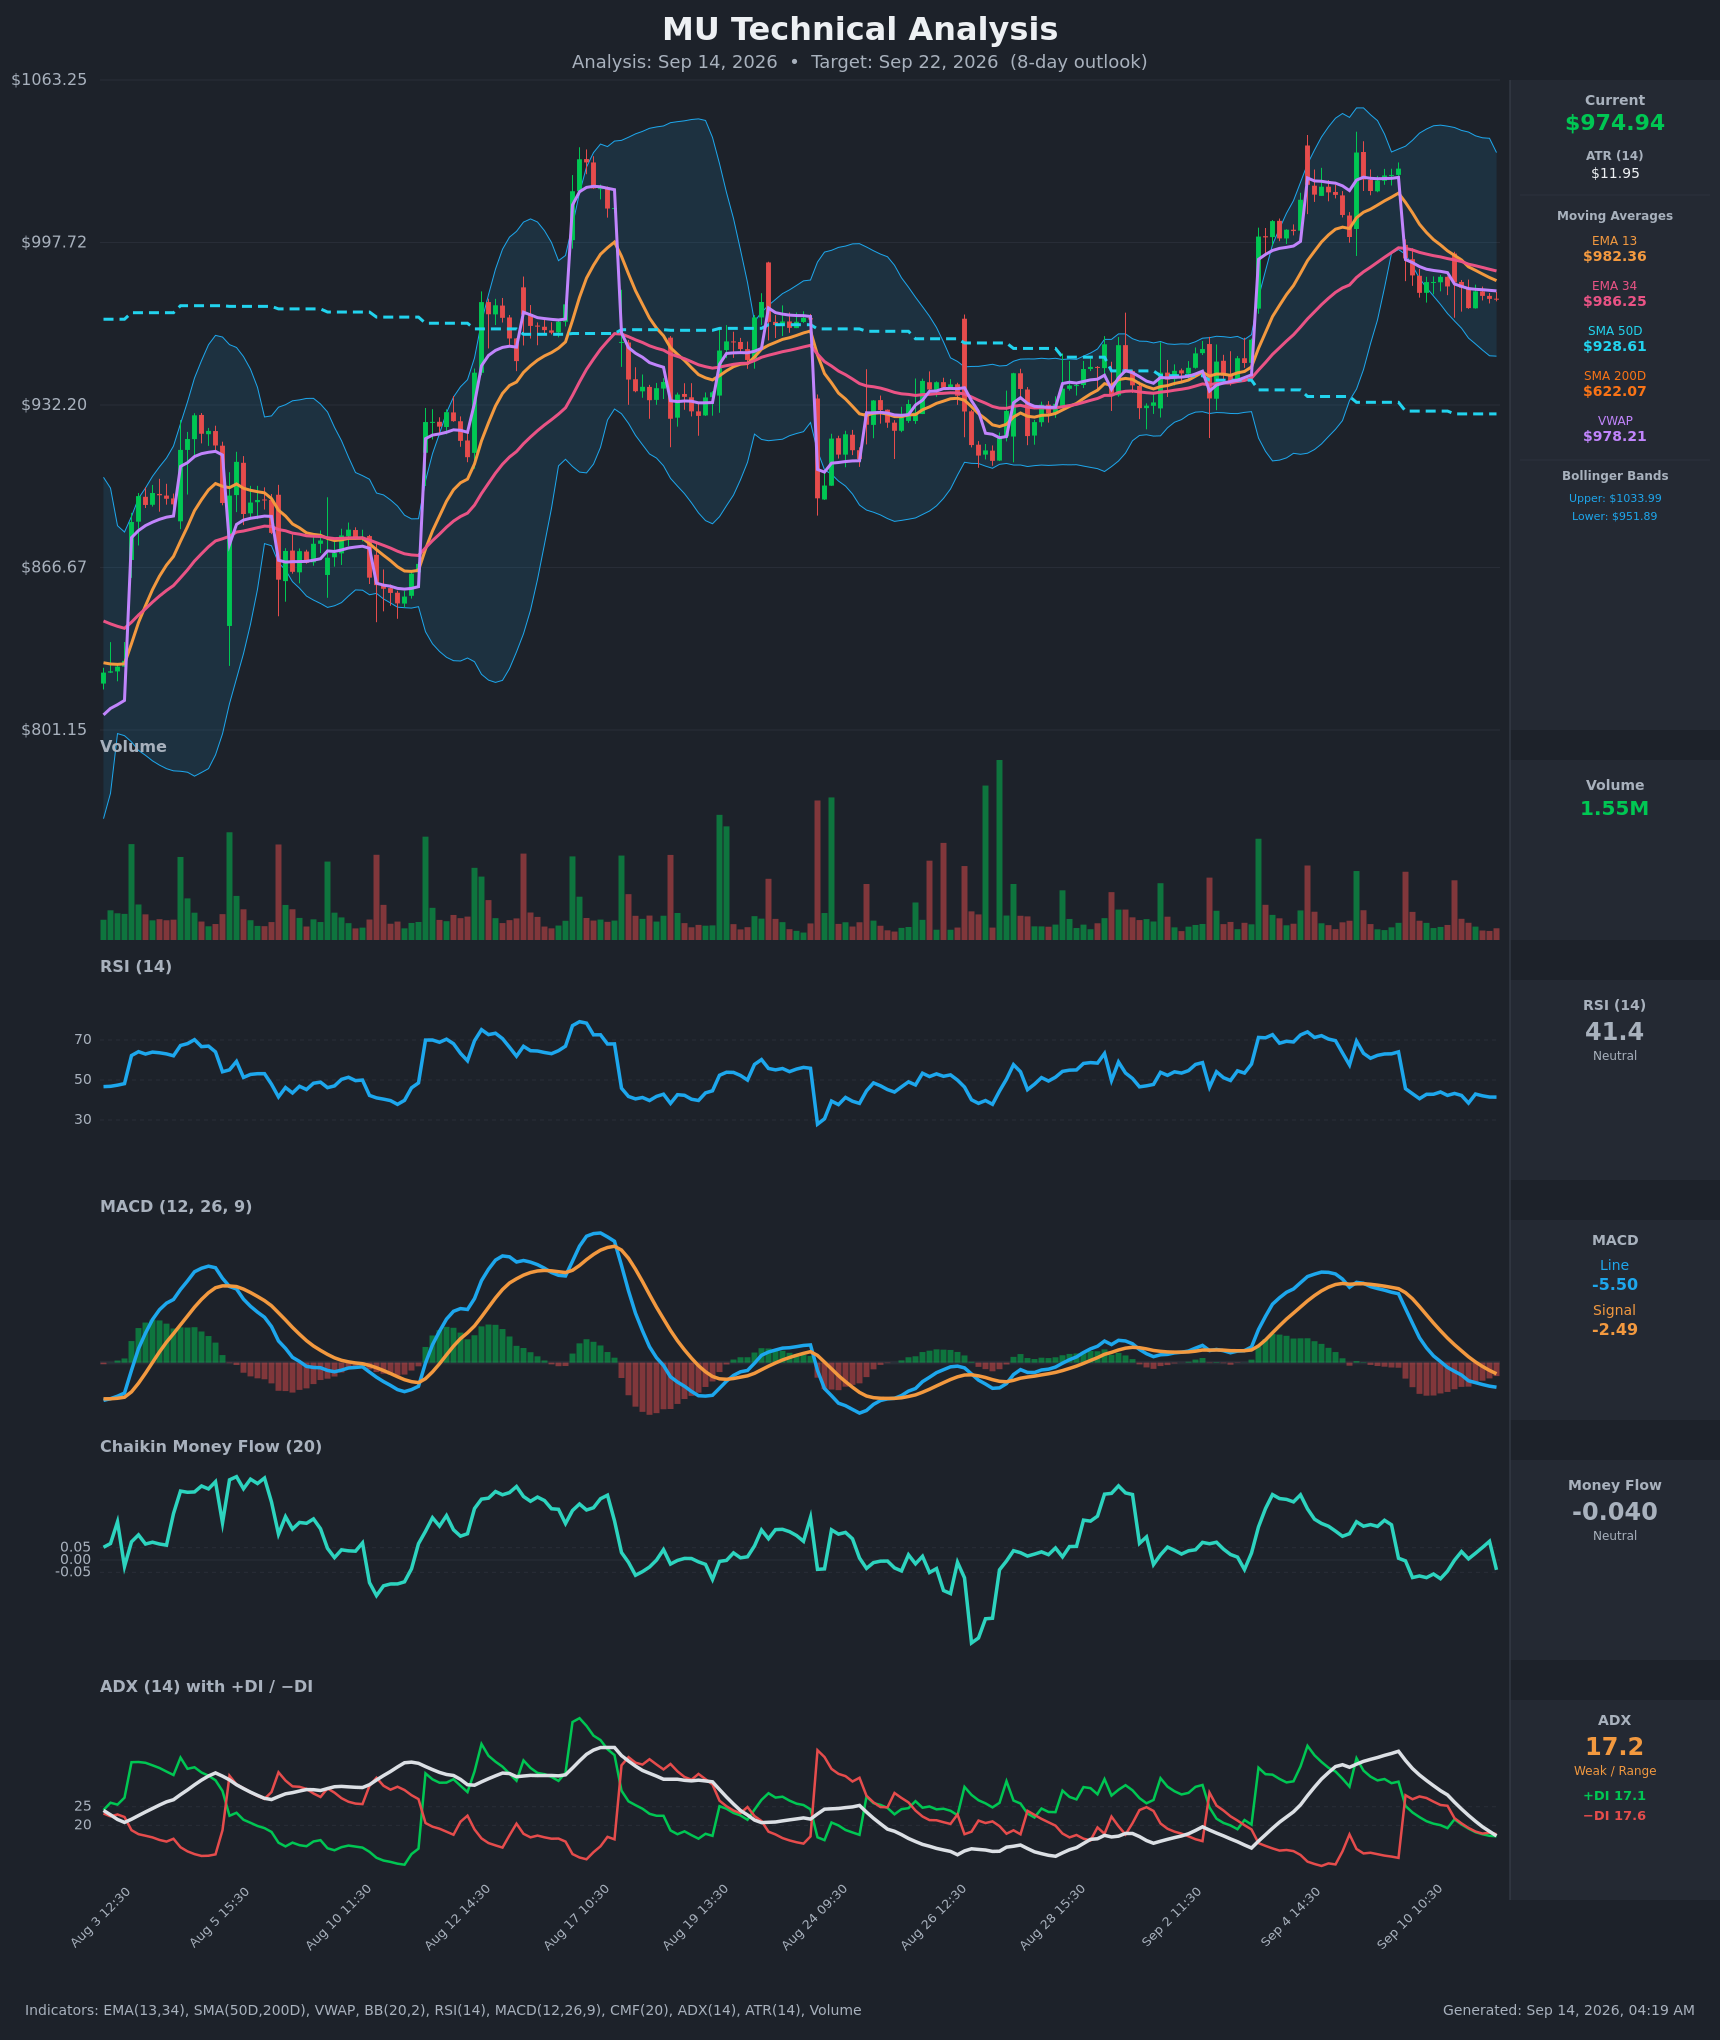
Full technical write-ups: 4-day report → · 7-day report →
4 · Three ways the next seven days can go
If MU pushes above $1,000: that's where the chain's heaviest call open interest sits — 35,153 contracts — and heavy overhead call positioning tends to slow rallies as dealers hedge into strength. It's also where one rough estimate places the gamma flip, so a clean break through it moves price onto the side where hedging is most dampening. Above $1,011.77 the book thins out quickly toward $1,035.82 and the implied-range top at $1,046.06.
If MU drifts between the levels: this is the base case the positioning supports. Max pain for September 21 is $980.00, just $4.74 above Friday's close, and the estimated positive gamma regime argues for hedging flows that compress rather than extend moves. A week that ends anywhere between $950 and $1,000 would be entirely ordinary given how this book is built.
If MU breaks below $950: that level carries the September 21 expiration's heaviest call open interest and is the support both technical models name. Spot already sits about 2.5% under the $1,000 flip estimate — a bit deeper below it than this stock typically runs — and below the flip, one rough estimate suggests market-maker hedging amplifies selling rather than cushioning it. The next structural shelf is $924.88, with the 50-day moving average at $928.61 in the same zone and the implied-range floor at $904.46.
5 · Three defined-risk structures
Prices are end-of-day midpoints as of 2026-09-11. All structures are hypothetical. Verify live prices before trading — these will be stale by the open.
If you lean bullish: short put spread (September 21)
- Trade: Sell the September 21 $950 put, buy the September 21 $930 put
- Credit: $5.83 · Max profit: $583 per spread · Max loss: $1,417 · Break-even: $944.17
- Why it fits: A credit spread pays you up front to be right slowly — you keep the credit if MU simply stays above $950. The short strike sits on the horizon expiration's heaviest call strike, on chart support named by both technical models, and $25 below spot; skew means you're selling the cheaper side of the book, which is a mild headwind, but the positioning lean and the max-pain pull toward $980 are the tailwinds.
- Makes sense only if: you believe the low-conviction, positive-gamma drift case rather than the chart models' push toward $958–$950.
- Invalidated if: MU closes below $950.00.
- Earnings exposure: expires 18 days before the October 9 report — no earnings-gap risk.
- Managing it: close at roughly 50% of max credit; take profits early given that the short-term trend read is fighting a flat fifty-day picture. If MU closes through $950, close the spread rather than hope — that's the same level that invalidates the article.
- Liquidity note: the September 21 chain is thin. The $950 puts quoted $16.00 bid / $17.70 ask ($1.70 wide, about 10% of mid) and the $930 puts $10.45 / $11.60. Work a limit order into the middle and expect to give up something versus the midpoint math above.
- Analyze this position →
If you expect the range to hold: iron condor (September 21)
- Trade: Sell the $930 put / buy the $915 put, and sell the $1,020 call / buy the $1,035 call, all September 21
- Credit: $6.15 · Max profit: $615 · Max loss: $885 · Break-evens: $923.85 and $1,026.15
- Why it fits: Both break-evens sit inside the options-implied $904.46–$1,046.06 band, so this is explicitly a bet that MU does not deliver the full move it's priced for. The estimated positive gamma regime and the $980 max pain both support a compressed week.
- Makes sense only if: you're comfortable that the 5-vol-point premium cushion is partly earnings-inflated and that the September 21 rung itself prices only 43.88% at-the-money IV — you are not selling historically rich front-week premium here, so size accordingly.
- Invalidated if: MU closes below $950.00 or above $1,000.00 — either break puts one side under pressure well before expiration.
- Earnings exposure: expires 18 days before the October 9 report — no earnings-gap risk.
- Managing it: close at 50% of max credit or by September 18, whichever comes first; the last three sessions of a short-gamma week are where condors give back their gains.
- Liquidity note: four legs in a thin expiration is the weak point — the $1,020 calls quoted $11.85 / $13.00 and the $915 puts $7.40 / $8.15. Leg risk is real; use a single combo limit order or skip this one.
- Analyze this position →
If you lean bearish: put debit spread (September 18)
- Trade: Buy the September 18 $975 put, sell the September 18 $950 put
- Debit: $10.63 · Max profit: $1,437 · Max loss: $1,063 · Break-even: $964.38
- Why it fits: A debit spread means you pay up front and profit as price falls toward your short strike. This is the structure that expresses both chart models directly — their shared $958 target sits between the break-even and maximum profit. It uses the September 18 expiration rather than the 21st for two reasons: that's the near-term technical checkpoint, and the front-week chain is dramatically more liquid. Front-dated implied volatility running under delivered movement also favours owning options here rather than selling them.
- Makes sense only if: you're willing to fade a positioning read that leans the other way — this trade is a bet on the technicals over the flow.
- Invalidated if: MU closes above $990.00, the 7-day model's own invalidation zone and the first swing resistance above spot.
- Earnings exposure: expires 21 days before the October 9 report — no earnings-gap risk.
- Managing it: take profit into any test of $955–$950 rather than waiting for maximum value; with the short-term move fighting a flat longer-term trend, the odds favour taking what the move gives you.
- Liquidity note: excellent. The $975 puts traded 60¢ wide (about 2.3% of mid) and the $950 puts 35¢ wide, with $4.1 million of premium changing hands in the $950s alone. Fills should be easy.
- Analyze this position →
If none of these: no trade
There is a respectable case for standing aside. The premium looks rich on the chain-wide measure, but that measure is contaminated by the October 9 earnings report sitting inside its window, and the expiration you'd actually be selling prices only 43.88% at-the-money IV against 54.42% realized — so the "sell premium into a rich reading" argument mostly evaporates once you look at the rung you're trading. Add an IV rank of 22.74, a target expiration whose own open interest is too thin to produce reliable walls, bid-ask spreads running 10% of mid on the strikes you'd want, and a flat technical trend with ADX at 17.2, and you have a week where the edge is small and the friction is large. Waiting for either a close through $950 or a reclaim of $990 — and then trading the resolution in a liquid expiration — is a legitimate answer.
6 · Quick FAQ
What is MU's expected move this week? About ±$70.80, or ±7.26%, into the September 21 expiration — a $904.46 to $1,046.06 range, per the options market's straddle pricing as of the September 11 close.
Is MU expected to go up or down over the next week? Options positioning as of September 11 leans mildly bullish — call-tilted flow across every expiration bucket and calls priced richer than puts — but that's a read of what traders have done, not a forecast. Both technical models point the other way, toward $958. The actionable map is the $904.46–$1,046.06 range and the $950 / $1,000 levels.
Are MU options expensive right now? Two lenses. An IV rank of 22.74/100 says option prices are lower than about 77% of the past year's readings. On top of that, chain-wide implied volatility is running roughly 5 vol points above the movement MU has actually delivered — richer than about 80% of this stock's own recent readings — but some of that richness is the market pre-pricing the October 9 earnings report, and the September 21 expiration itself prices well below the chain-wide level. Front-week premium is not expensive.
Where is MU's biggest options support and resistance? The chain's heaviest strike by far is $1,000, with 35,153 calls held open, which is the level that caps upside. Below spot, $950 carries the September 21 expiration's heaviest call open interest and the chain's third-largest gamma concentration, and both technical models name it as support.
What invalidates this week's read? A daily close below $950.00.
Methodology & disclosures. Data: end-of-day options-chain snapshot for MU, 2026-09-11, generated 2026-09-14T04:19:52.222Z. Prices shown are midpoints and will differ from live markets. Momentum/positioning scores and volatility-premium comparisons are descriptive measurements of past option flow and past price movement — not investment advice, signals, forecasts, or guarantees. Earnings dates and reported results are from the data provider's earnings feed as of 2026-09-14T04:19:52.222Z; report dates can change. All trade structures are hypothetical. Every structure shown has a defined maximum loss; you can lose the entire max-loss amount. Options involve substantial risk and are not suitable for all investors.