MU Options Price a $69.69 Move Into October 23 and Positioning Leans Lower Below $900
After a 14.6% five-day slide, MU options imply a $809.15–$948.53 range into the October 23 expiration. Put-heavy flow and steep skew tilt the read lower, and a close back above the $900 put wall would undo it.
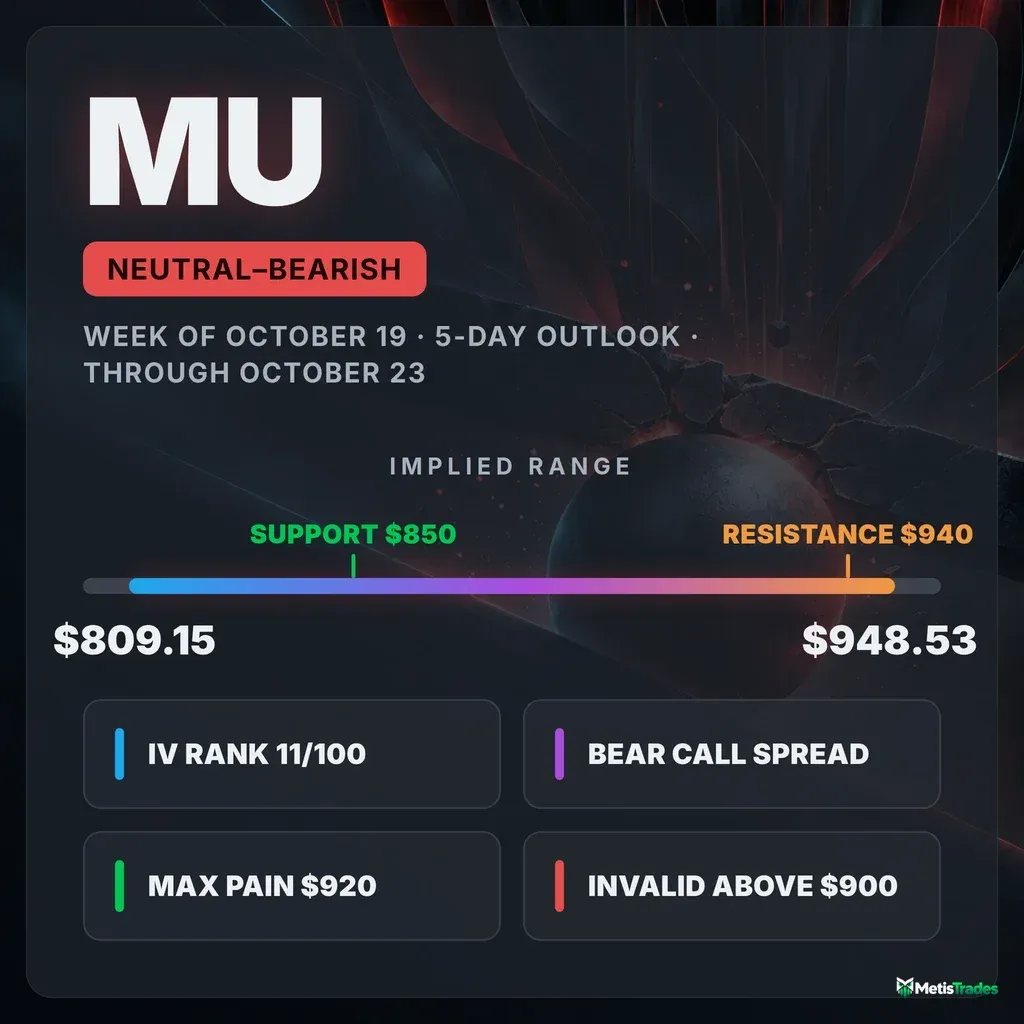
The options market implies a $809.15–$948.53 range for MU into the October 23 expiration. Here's what's driving it, where the levels sit, and three defined-risk ways to trade it.
Published Sunday, October 18, 2026 · Data as of Friday, October 16, 2026 close
Explore the live MU options data in the Detailed Options Analyzer →
Quick answer
| Item | Answer |
|---|---|
| Market bias | Neutral with a bearish tilt |
| Options-implied range (into Oct 23) | $809.15 – $948.53 (±7.93%, ±$69.69) |
| Major support | $850, the heaviest put-strike gamma below price. The $900 put wall was lost on Friday and now sits overhead. |
| Major resistance | $940 call wall (Oct 23), with $900 as the first ceiling |
| Max pain (Oct 23) | $920 |
| Dealer gamma regime (estimate) | Negative, so hedging tends to amplify moves; flip level ≈ $750 |
| Volatility condition | Rising. IV rank 11.1/100 · premium modestly rich: options are priced ~3.5 vol pts above delivered movement |
| Technical check | Confirms (bearish). 3-day target $862, range $843–$890; 5-day target $866, range $845–$905 |
| Best-fitting strategy | Oct 23 $910/$930 bear call spread, if MU stays below $900 |
| Analysis invalidated if | MU closes above $900 |
1 · What matters today
Micron closed Friday at $878.84, down 14.6% in five sessions. Options traders spent that slide buying puts. Our read is neutral with a bearish tilt.
The key detail is location. The $900 strike holds the most open put contracts for the October 23 expiration and was the market's floor. MU now trades below it, so the old floor has become the first ceiling.
The options market is pricing a move of about $69.69 either way by Friday, October 23. That is a range of roughly $809 to $949, derived from what at-the-money straddles cost.
A close back above $900 would undo the tilt. Both chart-based models also lean lower, with targets in the mid-$860s.
The tilt is moderate, not a conviction call. After a drop this sharp, some of the put buying is protection rather than a pure bet on more downside.
2 · What the options market is pricing
What changed this week
This was a week of steady defensive positioning:
- Put/call open interest jumped. For every call contract held open there are now 1.17 puts. Five sessions ago it was 0.81, and the 14-day average is 0.84. Traders added downside protection quickly as MU gapped lower at five straight opens from October 12 through October 16.
- Put volume rose too. Friday's put/call volume ratio was 0.83, against a 7-day average of 0.68 and a 14-day average of 0.60. Total option volume ran 1.42× its 20-day average.
- Implied volatility (IV) climbed. IV is the market's estimate of how much MU will move, baked into option prices. It rose 13.8% over five days as the stock fell.
- The biggest single open-interest change pointed the other way. The November 20 $980 calls went from 640 to 7,474 contracts held open, an add of 6,834. Someone is positioning for a recovery a month out, well above today's price.
Our flow-momentum read sits at −60 on a ±100 scale, versus a 7-day average of −43 and a 14-day average of −20. Flow has turned decisively put-heavy over the last two weeks, not just on one day.
The trend reads agree with each other. Both the past week and the past month point lower, while the two-month picture is roughly flat (price −0.3% over about 50 sessions). This is a sharp correction inside a stock that was trading near the same level two months ago.
Expected move
Into Friday, October 23, at-the-money straddle pricing implies ±7.93%, or about ±$69.69, around the $878.84 snapshot price. That is a $809.15–$948.53 range. The ladder:
| Expiration | Implied move | Range around $878.84 |
|---|---|---|
| Monday, Oct 19 | ±4.22% | $841.75 – $915.93 |
| Wednesday, Oct 21 | ±6.54% | $821.36 – $936.32 |
| Friday, Oct 23 | ±7.93% | $809.15 – $948.53 |
| Friday, Oct 30 | ±11.14% | $780.94 – $976.74 |
The near rungs carry a little extra fear. October 21 and October 23 options price around 56–57% IV, while the October 26 contracts price closer to 51%. The market is paying up for the next few sessions specifically, which fits a stock that just gapped down five days running.
Volatility
At-the-money IV is 51.87%.
- IV rank is 11.1/100. IV rank shows where today's IV sits versus the past year, so 11/100 means cheaper than about 89% of the past year's readings.
- The IV percentile is lower still, at 5.2.
- IV is rising in the short run but low against its averages. It rose 1.4% on Friday and 13.8% over five days, yet it is down 16.3% over 30 sessions. It is still below its 30-day average (56.95%) and far below its 90-day average (77.37%).
So option prices are rising off a low base. They are not expensive in absolute terms.
The front-month term-structure read is unavailable today because Friday was an expiration day.
One "vs its own norm" observation stands out. This means compared against MU's own recent history: "unusual" here means unusual for MU, not versus the broader market. Despite the sharp drop, MU's 20-day realized movement (48.3% annualized) is somewhat below its usual level. The selloff came as a steady series of gaps, not wild intraday whipsaws.
Is premium rich or cheap? The volatility risk premium measures the gap between how much movement options are priced for and how much MU has actually delivered. When it's positive, option sellers have been collecting more than realized movement cost them.
- The gap is about 3.5 vol points. Options are pricing that much more movement than MU's 20-day realized volatility.
- That is richer than about 70% of MU's own recent readings.
- The richness is new. The gap hovered near zero, or slightly negative, from October 2 through October 14, then jumped on October 15 and 16 as IV rose into the selloff.
The combination is a low IV rank but a 70th-percentile premium over delivered movement. That modestly favors collecting premium this week, but only in defined-risk form, since the absolute price of options is still low.
Skew and sentiment
Skew means that puts and calls the same distance from the stock price don't cost the same. When puts are pricier, traders are paying up for crash protection.
- Puts now carry a clear premium. MU's 25-delta puts trade at 55.1% IV versus 51.3% for comparable calls, a gap of 3.8 vol points. Over the prior 60 days the norm was the opposite, with calls about 1.5 points richer.
- That is a swing of roughly 5.4 points toward downside protection. Traders who were reaching for upside a month ago are now insuring against more downside.
- The urgency stands out against MU's history. Put-side sweeps dominated the day's most unusual contracts (15 put contracts versus 12 calls cleared the top-5% volume bar for their peer groups). Both that put-sweep pace and the put-heavy volume tilt rank unusually heavy against MU's own history.
Short-dated sentiment is more balanced than the headline ratios suggest:
- Our read of options expiring within seven days is essentially flat (+1).
- The 7–30 day window reads exactly 0.
- The overall picture across expirations is "Mixed."
Over the past seven sessions those same buckets averaged +21 and +9. The near-term call support that existed earlier in the month has drained away, but it hasn't flipped to outright bearish. Call open interest is still being added in the shortest expirations even as put trading dominates volume. That two-sided tug is why this is a tilt and not a firm call.
The key levels map
| Level | Price | Why it matters |
|---|---|---|
| Swing resistance | $990.53 | Recent pivot cluster; the 50-day average ($983.12) sits just below |
| Top of implied range (Oct 23) | $948.53 | Upper edge of the ±$69.69 straddle-implied move |
| Call wall (Oct 23) | $940 | The strike with the most open call contracts for this expiration (1,413). These often act like magnets or barriers. The whole chain's heaviest call strike is far higher, at $1,100. |
| Swing resistance | $924.88 | Pivot from the mid-October bounce attempt |
| Max pain (Oct 23) | $920 | The price where the most option value would expire worthless. Expirations sometimes gravitate toward it, but it is $41 above spot. |
| Large gamma strike | $910 | Second-largest concentration of option gamma in the chain |
| Swing resistance | $902.60 | Pivot just above the put wall |
| Put wall (Oct 23 and whole chain) | $900 | The strike with the most open put contracts (4,265 for Oct 23; 26,593 across all expirations), and the single largest gamma strike. It was lost Friday and is now overhead. |
| Technical resistance | $895.77 | Chart models' VWAP resistance |
| Swing resistance | $889.63 | Nearest overhead pivot |
| Spot (Friday close) | $878.84 | Snapshot and official close match |
| Technical support | $858 | October 15 wick low cited by the 3-day chart model |
| Large gamma strike | $850 | Heaviest put-strike gamma below price (20,178 puts open across expirations) |
| Bottom of implied range (Oct 23) | $809.15 | Lower edge of the straddle-implied move |
| Swing support | $804 | Nearest structural support below the implied range |
| Gamma flip (estimate) | ≈ $750 | One rough estimate of the level below which market-maker hedging tends to accelerate selling rather than cushion it |
| 200-day average | $717.84 | MU is still 22% above it; the long-term uptrend is intact |
Positioning and unusual flow
Dealer gamma (estimate). Market makers hedge the options they've sold. Under one common but unverified assumption, the chain-wide positioning sits in a negative-gamma regime, where their hedging tends to amplify moves rather than dampen them. The October 23 expiration on its own shows the same negative estimate, so it applies to this window.
The same estimate puts the gamma flip far below, near $750. Spot sits about 15% above that flip, which is unusually far above it for MU. Treat both figures as rough. The practical takeaway is that the positioning offers no strong pinning force near current prices.
Flow worth noting:
- October 23 $900 calls. 7,656 contracts traded and open interest rose by 719, about $14.0 million in premium. These are traders buying a bounce back to the old floor by Friday.
- October 19 $895 calls. 5,812 contracts traded against only 97 open beforehand, about 60× turnover. These are cheap, very short-dated lottery tickets on a Monday snap-back.
- November 20 $800 puts. 9,447 contracts traded, about $23.3 million in premium. This was the single largest money flow of the day and deliberate downside insurance a month out, about 9% below spot.
Into Friday's expiration, the $900 calls expiring that day traded 86,414 contracts and finished worthless. That expiration's $910 max pain was never reached; it is settled history.
3 · Technical check
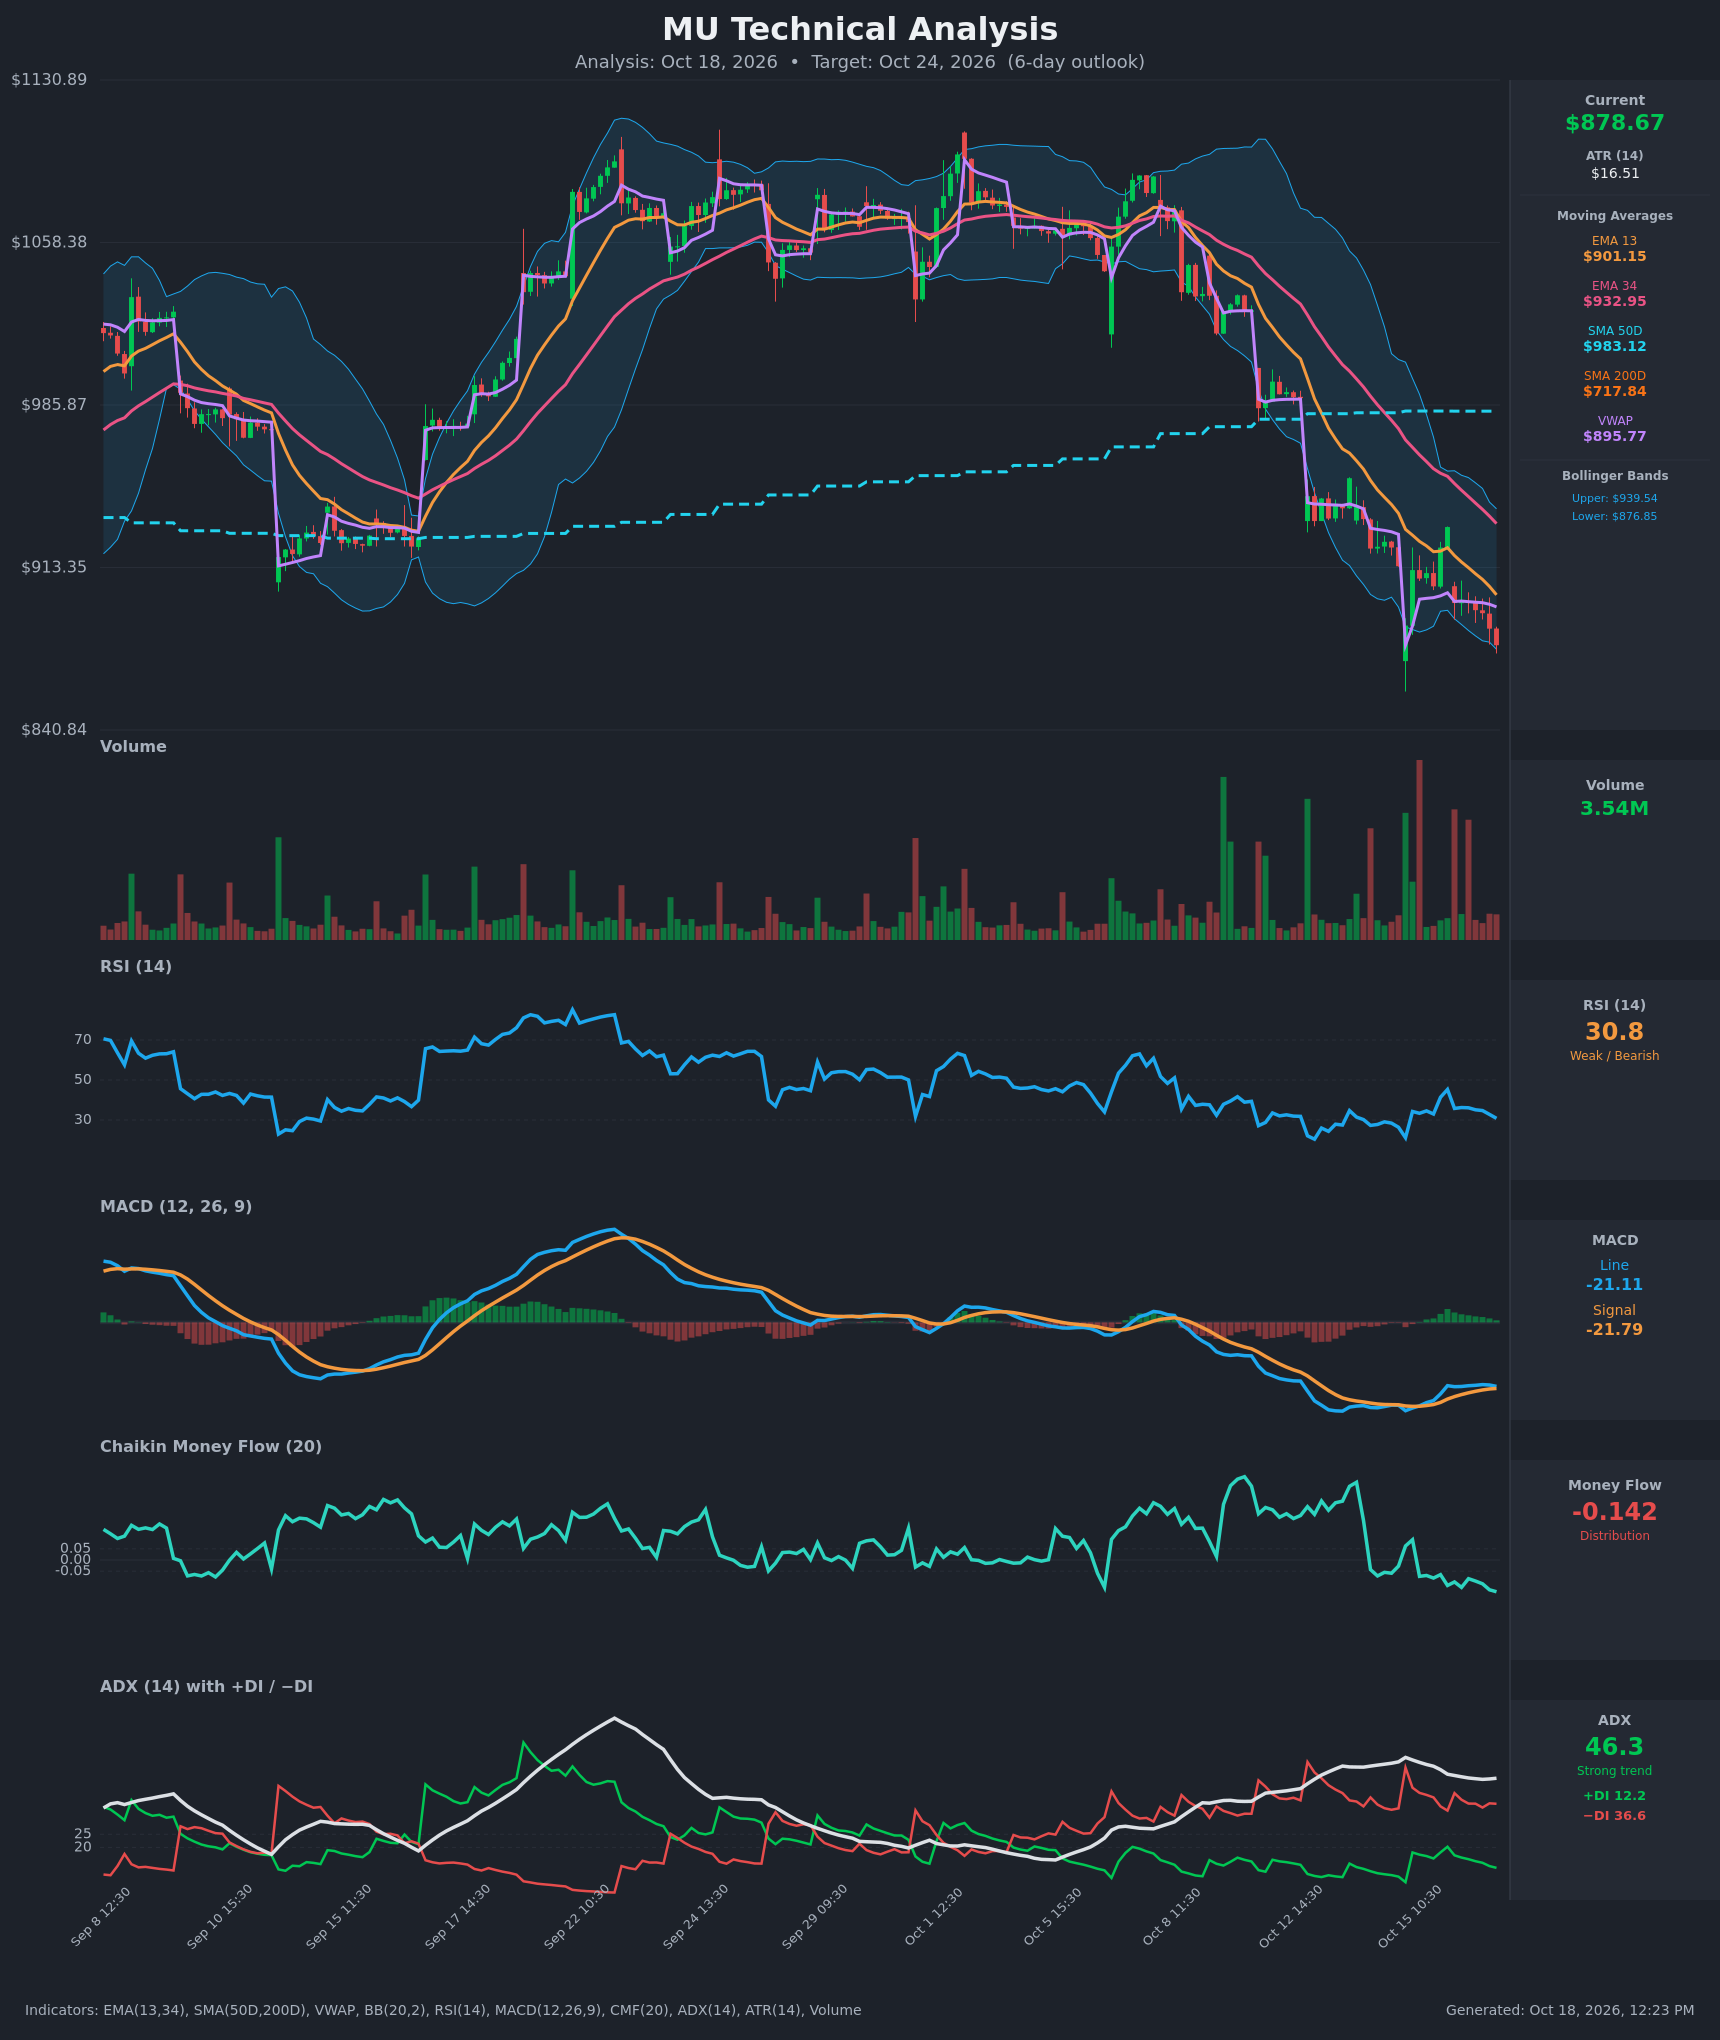
3-day report (target date October 21).
- Bearish, targeting $862 with a $843–$890 range.
- Its key levels are support at $858 and resistance at $895.77.
- Against the October 21 implied range of $821.36–$936.32, the direction matches our tilt and the target sits inside the range. That confirms the options read.
- Its most decisive reading is a very strong established downtrend: trend strength 46.3, with sellers' directional pressure triple buyers'. Money-flow is also deeply negative, at −0.142.
5-day report (target date October 23).
- Also bearish, targeting $866 with a $845–$905 range.
- It names support at $860, and its dominant scenario is invalidated on a close above $910.
- It sits well inside the $809.15–$948.53 implied range, so it confirms as well.
- Both reports flag an oversold reading and a fading counter-trend momentum cross as bounce risk. That matches the call buying we see in the October 19–23 expirations.
Model vs. Market: The options market implies $809.15–$948.53 into October 23; the 5-day technical model targets $866. The models aren't calling for a bigger drop than options price, just a modest drift lower inside a wide band. That argues for selling overhead call premium rather than buying aggressive puts.
The confirming TA nudged strike selection. The bear call spread's short strike sits at $910, matching the 5-day model's invalidation line. The condor's short put sits at $840, near the models' downside extension.
Full technical write-ups: 3-day report → · 5-day report →
4 · Three ways the next five sessions can go
If MU reclaims the $900 put wall and pushes toward the call wall ($940): A close back above $900 puts the stock back on top of its heaviest put and gamma strike, which would read as the floor being restored. Max pain at $920 and swing resistance at $924.88 sit in the path. The $940 call wall caps the October 23 positioning, and the implied range tops out at $948.53. This is the scenario that invalidates our tilt.
If MU drifts between $858 and $900: This is the "lost floor becomes ceiling" case. Rallies toward $889.63–$900 meet resistance, and the stock churns in the range the chart models describe. The upward pull of the $920 max pain is weak this far away, especially with a negative-gamma estimate offering little pinning force. Overhead call premium decays in this case.
If MU breaks below $858 and the $850 gamma strike: The chart models' extension targets near $840–$845 come into play, then the $809.15 lower edge of the implied range and $804 swing support. The negative-gamma estimate suggests hedging could add to the move rather than cushion it. Spot sits unusually far above the ~$750 flip estimate for this name, though, so that most fragile zone is still distant.
5 · Three defined-risk structures
Prices are end-of-day midpoints as of October 16, 2026. All structures are hypothetical unless flagged as an entered position. Verify live prices before trading; these will be stale by the open.
If you lean bearish: $910/$930 bear call spread
Credit-spread reminder: you collect premium up front and keep it if MU stays below the short strike at expiration.
- Trade: Sell the Oct 23 $910 call, buy the Oct 23 $930 call
- Credit: $5.58 ($14.625 − $9.05) · Max profit: $557.50 · Max loss: $1,442.50 · Break-even: $915.58
- Why it fits: The short strike sits above the $900 put wall (now overhead), the $902.60 swing pivot, and the 5-day model's $910 invalidation. The 70th-percentile premium over delivered movement means you're selling options that are currently pricing more movement than MU has delivered. Because the near-term move is fighting a flat two-month trend, a short five-session window suits this trade better than a longer one.
- Makes sense only if: MU keeps failing below $900 early in the week.
- Invalidated if: MU closes above $900
- Managing it: Close at about 50% of the credit (near $2.79). Exit on any close above $900 rather than waiting for $910 to be tested. Don't hold into the final afternoon of October 23 if MU is within $10 of the short strike.
- Liquidity note: The $910 calls traded 25¢ wide and the $930 calls 20¢ wide, so fills should be easy.
- Analyze this position →
If you expect the range to hold: $820/$840/$920/$940 iron condor
Iron condor reminder: you sell a put spread below and a call spread above, collecting two credits, and profit if MU finishes between the short strikes.
- Trade: Sell the Oct 23 $840 put, buy the $820 put, sell the $920 call, buy the $940 call
- Credit: $9.10 (put side $13.20 − $8.65 = $4.55; call side $11.575 − $7.025 = $4.55) · Max profit: $910 · Max loss: $1,090 · Break-evens: $830.90 and $929.10
- Why it fits: The long call sits on the $940 call wall and the short call on $920 max pain. The short put is just below the chart models' $843–$845 range floors. It sells premium that has run modestly rich versus delivered movement.
- Makes sense only if: You expect MU to move less than the ±$69.69 the market prices. The short strikes are only about $39 below and $41 above spot.
- Invalidated if: MU closes below $840 or above $920
- Managing it: Take profits at 40–50% of the credit. If one side's short strike is breached on a close, close the whole condor rather than defending it. Exit by the morning of October 23 regardless.
- Liquidity note: The legs traded 15¢ to 30¢ wide (the $840 puts the widest at 30¢), so slippage is minor.
- Analyze this position →
If you lean bullish: $880/$920 bull call debit spread
Debit-spread reminder: you pay up front and profit if MU rises above your break-even by expiration, with gains capped at the short strike.
- Trade: Buy the Oct 23 $880 call, sell the Oct 23 $920 call
- Debit: $15.88 ($27.45 − $11.575) · Max profit: $2,412.50 · Max loss: $1,587.50 · Break-even: $895.88
- Why it fits: This is the counter-trend case. It targets $920 max pain and mirrors the heavy Oct 23 $900 call buying. The low IV rank (11.1) keeps the cost of owning calls modest in absolute terms.
- Makes sense only if: MU holds $858 and reclaims $900. That is the oversold-bounce scenario both chart models flag as their second-most-likely path.
- Invalidated if: MU closes below $858
- Managing it: Take profits near $30 of spread value. Cut at a loss of about half the debit or on a close below $858. Exit by the close of October 22 if MU is still below $895.88.
- Liquidity note: The $880 calls traded 30¢ wide and the $920 calls 15¢ wide, both tight.
- Analyze this position →
If none of these: no trade
Premium looks modestly rich versus delivered movement, but there are three good reasons to stand aside rather than sell it:
- The richness is two days old and thin. It is only about 3.5 vol points, after two weeks near zero.
- The absolute price of options is low. IV rank 11 means you're collecting less premium than at almost any point in the past year.
- The setup is gap-prone. MU just gapped down five sessions in a row, and the negative dealer-gamma estimate means hedging may amplify moves. Gaps are exactly what hurt short-premium positions.
The directional lean is also only a tilt, with fresh call buying in the shortest expirations pushing back. If you can't size a $1,000–$1,600 max loss comfortably, waiting for MU to either reclaim $900 or break $858 gives a cleaner signal.
6 · Quick FAQ
What is MU's expected move this week? About ±$69.69 (±7.93%) into the October 23 expiration, a $809.15–$948.53 range, per straddle pricing as of the October 16 close.
Is MU expected to go up or down over the next week? Options positioning as of October 16 leans bearish: put open interest, put-heavy volume, and steep skew all built during a 14.6% drop. That is a read of what traders have done, not a forecast. The actionable map is the $809.15–$948.53 range, the $900 ceiling, and $850–$858 support.
Are MU options expensive right now? IV rank is 11.1/100, so option prices are lower than about 89% of the past year's readings. They are running about 3.5 vol points above the movement MU has actually delivered, which is richer than 70% of this stock's recent readings. That makes them cheap in absolute terms but modestly rich versus realized movement.
Where is MU's biggest options support and resistance? For October 23, the call wall is $940 and the put wall is $900. MU closed below the put wall, so $900 now acts as overhead resistance, with $850 the heaviest put-gamma strike below.
What invalidates this week's read? A close above $900.
Methodology & disclosures. Data: end-of-day options-chain snapshot for MU, 2026-10-16, generated 2026-10-18T12:23:06.346Z. Prices shown are midpoints and will differ from live markets. Momentum/positioning scores and volatility-premium comparisons are descriptive measurements of past option flow and past price movement — not investment advice, signals, forecasts, or guarantees. All trade structures are hypothetical. Every structure shown has a defined maximum loss; you can lose the entire max-loss amount. Options involve substantial risk and are not suitable for all investors.