MU Options Are Pricing a $67 Move Into September 25 — But the Chain's Biggest Call Wall Sits Below the Stock
Micron's options market implies a $948.55–$1083.05 range into the September 25 expiration, yet the heaviest call open interest for that date sits at $1,000 — below Friday's close. Here's what the positioning says and three defined-risk ways to trade it.
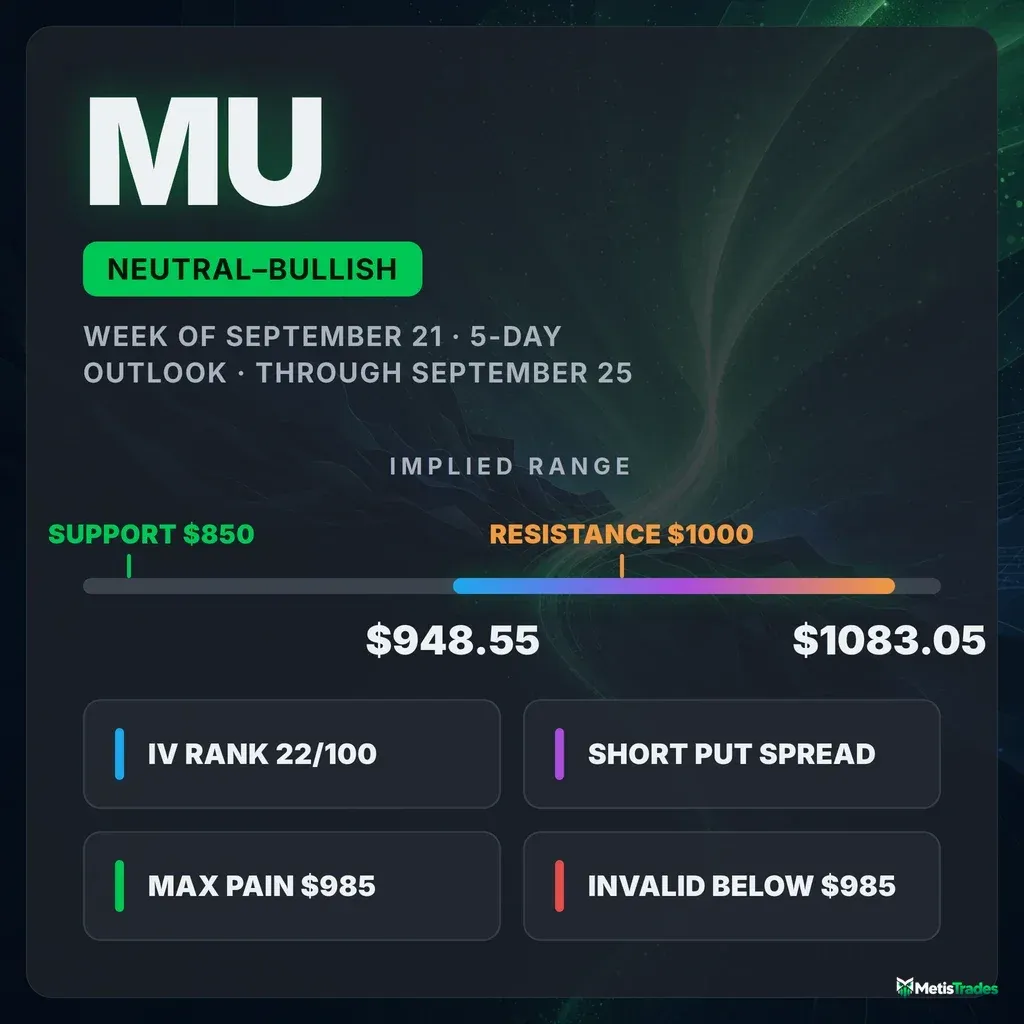
The options market implies a $948.55–$1,083.05 range into the September 25 expiration; here's what's driving it and three defined-risk ways to trade it.
Published Sunday, September 20, 2026 · Data as of Friday, September 18 close
Explore the live MU options data in the Detailed Options Analyzer →
Quick answer
| Item | Answer |
|---|---|
| Market bias | Neutral-bullish (slightly bullish) |
| Options-implied range (into September 25) | $948.55 – $1,083.05 (±6.62%, or ±$67.25 around the $1,015.80 close) |
| Major support | $850.00 — the September 25 put wall (the nearer floors are max pain at $985.00 and the 20-day average at $959.60) |
| Major resistance | $1,000.00 — the September 25 call wall, which sits below Friday's close |
| Max pain (September 25) | $985.00 |
| Dealer gamma regime (estimate) | Positive — hedging tends to dampen moves; flip level ≈ $910 |
| Volatility condition | Falling — IV rank 21.6/100 · premium rich: options priced about 6.7 vol points above delivered movement (earnings-inflated) |
| Next earnings | September 28, after close — three days after the September 25 expiration |
| Technical check | Confirms (bullish, 3-day and 5-day chart models) |
| Best-fitting strategy | Short put spread expiring before the report |
| Analysis invalidated if | MU closes below $985.00 |
1 · What matters today
Micron closed Friday, September 18 at $1,015.80 after a 4.16% five-session run, and the options flow behind that move leans bullish: put open interest is draining while call open interest builds, and short-dated sentiment is the firmest it has been in two weeks. Our read of the chain lands at slightly bullish. The awkward detail is overhead structure: the strike with the most call contracts held open for the September 25 expiration is $1,000 — the stock has already traded straight through its own ceiling, and the pull of max pain at $985 sits below price too. Options price a $948.55–$1,083.05 range for the next five days. Both chart models agree with the direction but see a much narrower path. A close below $985 kills the read.
2 · What the options market is pricing
What changed over the past week
The five-session tape was violent in both directions — a 7.10% gap down on September 14, a 3.02% gap up on September 17 — and the stock still finished 4.16% higher. The positioning shifted with it. Put open interest relative to call open interest collapsed to 0.46 from a seven-day average of 0.82: for every call contract held open there are now just 0.46 puts, where a week ago there were more than four puts for every five calls. In Friday's session alone call open interest grew by 35,906 contracts while put open interest shed 25,081. Put volume relative to call volume ran at 0.52 against a 0.64 seven-day average, and total option volume was 1.69 times its 20-day norm — traders showed up, and they showed up on the call side.
The single biggest build in a still-tradeable contract was the October 2 $1,000 calls, where open interest jumped 8,335 to 11,602 on 3,114 contracts and roughly $18.6 million of premium. For context on the week that just ended: into Friday's expiration the September 18 $1,000 calls traded 141,319 contracts and about $212.7 million of premium — settled history now, but it tells you where the crowd was fixated. Implied volatility kept drifting lower through all of it, down 0.75% on the day and 1.12% over five sessions. The short- and medium-term trend reads both point up, which is one clause of confirmation rather than a story; the more interesting wrinkle is that the last flagged inflection in this name was a bearish turn on September 14, and the flow has reversed hard enough since to overwhelm it.
Expected move
Into September 25, the options market is pricing a move of ±6.62%, or about ±$67.25 around the $1,015.80 close — that's the move derived from what at-the-money straddles cost, and it frames the $948.55–$1,083.05 range in the table above.
| Expiration | Implied move | Range around $1,015.80 |
|---|---|---|
| September 21 | ±3.03% | $985.02 – $1,046.58 |
| September 25 (this outlook) | ±6.62% | $948.55 – $1,083.05 |
| September 28 | ±7.22% | $942.46 – $1,089.14 |
| October 2 | ±12.84% | $885.37 – $1,146.23 |
The rungs step up gently through September 28 and then nearly double at October 2 — that jump from ±7.22% to ±12.84% is not a gradual accumulation of time, it is the earnings report landing between the two dates.
Volatility
At-the-money implied volatility across the chain is 58.96% — the market's estimate of how much MU moves, baked into option prices. Its IV rank is 21.6 out of 100, meaning option prices are cheaper than roughly 78% of the past year's readings, and the percentile read is lower still. The direction is down: IV is off 0.75% on the day, 1.12% over five sessions and 25.2% over 30, and sits below both its 30-day average of 63.8% and its 90-day average of 86.5%. The front-month read is unavailable today (Friday was an expiry day), so the usual comparison of near-dated against longer-dated pricing is off the table. Worth noting the ladder does not slope smoothly: the September 25 expiration itself carries a 47.8% at-the-money read, above the 43.6% at September 28 and far below the 65.6% at October 2.
Against this stock's own recent history, delivered movement has actually been unusually quiet — 20-day realized volatility of 52.2% is well below MU's own norm — even though the last five sessions have been moving faster than the trailing month, which is also unusual for this name. Quiet month, noisy week.
Premium rich or cheap. The gap between what options are priced for and what MU has actually delivered — when it's positive, option sellers have been collecting more than realized movement cost them — currently sits at about 6.7 vol points, richer than roughly 83% of this stock's own recent readings. That gap narrowed to under 2 vol points on September 14 and has widened back out since; no sign flip, just a swing. Normally IV rank of 21.6 paired with an 83rd-percentile premium over delivered movement would be a straightforward argument for collecting premium rather than owning it. Here it comes with a caveat: some of that richness is the market pre-pricing the September 28 report, not free premium. Sell it if you like the structure, but do not tell yourself you found an edge.
Earnings on the calendar
Micron reports September 28, after the close — eight days out from the export, and three days after the September 25 expiration this outlook is built around. That placement is exactly why the expected-move ladder steps from ±7.22% at September 28 to ±12.84% at October 2: the September 28 contracts expire before the report, the October 2 contracts span it, and the chain prices the difference. Options expiring on or before September 28 carry no gap exposure to the release. On the record, the last four reports all came in above expectations, most recently $24.89 per share against an expected $20.98.
Skew and sentiment
The 25-delta skew reading — how much more (or less) puts cost than calls the same distance from the stock price — did not compute on Friday, so there is no same-day number to quote. The baseline is informative on its own: over the prior 60 days the median has run at about −1.7 vol points, meaning puts have been cheaper than calls in this name, and the trailing 14-day average is steeper still at about −3.1 points. That is the opposite of the usual crash-protection premium; traders here have been paying up for upside, not downside.
Sentiment in short-dated options reads "broadly bullish" across every maturity bucket. The 0–7 day bucket scores +49 and the 7–30 day bucket +48, against seven-day averages of +24 each — today's front-end reading is double its own recent norm. Under the hood, delta-weighted volume in the front bucket runs +0.59 to the call side and matched-contract open interest grew about 11% net toward calls. The call-tilted volume pace is itself running well above what's normal for MU, as is the one-day jump in call open interest. This is not hedging; it's positioning.
The key levels map
| Level | Price | Why it matters |
|---|---|---|
| Swing resistance | $1,089.29 | Next clustered pivot above the implied range |
| Top of implied range (Sep 25) | $1,083.05 | Upper rail of the options-priced move |
| Second-heaviest call strike (Sep 25) | $1,050.00 | 2,248 contracts, essentially all built Friday — the first real overhead pile |
| Swing resistance | $1,038.01 | Recent pivot cluster; just above the 5-day chart target |
| Spot / Friday's close | $1,015.80 | Reference for every figure above and below |
| Swing support | $1,011.77 | Nearest pivot beneath price |
| Call wall (Sep 25) | $1,000.00 | Heaviest call open interest for the date (3,719) — and the whole chain's heaviest call strike too (53,303). Price is already above it |
| Swing support | $990.53 | Pivot cluster from the mid-September base |
| Max pain (Sep 25) | $985.00 | The price where the most option value expires worthless — expirations sometimes gravitate toward it |
| Second-largest gamma strike (chain) | $980.00 | Heavy combined open interest; also the put wall at the Oct 2 and Oct 16 dates |
| 20-day moving average | $959.60 | Price sits 5.86% above it |
| Bottom of implied range (Sep 25) | $948.55 | Lower rail of the options-priced move |
| 50-day moving average | $927.26 | Price sits 9.55% above it |
| Gamma flip estimate | $910.00 | Estimate only — below this, one rough model suggests market-maker hedging amplifies selling rather than cushioning it |
| Put wall (whole chain) | $900.00 | 17,645 contracts — the chain-wide downside pile |
| Put wall (Sep 25) | $850.00 | Heaviest put open interest for this date (3,053), but 16% below spot — an unusually distant floor |
Note the disagreement worth flagging: the two walls line up at $1,000 on the call side, but the chain-wide put wall ($900) and the September 25 put wall ($850) are $50 apart. For this five-day window, the $850 figure is the one that belongs to the expiration — and its distance from spot is itself the message. There is no meaningful concentration of downside protection anywhere near the current price.
Positioning and unusual flow
Dealer gamma is estimated as positive both for the chain as a whole and for the September 25 expiration specifically, which under the standard assumption means market-maker hedging tends to dampen moves rather than accelerate them. Read that as an estimate, not observed inventory — it is built from raw gamma and open interest under an assumed sign convention.
Three live flows stood out. The September 25 $1,050 calls traded 4,508 contracts and created 2,248 of open interest from nothing in a single session, clearing the top of their peer volume group — a straight bet on the extension continuing into this expiration. Second, the October 2 $1,000 calls added those 8,335 contracts of open interest on $18.6 million of premium, positioning that deliberately spans the earnings date. Third, on the other side, the September 25 $1,010 puts turned over 2,445 contracts against just 59 held open — near-the-money, same-week protection or a short-dated fade, bought after the run.
3 · Technical check
Both chart models read bullish. The 3-day model targets $1,028.00 by September 23 with a projected band of $997.00 to $1,038.00; the 5-day model targets $1,032.00 by September 25 with a band of $985.00 to $1,045.00. Both cite the same evidence — a trend-strength gauge that has climbed from the high teens to 42 in seven sessions with upside direction heavily dominant, a fresh momentum crossover with an expanding histogram, and money-flow readings deep in accumulation territory — and both flag the same risk, a 14-day RSI at 76 pressing the upper volatility band.
Against the options read, that confirms: same direction, and the $1,032 target sits comfortably inside the $948.55–$1,083.05 options-implied range. What differs is magnitude. The chart model's 5-day band is $60 wide; the options market's is $134.50 wide. The market is pricing roughly twice the dispersion the chart model expects — which is consistent with the premium-richness read above, and with a report three days past the expiration.
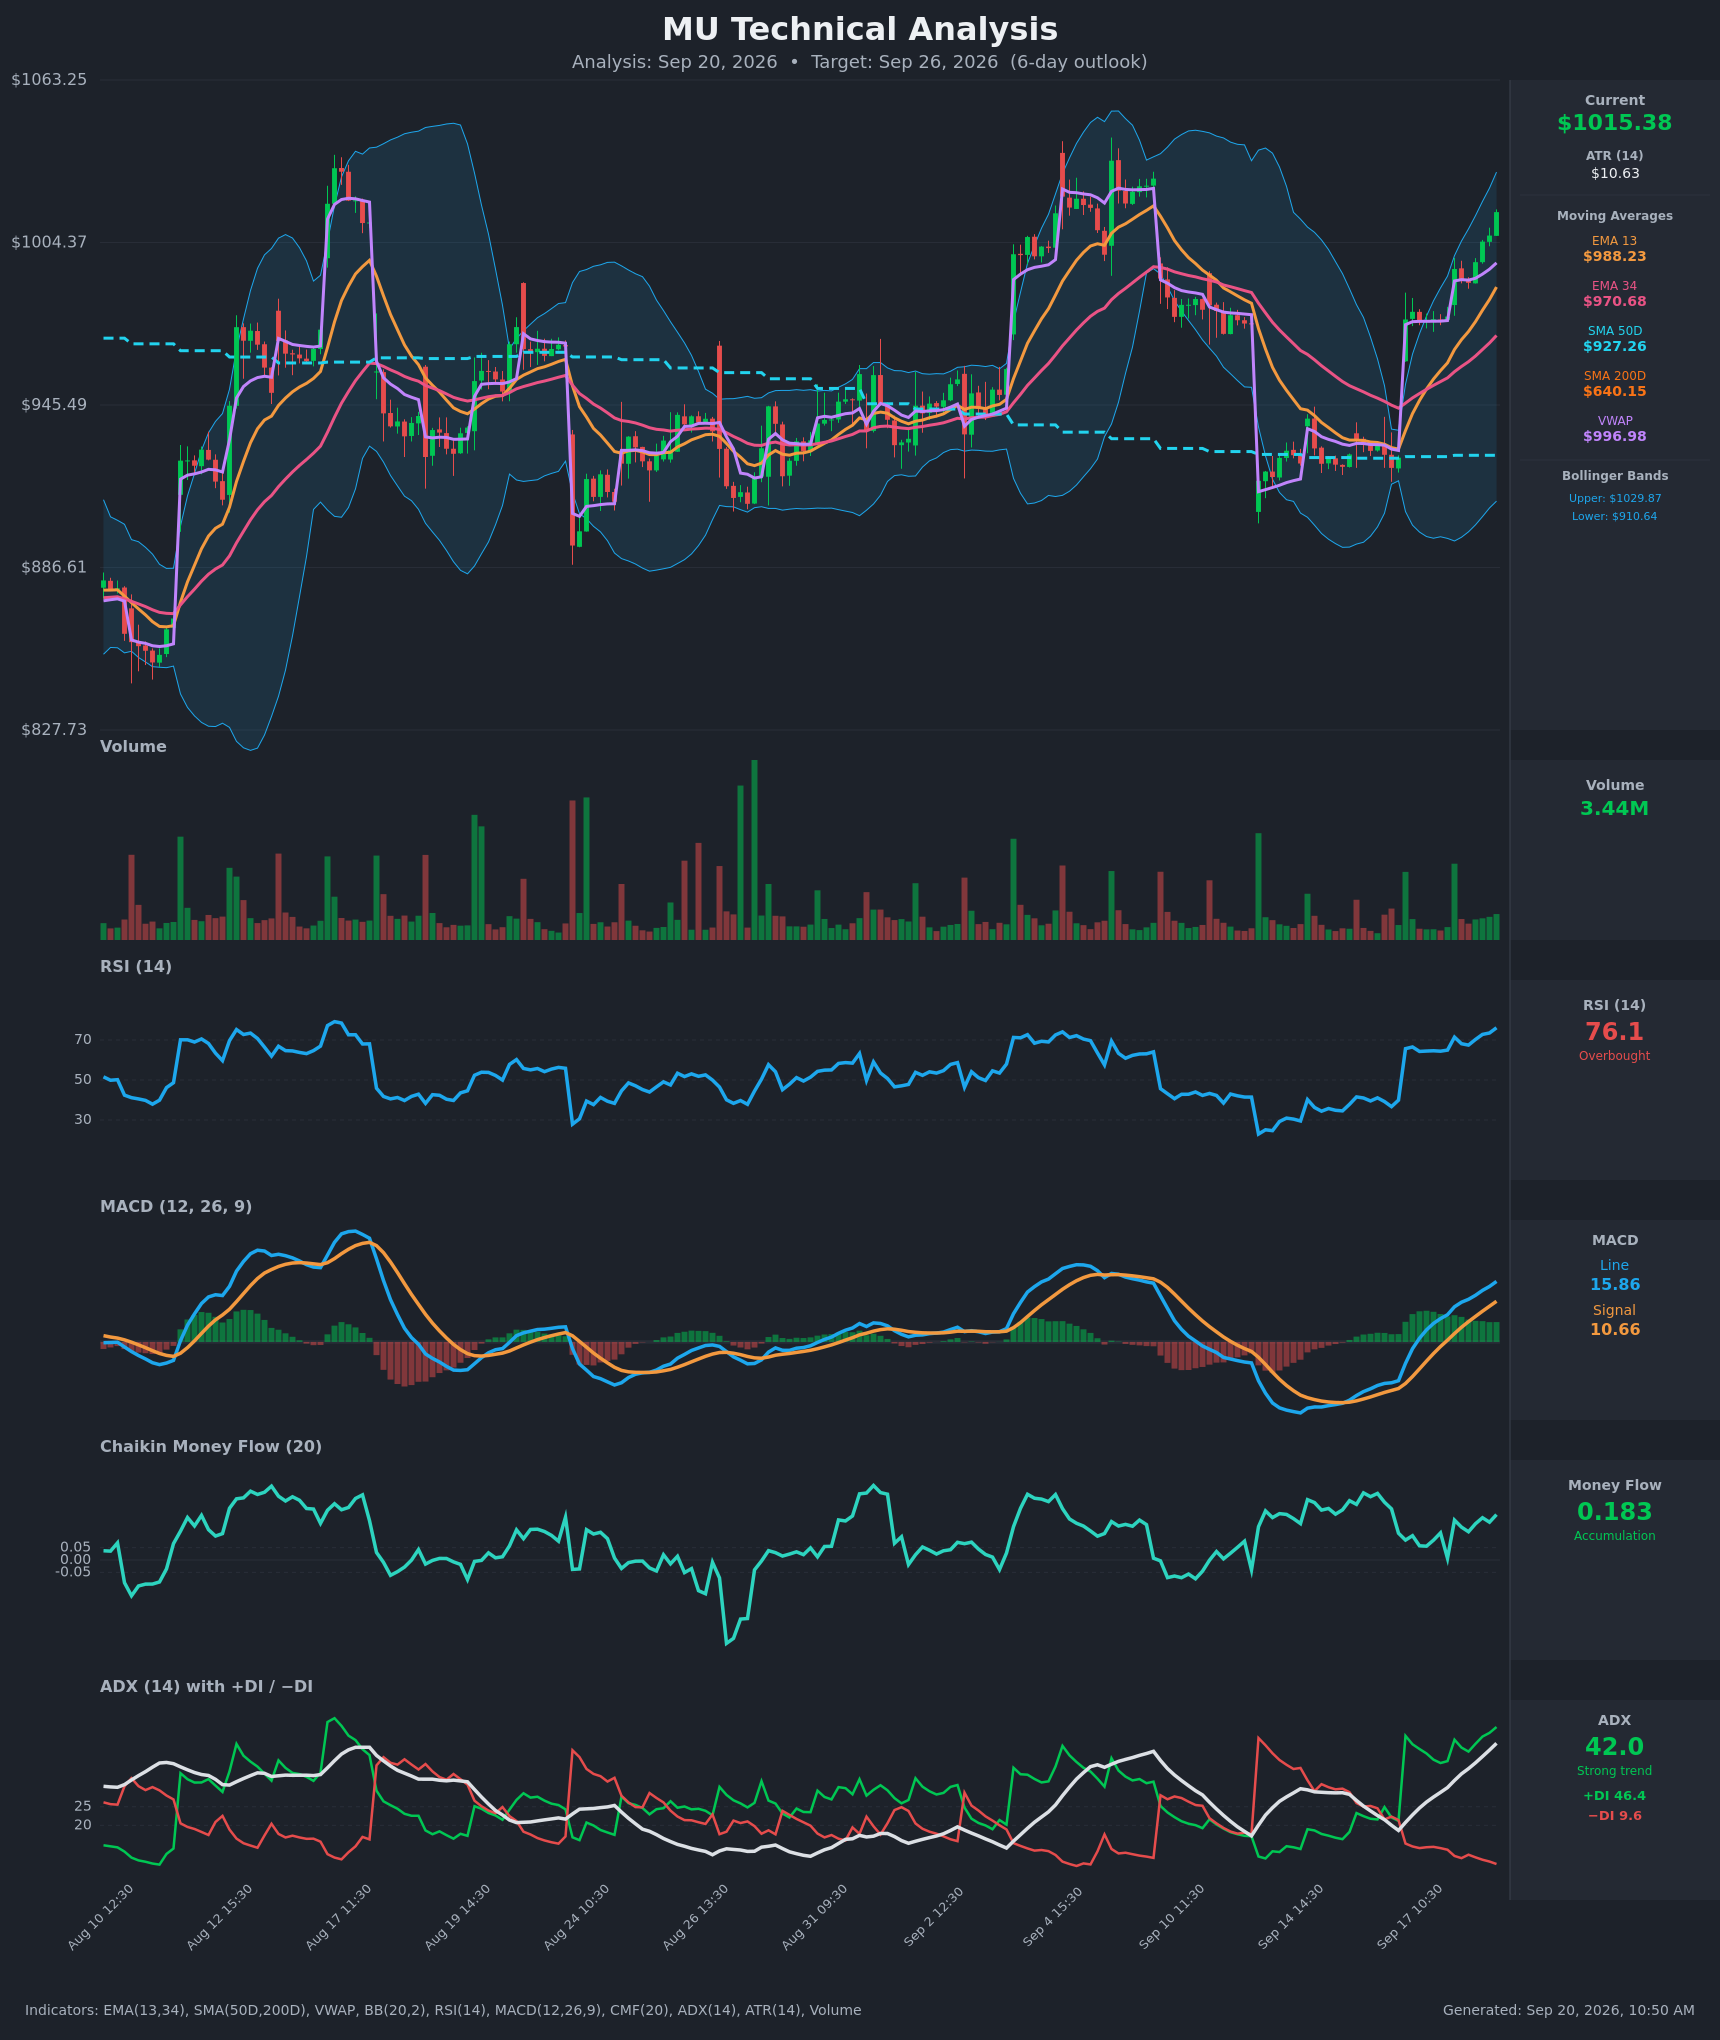
Model vs. Market: The options market implies $948.55–$1,083.05 into September 25; the 5-day technical model targets $1,032.00 inside a $985.00–$1,045.00 band. The gap isn't about direction — it's about width, and it argues for structures that get paid for the market's wider view rather than ones that need a big move to work.
The technical read nudged the short call strike in the range structure below to $1,050, just above the chart model's $1,045 upper band, and left the put side where the options data put it.
Full technical write-ups: 3-day report → · 5-day report →
4 · Three ways the next five days can go
If MU holds above the $1,000 call wall: the heaviest call open interest for this expiration is already behind price, which removes the usual overhead brake — that pile now sits underneath as a magnet rather than a barrier. The next real concentration is the $1,050 strike, where 2,248 contracts appeared Friday. Above that, positioning thins quickly toward the $1,083.05 upper rail of the implied move.
If MU drifts between $985 and $1,050: this is the pin case, and the positioning supports it. Max pain for September 25 sits at $985, dealer gamma is estimated positive (hedging dampens rather than amplifies), and expiring open interest is densest at $1,000 and $1,050. A five-day chop inside that corridor is the single most mechanically supported outcome in the data, even though the flow lean points higher.
If MU breaks back below $985: there is remarkably little options structure to catch it. The expiration's own put wall is all the way down at $850, and the nearest genuine reference points are the 20-day average at $959.60 and the swing cluster at $924.88. Spot currently sits about 10% above the $910 gamma flip estimate — comfortably on the supportive side, and further from it than is typical for this name — but below that estimate, one rough model suggests market-maker hedging turns from cushioning selling to amplifying it.
5 · Three defined-risk structures
Prices are end-of-day midpoints as of Friday, September 18. All structures are hypothetical. Verify live prices before trading — these will be stale by the open.
If you lean bullish: September 25 $980/$970 put credit spread
- Trade: Sell the September 25 $980 put, buy the September 25 $970 put. You collect a credit up front and keep all of it if MU stays above $980 at expiration.
- Credit: $2.73 · Max profit: $272.50 · Max loss: $727.50 · Break-even: $977.28
- Why it fits: The short strike sits below max pain ($985), below the $1,000 call wall the stock has already cleared, and about 3.5% under spot against a ±6.62% implied move. Put open interest is draining across the chain and short-dated sentiment reads +49 — you are selling the side the flow is abandoning.
- Makes sense only if: you accept a 27% return on risk for a seven-day hold and are comfortable that the nearest real downside structure is far away.
- Invalidated if: MU closes below $985.00.
- Earnings exposure: Expires three days before the September 28 report — no earnings-gap risk.
- Managing it: close at roughly 50% of max credit; exit regardless by September 24 rather than carrying gamma into the final session; if MU closes through $980, close rather than hope. The short-term trend is running hot against a flat 50-day read, which argues for taking profits early rather than pressing.
- Liquidity note: the $980 puts traded 55¢ wide and the $970 puts 60¢ wide; the long leg is marginally over 5% of its mark, so work the spread as a package rather than legging in.
- Analyze this position →
If you expect the range to hold: September 25 $970/$980/$1,050/$1,060 iron condor
- Trade: Sell the $980 put and buy the $970 put; sell the $1,050 call and buy the $1,060 call, all September 25. You collect a credit and keep it if MU finishes between $980 and $1,050.
- Credit: $5.30 · Max profit: $530 · Max loss: $470 · Break-evens: $974.70 and $1,055.30
- Why it fits: It monetises exactly the gap the Model vs. Market callout describes — the options market is pricing a range roughly twice as wide as the chart model's. Dealer gamma is estimated positive for this expiration, max pain sits at $985, and the short call is shaded just above the 5-day model's $1,045 upper band.
- Makes sense only if: you believe the ±6.62% implied move is generous relative to what MU actually delivers in five days. It is not a free lunch: the short strikes sit inside the implied range, so this is a bet on the range, not a high-probability drift trade.
- Invalidated if: MU closes outside $980–$1,050 before you can manage it, or breaks below $985 with momentum.
- Earnings exposure: Expires three days before the September 28 report — no earnings-gap risk. Also note that the richness in the premium you are collecting is partly the market pre-pricing that report, not pure overpricing of five-day movement.
- Managing it: close at 40–50% of max credit; roll or close the tested side rather than defending both; hard exit by September 24.
- Liquidity note: the $1,050 calls traded 85¢ wide and the $1,060 calls 70¢ wide, both roughly 6% of mark — this is a four-legged fill on a $1,000 stock, so expect to give up a little.
- Analyze this position →
If you lean bearish: September 25 $1,040/$1,050 call credit spread
- Trade: Sell the September 25 $1,040 call, buy the September 25 $1,050 call. You collect a credit and keep it if MU stays below $1,040.
- Credit: $3.05 · Max profit: $305 · Max loss: $695 · Break-even: $1,043.05
- Why it fits: This is the fade of an overextension. Max pain at $985 and the entire near-term max-pain ladder sit below spot, both chart models flag an RSI of 76 pressing the upper band, and the short strike sits above the 5-day model's $1,032 target while the long strike sits on the freshly-built $1,050 call pile.
- Makes sense only if: you are explicitly fading the article's own lean — the flow read is bullish, so this trade is betting that the mechanical pull toward max pain beats the positioning.
- Invalidated if: MU closes above $1,038.01, the swing pivot just under the short strike.
- Earnings exposure: Expires three days before the September 28 report — no earnings-gap risk.
- Managing it: close at ~50% of max credit; exit on any close above $1,038; do not hold a tested short call into the final session.
- Liquidity note: the $1,040 calls traded 55¢ wide (about 3% of mark, the tightest of the three structures) and the $1,050 calls 85¢ wide.
- Analyze this position →
If none of these: no trade
There is a real case for sitting out. The premium looks rich — about 6.7 vol points above delivered movement, richer than 83% of this stock's own recent readings — but a scheduled report three days past the expiration is precisely the reason it looks that way, and selling volatility because it is elevated for a known reason is how income traders get run over. Meanwhile the directional evidence is a two-session flow reversal layered on top of a 7% gap down and a 3% gap up within five sessions. If your process needs either a clean premium edge or a clean trend, neither is unambiguously here — and a 22 IV rank means the absolute dollars in these credits are modest relative to the tape's demonstrated willingness to move 7% overnight. Waiting until after September 28 costs you nothing but a week.
6 · Quick FAQ
What is MU's expected move this week? ±$67.25, or ±6.62%, into the September 25 expiration — a $948.55 to $1,083.05 range around the $1,015.80 close, per straddle pricing as of Friday, September 18.
Is MU expected to go up or down over the next five days? Options positioning as of September 18 leans slightly bullish — put open interest is draining while call open interest builds, and short-dated sentiment is running at double its recent norm — but that's a read of what traders have done, not a forecast. The actionable map is the $948.55–$1,083.05 range with $1,000 above as the cleared call wall and $985 as the level that changes the picture.
Are MU options expensive right now? Two lenses. An IV rank of 21.6/100 says option prices are lower than about 78% of the past year's readings. On top of that, they're running about 6.7 vol points above the movement MU has actually delivered — richer than roughly 83% of this stock's own recent readings. Net: cheap versus the year, rich versus recent delivered movement — and part of that richness is the market pre-pricing the September 28 report, so treat it as compensation for a known event rather than free premium.
When is MU's next earnings report? September 28, after the close — after the September 25 expiration but before October 2, which is why the implied move jumps from ±7.22% to ±12.84% between those two rungs.
Where is MU's biggest options support and resistance? For the September 25 expiration, the put wall is $850.00 and the call wall is $1,000.00 — and since the stock closed at $1,015.80, it has already traded above that call wall.
What invalidates this read? A close below $985.00.
Methodology & disclosures. Data: end-of-day options-chain snapshot for MU, 2026-09-18, generated 2026-09-20T10:50:51Z. Prices shown are midpoints and will differ from live markets. Momentum/positioning scores and volatility-premium comparisons are descriptive measurements of past option flow and past price movement — not investment advice, signals, forecasts, or guarantees. Earnings dates and reported results are from the data provider's earnings feed as of 2026-09-20T10:50:51Z; report dates can change. All trade structures are hypothetical. Every structure shown has a defined maximum loss; you can lose the entire max-loss amount. Options involve substantial risk and are not suitable for all investors.