NBIS Options Outlook: Will the $130 Put Wall Hold Into November 13?
After a 41% slide in a month, NBIS options price a ±$31.16 move into the November 13 expiration, with the stock sitting on its $130 put wall. Here is what the positioning shows, where the levels are, and three defined-risk ways to trade it.
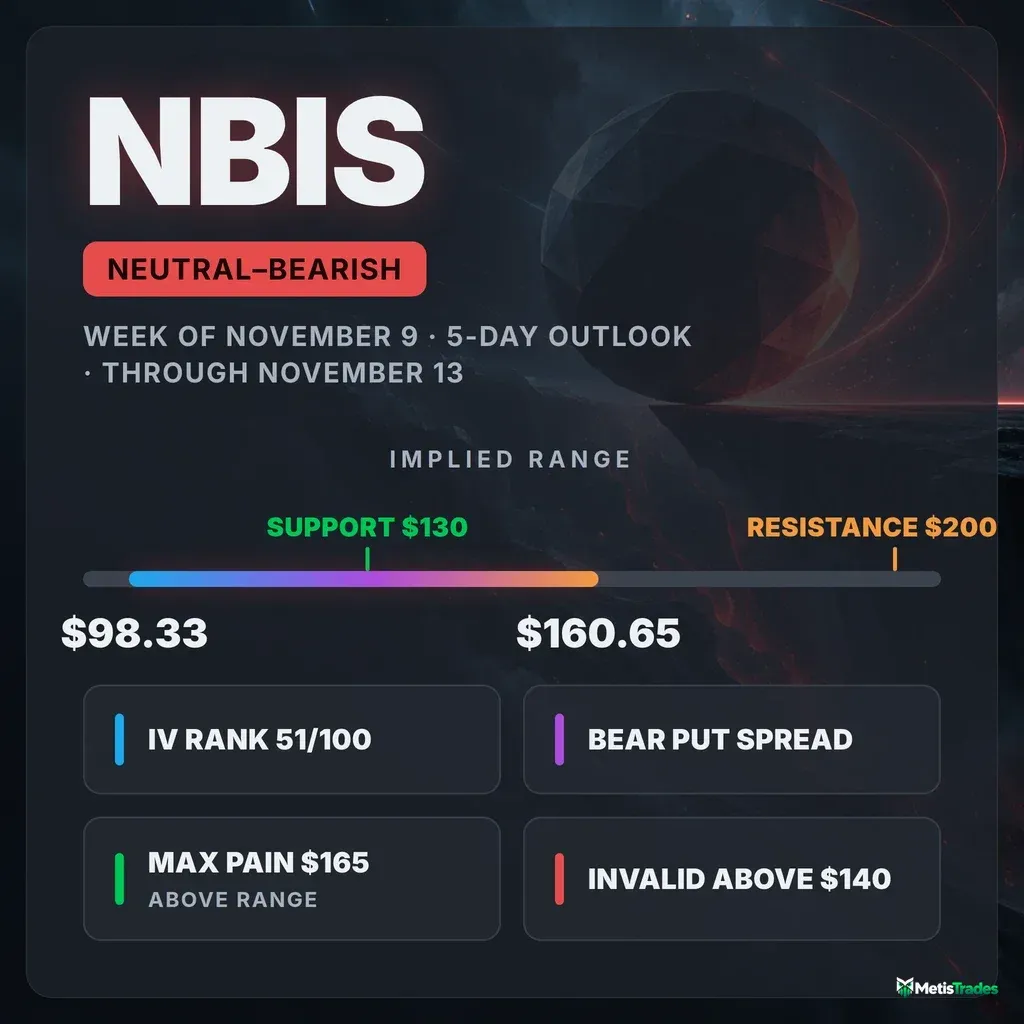
The options market implies a $98.33–$160.65 range into November 13. Below: what's driving that range, where the levels sit, and three defined-risk ways to trade it.
Published Sunday, November 8, 2026 · Data as of Friday, November 6, 2026 close
Explore the live NBIS options data in the Detailed Options Analyzer →
Quick answer
| Item | Answer |
|---|---|
| Market bias | Slightly bearish (neutral with a bearish tilt) |
| Options-implied range (into November 13) | $98.33 – $160.65 (±24.06%, about ±$31.16) |
| Major support | $130 (November 13 put wall) |
| Major resistance | $200 (November 13 call wall); the nearer overhead level is $140 (the whole chain's heaviest put strike) |
| Max pain (November 13) | $165 |
| Dealer gamma regime (estimate) | Negative: hedging tends to amplify moves. Flip level ≈ n/a (no flip strike could be estimated) |
| Volatility condition | Rising. IV rank 51/100 · premium fair: options are priced ~2.8 vol pts above delivered movement |
| Technical check | Confirms (bearish; 3-day target $126.00, 5-day target $125.50) |
| Best-fitting strategy | Bear put debit spread (November 13 $130/$120), only while NBIS stays below $140 |
| Analysis invalidated if | NBIS closes above $140 |
1 · What matters today
NBIS closed at $129.49 on Friday, November 6. That is down 16% in five sessions and about 41% in a month. Our read of the options market is slightly bearish. Traders are paying unusually high prices for downside protection, and our flow gauges lean negative across every horizon except the very front week.
The options market is pricing a move of about $31 either way by November 13, a $98.33–$160.65 range. That is a wide band for a five-day window. The stock is sitting almost exactly on its most important level: $130, the strike with the most open put contracts for that expiration.
A close back above $140 would undo the bearish lean. The chart-based technical model also leans lower, targeting $125.50 for November 13.
2 · What the options market is pricing
What changed this week
This was a week of capitulation followed by a partial bounce. NBIS went from $141.39 on November 2 to $120.37 on November 5. It then gapped up 8.5% Friday to close at $129.49, still down 16% over five sessions.
Implied volatility (IV) is the market's estimate of how much NBIS will move, baked into option prices. It rose 17.5% over the five days and is up 61% over the past 30 sessions, even after easing 8% on Friday's bounce.
The put/call open-interest ratio compares open put contracts to open call contracts. It sits at 1.40, meaning 1.4 puts are held open for every call, against a 14-day average of 1.26. Protection has been accumulating steadily.
The single biggest open-interest change on Friday was in the January 15, 2027 $75 puts. Open contracts jumped from 1,088 to 11,106, a 10,018-contract build in deep crash insurance roughly 42% below spot. Nearer in, the November 20 $110 puts added 4,018 contracts (to 5,659) and the December 18 $110 puts added 2,222.
The short-, medium- and long-term trend reads all agree, and all point down: price is off 16% over the past week, 41% over the past month, and 41% over the past two-plus months.
Expected move
The expected move is the move the options market is pricing in, derived from what straddles cost. For the November 13 expiration it is ±24.06%, or about ±$31.16, which puts the implied range at $98.33 – $160.65 around the $129.49 snapshot price.
| Expiration | Implied move | Range around $129.49 |
|---|---|---|
| November 13 | ±24.06% | $98.33 – $160.65 |
| November 20 | ±28.3% | $92.84 – $166.14 |
| December 4 | ±33.77% | $85.76 – $173.22 |
The ladder is heavily front-loaded. The first week alone prices about ±24%, while each later week adds only a few points. The market sees the nearest days as the most dangerous stretch.
Volatility
The 30-day ATM IV is 120.48%. That is well above its 30-day average of 89.3% and its 90-day average of 104.8%, so volatility has been expanding.
IV rank shows where today's IV sits versus the past year. It is 51/100, meaning IV is roughly halfway between its 52-week low and high. By a second measure, today's IV is higher than about 89% of the past year's daily readings. The year's extremes stretch the range, but on most days options were cheaper than now.
Term structure means comparing option prices across different expiration dates. The front-month read is unavailable today (expiry day), but each expiration's own ATM IV tells the story:
- November 13 options carry about 173.8% IV.
- December 18 options carry about 114%.
- February 2027 options carry about 101%.
That inverted shape, with near-dated options far pricier than longer-dated ones, is typical of stress.
Realized volatility has also sped up. NBIS's past-week movement is running about 39% faster than its 20-day pace, which is unusually high for this stock compared with its own recent history.
Is premium rich or cheap? The volatility risk premium is the gap between how much movement options are priced for and how much NBIS has actually delivered. When it's positive, option sellers have been collecting more than realized movement cost them. Today options are priced about 2.8 vol points above the roughly 117.7% NBIS has delivered over 20 days.
The VRP percentile shows where today's gap sits versus this stock's own recent readings. At 39/100, the gap is richer than only about 39% of them, which is about typical. That gap was nearly 19 points on Thursday. It collapsed Friday as the November 5 plunge entered the realized-volatility window and IV eased.
The combination of IV rank 51 and a 39th-percentile premium gives neither buyers nor sellers of premium a clear edge. It favors defined-risk spreads, where you buy and sell options together, over outright premium bets.
Skew and sentiment
Skew means puts and calls the same distance from the stock price don't cost the same. When puts are pricier, traders are paying up for crash protection. Right now puts are running 19.8 vol points over calls, against a 60-day norm of −2.0 points, when calls were actually slightly pricier. The 7-day average skew is 9.3 points, so the steepening has accelerated. Traders are paying an unusual premium to protect against a further drop.
The put/call volume ratio measures how much put activity there is relative to calls; above 1 means puts dominate. Friday's reading was 0.91, against a 14-day average of 0.74. That is unusually put-heavy for this name.
One counter-current stands out. Net new open interest leaned hard to calls on Friday: about 37,300 new call contracts versus about 5,000 new puts. That is well above NBIS's normal pace of call building. It is concentrated in the nearest expiration. Short-dated sentiment, our read of the 0–7 day options, scores a strongly positive +96, but that reading rests on a single input: fresh call open interest at the November 13 strikes.
Every bucket further out leans bearish. The 7–30 day bucket reads −31, with puts about 21.5 vol points richer than usual. The longer buckets sit near −56. Our summary label is a "Bullish Blow-Off": a leveraged front-end chase in weekly calls while everything beyond the first week is positioned defensively.
Our broader flow composite reads −54. That is softer than Thursday's −87 but near its 7-day average of −53, and it is worse than the 14-day average of −41. Bearish pressure has intensified over two weeks rather than faded.
The key levels map
| Level | Price | Why it matters |
|---|---|---|
| 50-day moving average | $201.70 | Where the stock was trading on average two months ago; marks the size of the breakdown |
| Call wall (November 13) | $200 | Largest pile of open calls for the week (3,770 contracts); far outside the implied range |
| Swing resistance | $193.74 | Prior pivot cluster |
| Whole-chain call wall | $180 | Heaviest call strike across all expirations (19,289 contracts) |
| 200-day moving average | $178.38 | Long-term trend line, far overhead |
| Max pain (November 13) | $165 | Where the most option value would expire worthless; sits above the implied range |
| 20-day moving average / swing resistance | $165.23 / $164.31 | Overlaps max pain; the one-month trend line |
| Top of implied range (November 13) | $160.65 | Upper edge of the priced one-standard-deviation move |
| Largest-gamma strike (whole chain) | $150 | Most hedging sensitivity concentrated here |
| Swing resistance | $149.48 / $145.80 | Heuristic pivot levels from late-October trading |
| Pre-plunge close (November 4) | $141.52 | Start of the November 5 gap down |
| Whole-chain put wall / 2nd-largest gamma | $140 | Heaviest put strike overall (21,576 contracts); this article's kill switch |
| Put wall (November 13) | $130 | The week's biggest put open interest (2,662) and heaviest dollar volume; spot sits right on it |
| Chart-model support | $118 | November 5 low area, per the technical report |
| Bottom of implied range (November 13) | $98.33 | Lower edge of the priced move |
| 52-week low | $73.52 | Annual floor; the new $75 January put build sits just above it |
The November 13 walls ($200 call / $130 put) differ from the whole chain's heaviest strikes ($180 call / $140 put). For this window, the expiration's own levels apply. The $140 level matters as overhead supply.
Positioning and unusual flow
Market makers hedge the options they've sold. In the current regime, their hedging tends to amplify moves rather than dampen them. One rough estimate puts dealer gamma negative, both across the whole chain and for the November 13 expiration specifically. Under that assumption, a push off $130 in either direction could be accelerated rather than cushioned.
A gamma flip level is the price below which market-maker hedging tends to accelerate selling rather than cushion it. No such level could be estimated today, so there is no nearby "safe side" to point to.
Three non-expired flows stood out on Friday:
- November 13 $130 puts: 2,178 contracts traded, about $2.76 million in premium, on the week's put wall. Defense of, or bets against, that exact level.
- November 13 $125 puts: 1,612 contracts against just 342 open, about $1.66 million. That is nearly five times the existing open interest, so this was fresh downside buying just below spot.
- November 13 $130 and $140 calls: 1,276 and 1,619 contracts, roughly $1.55 million and $1.30 million. The $130 calls last printed at the ask, meaning buyers were paying up. This is the bounce-chasing flow behind the hot front-week sentiment reading.
3 · Technical check
Both technical reports lean bearish, and both targets sit inside the options-implied range. That is a Confirms classification on each horizon.
The 3-day model targets $126.00 by November 11, within a projected $123.00–$131.00 band. The 5-day model targets $125.50 by November 13, within $122.00–$132.50. Both reports read the tight post-gap trading as a bear-flag consolidation. In the dominant scenario, a close below $127.40 opens $121–$125, and the scenario is invalidated by a close above $131.50 (3-day) or above the 34-period EMA near $136.85 (5-day).
The two most decisive indicator reads are these. Money-flow (CMF) is stuck at −0.101, still showing distribution through the bounce. Trend strength (ADX 35.4) is fading from 49 but still has sellers in control. In short, the reports see a downtrend that is slowing, not reversing.
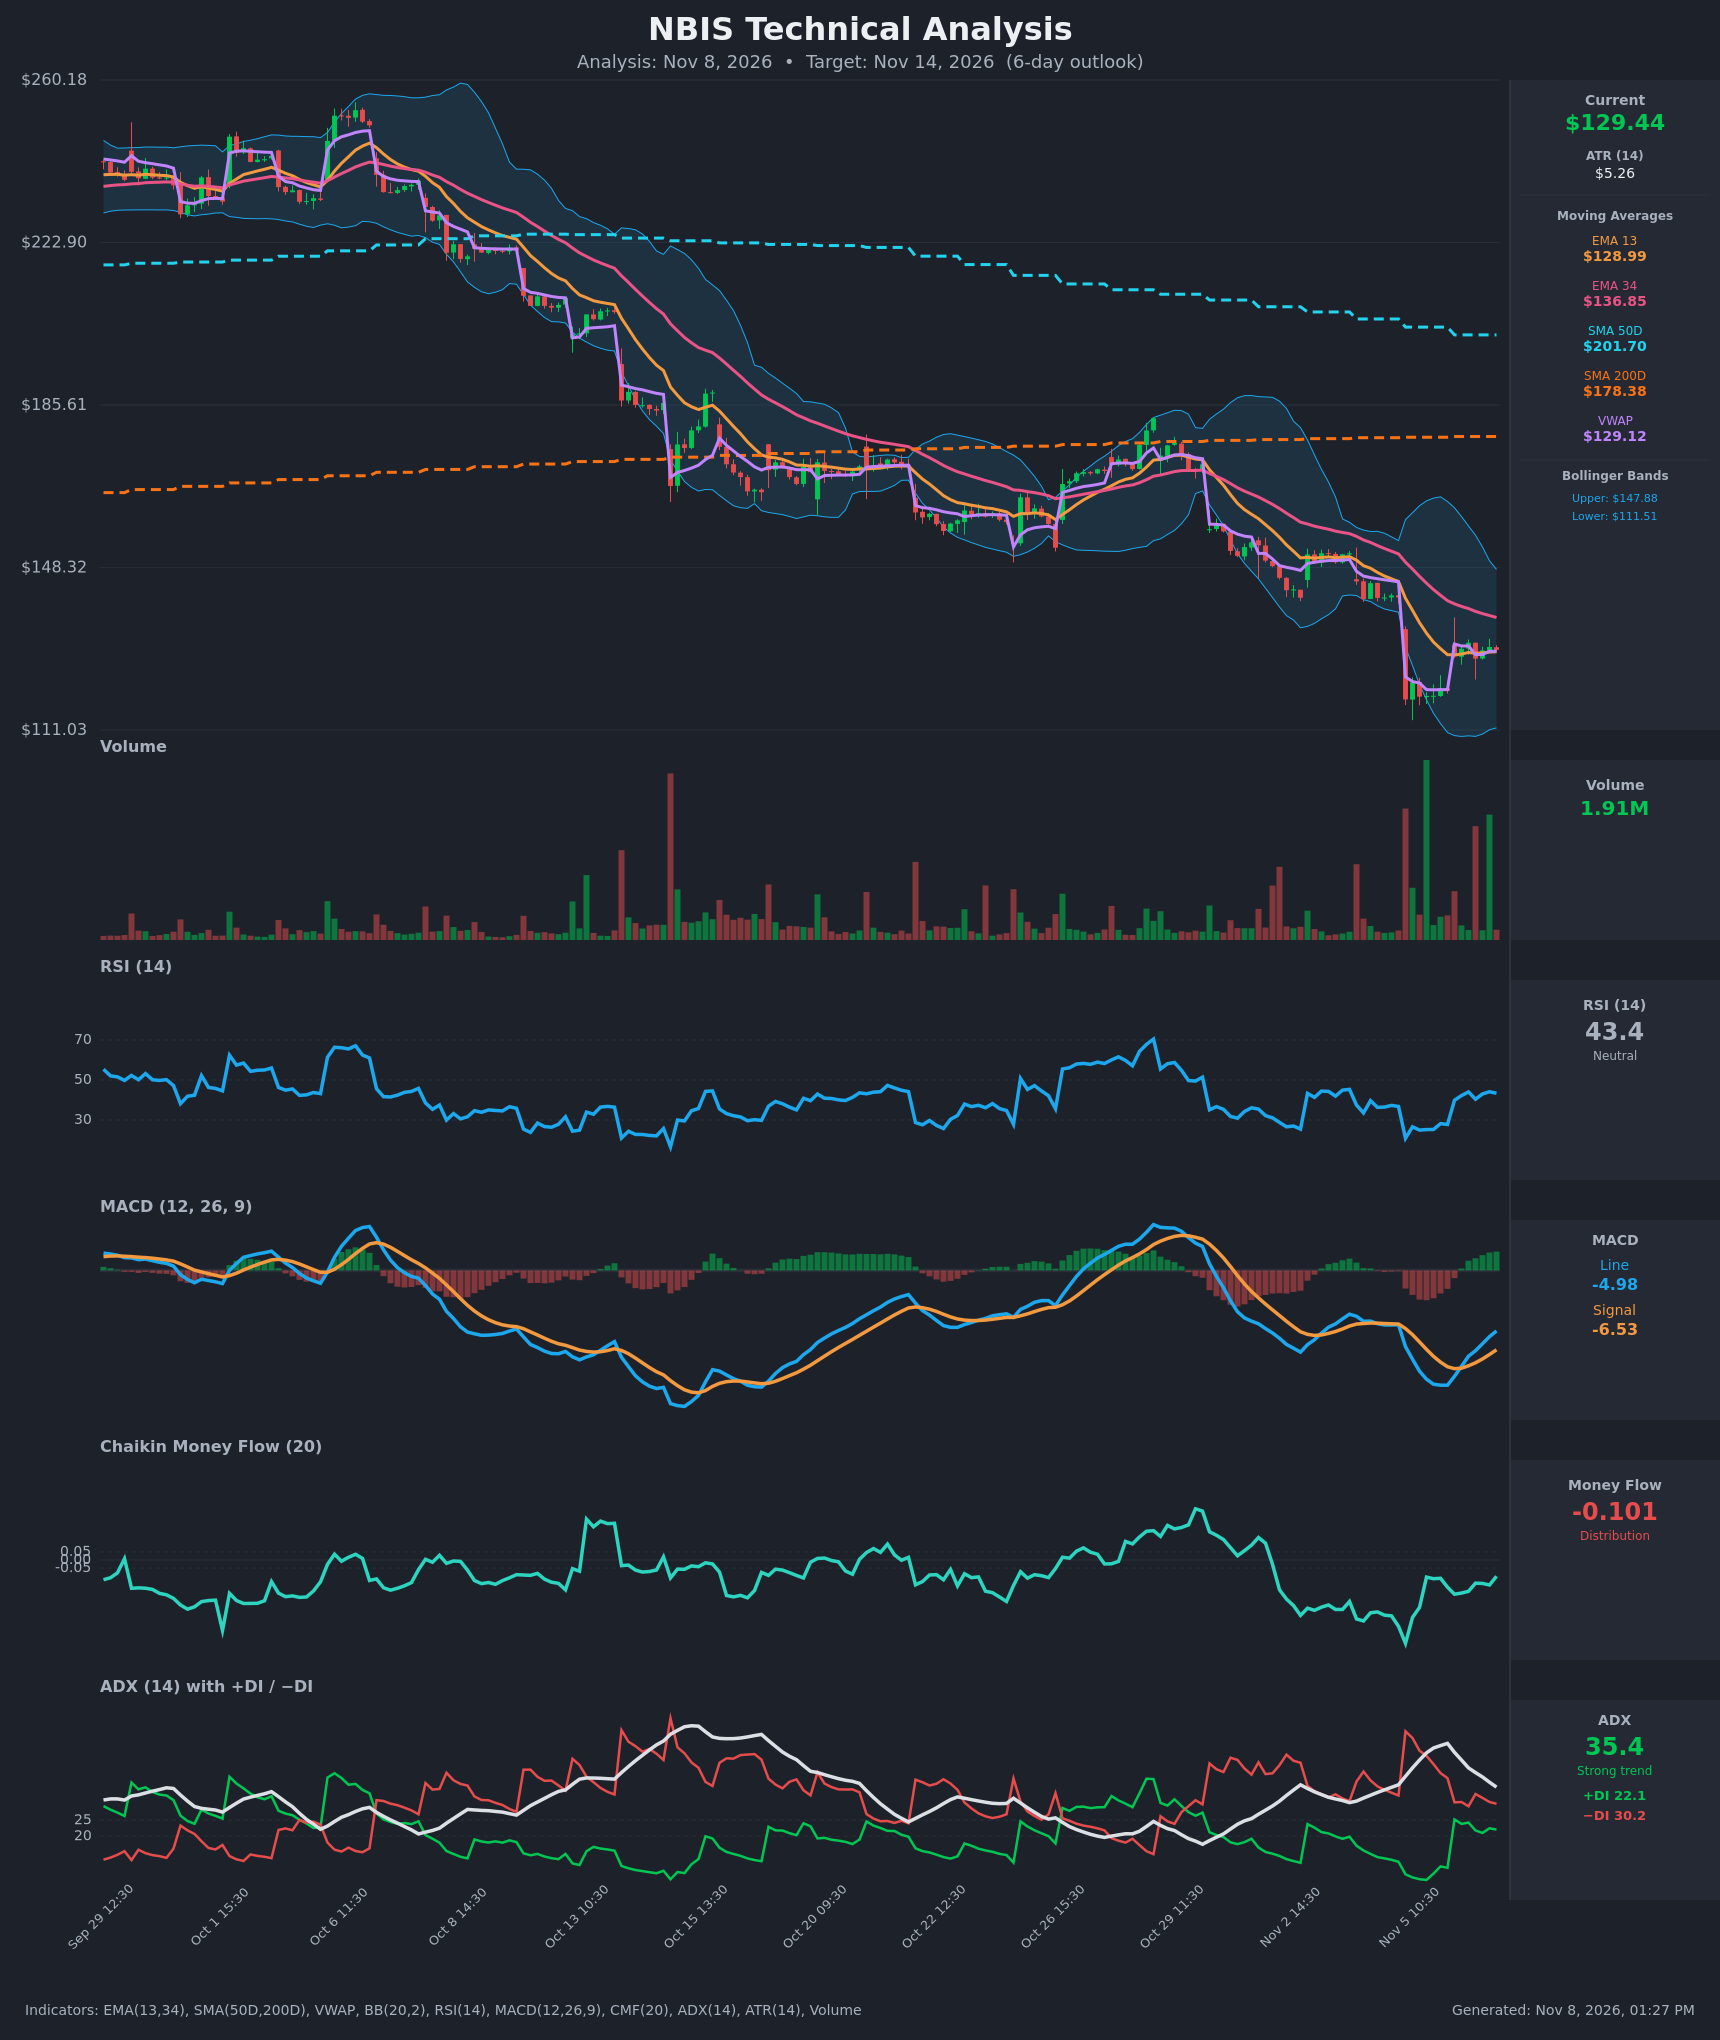
Model vs. Market: The options market implies $98.33–$160.65 into November 13. The 5-day technical model targets $125.50. The chart model expects a modest drift lower, while options are priced for a far bigger swing either way. If NBIS breaks decisively out of the $127–$131 consolidation, the options market's wider pricing gets vindicated. If it grinds, the chart model's narrower view does.
The TA confirmation is why the bearish structure below targets a break-even near $125.65, close to the model's $125.50–$126.00 targets. It is also why the range structure centers on $130.
Full technical write-ups: 3-day report → · 5-day report →
4 · Three ways the next five days can go
If NBIS reclaims $140 and runs toward the call wall ($200): $140 is the whole chain's heaviest put strike and second-largest gamma strike, and it sits just under the November 4 pre-gap close of $141.52. A close above it would mean the front-week call chase overpowered the defensive positioning further out. In a negative-gamma regime, hedging could add fuel toward the $145.80–$149.48 swing levels. The $200 November 13 call wall is too far away to matter this week.
If NBIS drifts between $130 and $140: This is the pin case. The $130 put wall carries the most open interest and the heaviest dollar flow of the week, and expiring open interest often pulls price toward such strikes. Max pain at $165 sits above the implied range, so it is unlikely to act as a magnet. The $130 strike is the more realistic gravitational center into November 13.
If NBIS breaks below the put wall ($130): This is the acceleration case. Puts are already priced at a steep premium, and one rough estimate suggests dealers are positioned to amplify moves. A break could travel quickly toward the chart model's $118 support, with the fresh $125 put buying showing traders already positioned for it. No gamma-flip estimate exists, so there is no nearby level where hedging would be expected to start cushioning the fall.
5 · Three defined-risk structures
Prices are end-of-day midpoints as of November 6, 2026. All structures are hypothetical unless flagged as an entered position. Verify live prices before trading; these will be stale by the open.
If you lean bearish: bear put debit spread
A debit spread means you pay up front and profit if the stock moves in your direction, with both risk and reward capped.
- Trade: Buy the November 13 $130 put, sell the November 13 $120 put
- Debit: $4.35 ($12.675 − $8.325) · Max profit: $565 · Max loss: $435 · Break-even: $125.65
- Why it fits: Puts are 19.8 vol points richer than calls, versus a −2.0 norm. Buying one put and selling another offsets much of that richness. Momentum, the leading positioning read, and every bucket beyond the front week lean bearish. The break-even sits almost exactly on the chart models' $125.50–$126.00 targets.
- Makes sense only if: NBIS fails to hold the $130 put wall and the bear-flag consolidation resolves lower.
- Invalidated if: NBIS closes above $140.
- Managing it: Take profits at roughly 50–60% of max gain. With every trend horizon aligned lower there's no reason to rush, but with only five days on the clock, exit by November 12 rather than holding into expiration. A close above $134 is an early warning to cut size.
- Liquidity note: The $130 puts traded 45¢ wide (about 3.6% of mark), which is easy. The $120 puts were 55¢ wide (about 6.6% of mark), so work that leg with a limit order near mid.
- Analyze this position →
If you expect the range to hold: broken-wing iron butterfly at $130
An iron butterfly sells a put and a call at the same strike and buys protective wings on both sides. You collect a credit and keep the most if the stock pins near the center strike.
- Trade: Sell the November 13 $130 put and $130 call; buy the November 13 $117 put and $140 call
- Credit: $9.65 ($12.675 + $12.175 − $7.15 − $8.05) · Max profit: $965 (at $130) · Max loss: $335 (below $117); only $35 above $140 · Break-evens: $120.35 and $139.65
- Why it fits: $130 is the week's put wall and the heaviest-traded strike. The structure is built around the "drift between walls" case. The wider put wing reflects the downside lean, so the worst outcome is a collapse, and that loss is capped at $335.
- Makes sense only if: The $127–$131 consolidation the chart models describe holds through expiration, even though dealer positioning is estimated to amplify breaks.
- Invalidated if: NBIS closes below $120.35 or above $139.65, the structure's break-evens.
- Managing it: Close at 25–35% of max credit. Pin trades rarely pay in full, and negative gamma can turn a calm day into a breakout. Exit on any close outside $127–$133.
- Liquidity note: The $130 put and call were each 45¢ wide, and the $140 call 40¢ (about 5%). The $117 put was 50¢ wide (about 7%), so expect some slippage on that wing.
- Analyze this position →
If you lean bullish: bull call debit spread
- Trade: Buy the November 13 $130 call, sell the November 13 $140 call
- Debit: $4.125 ($12.175 − $8.05) · Max profit: $587.50 · Max loss: $412.50 · Break-even: $134.13
- Why it fits: It rides the same strikes where Friday's front-week call chase concentrated, and it caps the payoff at $140, the heavy overhead put strike. Calls are cheap relative to puts right now, so the long leg is the less-inflated side.
- Makes sense only if: The bounce off the November 5 low extends and NBIS clears the $131.50 consolidation top on rising volume.
- Invalidated if: NBIS closes below $120.37 (the November 5 close).
- Managing it: This trade fights a trend that is bearish on every horizon, so take profits early, around 50% of max gain. Close it if NBIS loses $127 again.
- Liquidity note: The $130 calls traded 45¢ wide (3.7%) and the $140 calls 40¢ wide (about 5%). Fills are fine.
- Analyze this position →
If none of these: no trade
Standing aside is a reasonable choice here. Premium is neither rich nor cheap versus delivered movement. Week-ahead options carry about 174% IV. Dealer hedging is estimated to amplify moves, and the stock just swung from $141 to $120 to $129 in three sessions. A ±$31 priced move means a single headline can blow through any strike in this article. If you can't watch a position daily, or a $435 loss on a five-day trade would sting, waiting for the $127–$131 consolidation to break first is a perfectly good strategy.
6 · Quick FAQ
What is NBIS's expected move this week? About ±$31.16 (±24.06%) into the November 13 expiration, a $98.33–$160.65 range per straddle pricing as of November 6.
Is NBIS expected to go up or down over the next week? Options positioning as of November 6 leans slightly bearish, driven by steep put skew, put-heavy volume, and bearish sentiment in every expiration past the first week. That is a read of what traders have done, not a forecast. The actionable map is the $98.33–$160.65 range and the $130 support and $140/$200 resistance levels.
Are NBIS options expensive right now? IV rank of 51/100 puts option prices about halfway through their 52-week range, and higher than about 89% of the past year's daily readings. They are running only about 2.8 vol points above the movement NBIS has actually delivered, richer than just 39% of its own recent readings. Premium is fair, not a giveaway for buyers or sellers.
Where is NBIS's biggest options support and resistance? For November 13, the put wall is $130 and the call wall is $200. Across all expirations, the heaviest strikes are $140 (puts) and $180 (calls).
What invalidates this week's read? A close above $140.
Methodology & disclosures. Data: end-of-day options-chain snapshot for NBIS, 2026-11-06, generated 2026-11-08T13:27:30.128Z. Prices shown are midpoints and will differ from live markets. Momentum/positioning scores and volatility-premium comparisons are descriptive measurements of past option flow and past price movement — not investment advice, signals, forecasts, or guarantees. All trade structures are hypothetical. Every structure shown has a defined maximum loss; you can lose the entire max-loss amount. Options involve substantial risk and are not suitable for all investors.