NBIS Options Are Pricing a ±$22.68 Move Into Friday — Positioning Leans Up, the Chart Model Leans Down
The options market implies a $201.87–$247.23 range for NBIS into the September 18 expiration, and the flow beneath it is unusually call-tilted. The chart models disagree — here's the full level map and three defined-risk ways to trade the gap.

The options market implies a $201.87–$247.23 range into the September 18 expiration; here's what's driving that read, where the levels sit, and three defined-risk ways to trade it.
Published Sunday, September 13, 2026 · Data as of the September 11, 2026 close
Explore the live NBIS options data in the Detailed Options Analyzer →
Quick answer
| Item | Answer |
|---|---|
| Market bias | Bullish |
| Options-implied range (into Sep 18) | $201.87 – $247.23 (±10.10%, or ±$22.68 around the $224.55 close) |
| Major support | $240.00 — the Sep 18 expiration's put wall (it sits above spot; the whole chain's heaviest put strike is $210.00) |
| Major resistance | $380.00 — the Sep 18 expiration's call wall (the whole chain's heaviest call strike is $250.00) |
| Max pain (Sep 18) | $230.00 |
| Dealer gamma regime (estimate) | Negative — in this regime market-maker hedging tends to amplify moves rather than cushion them; no flip level is computable in today's data |
| Volatility condition | Falling — IV rank 4/100 · premium thin: options are priced about 4 vol points below the movement NBIS has actually delivered |
| Technical check | Diverges (bearish, 3-day and 5-day chart models) |
| Best-fitting strategy | Sep 18 $227.50/$240 call debit spread |
| Analysis invalidated if | NBIS closes below $210.00 |
1 · What matters today
Options positioning in NBIS leans bullish into Friday, September 18 — but it leans bullish over a chart that just rolled over, and that disagreement is the story. Calls are priced about 3.6 vol points above equidistant puts (the opposite of the usual pay-up-for-crash-protection pattern), put open interest thinned sharply over the past week, and call-side sweeps dominated the peer-relative flow. The options market is pricing a ±$22.68 move — ±10.10% — into Friday, a $201.87 to $247.23 range around the $224.55 close. Max pain for that expiration sits at $230.00. The level that decides everything is $210.00: the strike with the biggest pile of open put contracts on the whole chain, just under the 50-day average at $211.68. Close below it and this read is wrong. Both chart models point lower over the same window, so treat the lean as defined-risk only.
2 · What the options market is pricing
What changed this week
NBIS is up 6.61% over the past five sessions and down 12.13% over the past twenty — and Friday itself was a reversal day: the stock gapped up 2.93% to open at $234.80 and closed at $224.55. The implied volatility story is a steady drain. At-the-money implied volatility — the market's estimate of how much NBIS will move, baked into option prices — sits at 76.7%, down 6.37% on the day, 1.37% over five sessions and 43.07% over thirty, against a 30-day average of 100.3% and a 90-day average of 114.8%. Positioning moved the other way from price: put open interest relative to calls has collapsed from a 14-day average of 1.22 to 0.95 today, meaning that for every call contract held open there are now 0.95 puts, versus 1.22 two weeks ago — traders have been closing downside protection, not adding it.
The single biggest fresh build among still-tradeable contracts is the Sep 18 $235 calls, where open interest jumped 3,446 contracts in one day to 3,681, with the Sep 18 $227.50 calls adding another 2,728. (Into Friday's now-settled expiration, the $250 calls added 4,063 contracts — history, not an actionable level.) One counterweight: day over day, new put open interest across the chain (+20,076) outpaced new call open interest (+9,867), so the flow is not one-sided.
The short- and long-term trend reads also disagree, and that is worth saying plainly: the past week's 6.6% pop runs against a market still down 12.1% over the past month, with the roughly two-and-a-half-month read flat. Near-term flow and the bigger trend are pointing in different directions, which is exactly the condition that argues for short-dated structures and early profit-taking rather than position trades.
Expected move
The move the options market is pricing in — derived from what at-the-money straddles cost — is ±10.10% into Friday, September 18. On a $224.55 close that is ±$22.68, or a $201.87 to $247.23 range. Here is the ladder:
| Expiration | Implied move | Range around $224.55 |
|---|---|---|
| Fri, Sep 18 (7 DTE) | ±10.10% | $201.87 – $247.23 |
| Fri, Sep 25 (14 DTE) | ±14.50% | $191.99 – $257.11 |
| Fri, Oct 2 (21 DTE) | ±18.54% | $182.92 – $266.18 |
| Fri, Oct 16 (35 DTE) | ±24.26% | $170.07 – $279.03 |
The rungs step up smoothly — roughly with the square root of time — with no hump anywhere in the ladder, which is what a chain with nothing scheduled inside it looks like.
Volatility
At-the-money implied volatility is 76.7% with an IV rank of 4/100 — where today's IV sits versus the past year, so 4/100 means option prices are cheaper than 96% of the past year's readings. The percentile read is even more extreme at 2.4. Implied volatility is below its own 30-day average (100.3%) and far below its 90-day average (114.8%), and it has fallen 43% in a month. The front-month read is unavailable today: the chain's nearest expiration was 0 DTE on the snapshot date, an expiry-day artifact rather than missing data.
Two "vs its own norm" readings are worth quoting — meaning compared against this stock's own recent history, not the broader market. NBIS's 20-day realized volatility, 80.9% annualized, is unusually low by its own standards; this is a name that has spent much of the year moving far more than that. At the same time, the 5-day-to-20-day realized ratio at 1.12 sits modestly above its norm — the last week has been slightly busier than the month behind it.
Premium rich or cheap. The volatility risk premium — the gap between how much movement options are priced for and how much NBIS has actually delivered — is currently negative by about 4 vol points (76.7% implied against 80.9% delivered over 20 days). When that gap is positive, option sellers have been collecting more than realized movement cost them; here they haven't. The gap sits at the 43rd percentile of this stock's own recent readings, i.e. thinner than most of them, because NBIS's normal state has been an even deeper discount. On the path: this gap ran between roughly −44 and −88 vol points for most of the past three weeks and jumped to roughly flat on September 10. That jump is mechanical, not a trader signal — August's enormous post-earnings gap day rolled out of the trailing 20-day realized window, and the realized leg fell accordingly. Put together, an IV rank of 4/100 and a negative premium over delivered movement favor owning premium this week rather than collecting it.
Skew and sentiment
Skew measures the fact that puts and calls the same distance from the stock price don't cost the same. In NBIS right now, the 25-delta call carries an 80.6% implied volatility against 77.0% on the 25-delta put — calls are 3.6 vol points richer than puts, against a 60-day median of 1.3 points. Traders are paying up for upside exposure, not for crash protection, and they are doing it more aggressively than this name's own recent norm. That is a complacency/chase signature, and it is the single largest bullish input in the flow.
The volume tells the same story. Put/call volume — how much put activity there is relative to calls, where above 1 means puts dominate — printed 0.59 on Friday, against a 7-day average of 0.63 and a 14-day average of 0.72. Peer-relative unusual flow was call-dominated (six call contracts cleared the unusual bar versus three puts), a call tilt that is well above typical for this symbol. Overall option volume, meanwhile, was only 0.90× its 20-day average, so this is a tilt within an ordinary tape, not a frenzy.
Sentiment across expiration dates is genuinely mixed: the 0–7 day bucket reads mildly put-leaning (−18, versus a 7-day average of +24 — it flipped negative only in the last two sessions), while the 8–30 day bucket reads solidly call-leaning at +36. The regime summary is "Mixed" — the front end wobbled while the next month held its bullish tilt.
The key levels map
| Level | Price | Why it matters |
|---|---|---|
| Call wall, Sep 18 expiration | $380.00 | The strike with the biggest pile of open call contracts at this expiration (13,285) — but it sits 69% above spot, so it is a leftover lottery-ticket strike, not a live ceiling this week |
| 52-week high | $299.86 | The close sits 25.1% beneath it |
| Whole-chain heaviest call strike | $250.00 | 22,476 calls open across all expirations; the top of Friday's implied range ($247.23) sits just under it |
| Put wall, Sep 18 expiration / largest gamma strike | $240.00 | 9,811 puts open at this expiration and the chain's single largest gamma strike — above spot, so it reads as a magnet and pivot rather than a floor |
| Heavy Sep 18 call open interest | $235.00 | 3,681 calls open after a one-day build of 3,446 — the week's biggest fresh positioning |
| Swing resistance | $232.01 | Recent pivot cluster (heuristic level from swing clustering, not a guaranteed reaction zone) |
| Max pain, Sep 18 | $230.00 | The price where the most option value would expire worthless — expirations sometimes gravitate toward it |
| Swing resistance | $228.57 | First overhead shelf, and almost exactly where the chart models put their resistance cluster |
| 20-day moving average | $225.82 | The close sits 0.56% under it |
| Spot (Sep 11 close) | $224.55 | Reference for every figure above and below |
| 50-day moving average | $211.68 | 6.08% below the close — the first real trend shelf |
| Whole-chain heaviest put strike | $210.00 | 20,364 puts open — the chain's real downside pile, and this article's invalidation line |
| First swing support | $201.89 | The bottom of Friday's implied range ($201.87) lands almost exactly on it |
| Deeper supports | $199.31 / $193.74 | Next pivot clusters below |
Note the disagreement between scopes: the Sep 18 expiration's own walls ($380 call, $240 put) bracket spot in a way that is almost useless as a corridor, while the whole chain's heaviest strikes ($250 call, $210 put) form a far tighter and more practical band. When this article talks about a corridor, it means $210 to $250.
Positioning and unusual flow
One rough estimate of dealer gamma — market makers hedge the options they've sold, and in this regime that hedging tends to amplify moves rather than dampen them — reads negative both for the whole chain and for the Sep 18 expiration on its own, so the two scopes agree. No gamma flip level is computable from today's data, so there is no single price to name as the pivot; treat the negative-gamma framing as a general "moves can extend" caveat rather than a level.
The flow itself was concentrated in upside calls at Friday's expiration. The Sep 18 $250 calls traded 5,692 contracts against 8,091 open — roughly $1.15 million of premium at a $2.02 midpoint. The Sep 18 $240 calls traded 4,051 contracts on 4,947 open, about $1.52 million. Both are outside or at the edge of the week's implied range, which is what chasing looks like. On the other side, the Sep 18 $225 puts traded 1,653 contracts for about $1.53 million with open interest up 457 — the largest single defensive line, and it sits right at spot. One genuinely odd print: the Sep 18 $252.50 calls turned over 309 contracts against just 56 open, more than five times the existing position, in a strike nobody was in a week ago.
3 · Technical check
Both chart models disagree with the options read, and they disagree in the same direction. The 3-day model (target date September 16) is bearish, targeting $219.50 with a projected range of $216.00 to $228.00. The 5-day model (target date September 18, the same expiration this article is built on) is also bearish, targeting $218.50 with a projected range of $213.50 to $229.50. Both classify as Diverges: the direction contradicts the options bias, even though both projected ranges sit comfortably inside the options-implied band.
The reasoning behind them is momentum-based and fairly decisive. MACD rolled from a positive peak on September 9 to −1.13 against a signal line at +0.49, with the histogram widening negative; Chaikin Money Flow at −0.246 has been in distribution territory for more than ten bars. The counterweight is ADX at 19.4 — below the 20 threshold that marks a real trend — with the −DI line only just crossing above +DI. In plain terms: the chart says sellers have the edge in a market that isn't trending hard. The models put support at $218.69 and resistance at $228.60, and the dominant bearish scenario is invalidated on a reclaim and hold above $228.60. Both reports reference a $224.43 starting price against the options snapshot's $224.55 — a 0.05% difference, so the two data sets are effectively looking at the same tape.
Model vs. Market: The options market implies $201.87 to $247.23 into September 18; the 5-day technical model targets $218.50 inside a $213.50–$229.50 band. The chart model is calling for a drift toward the lower half of a range the options market is pricing as twice as wide — which means the gap resolves not on direction but on whether NBIS can reclaim the $228.57–$228.60 shelf where the swing pivot and the chart models' resistance cluster overlap.
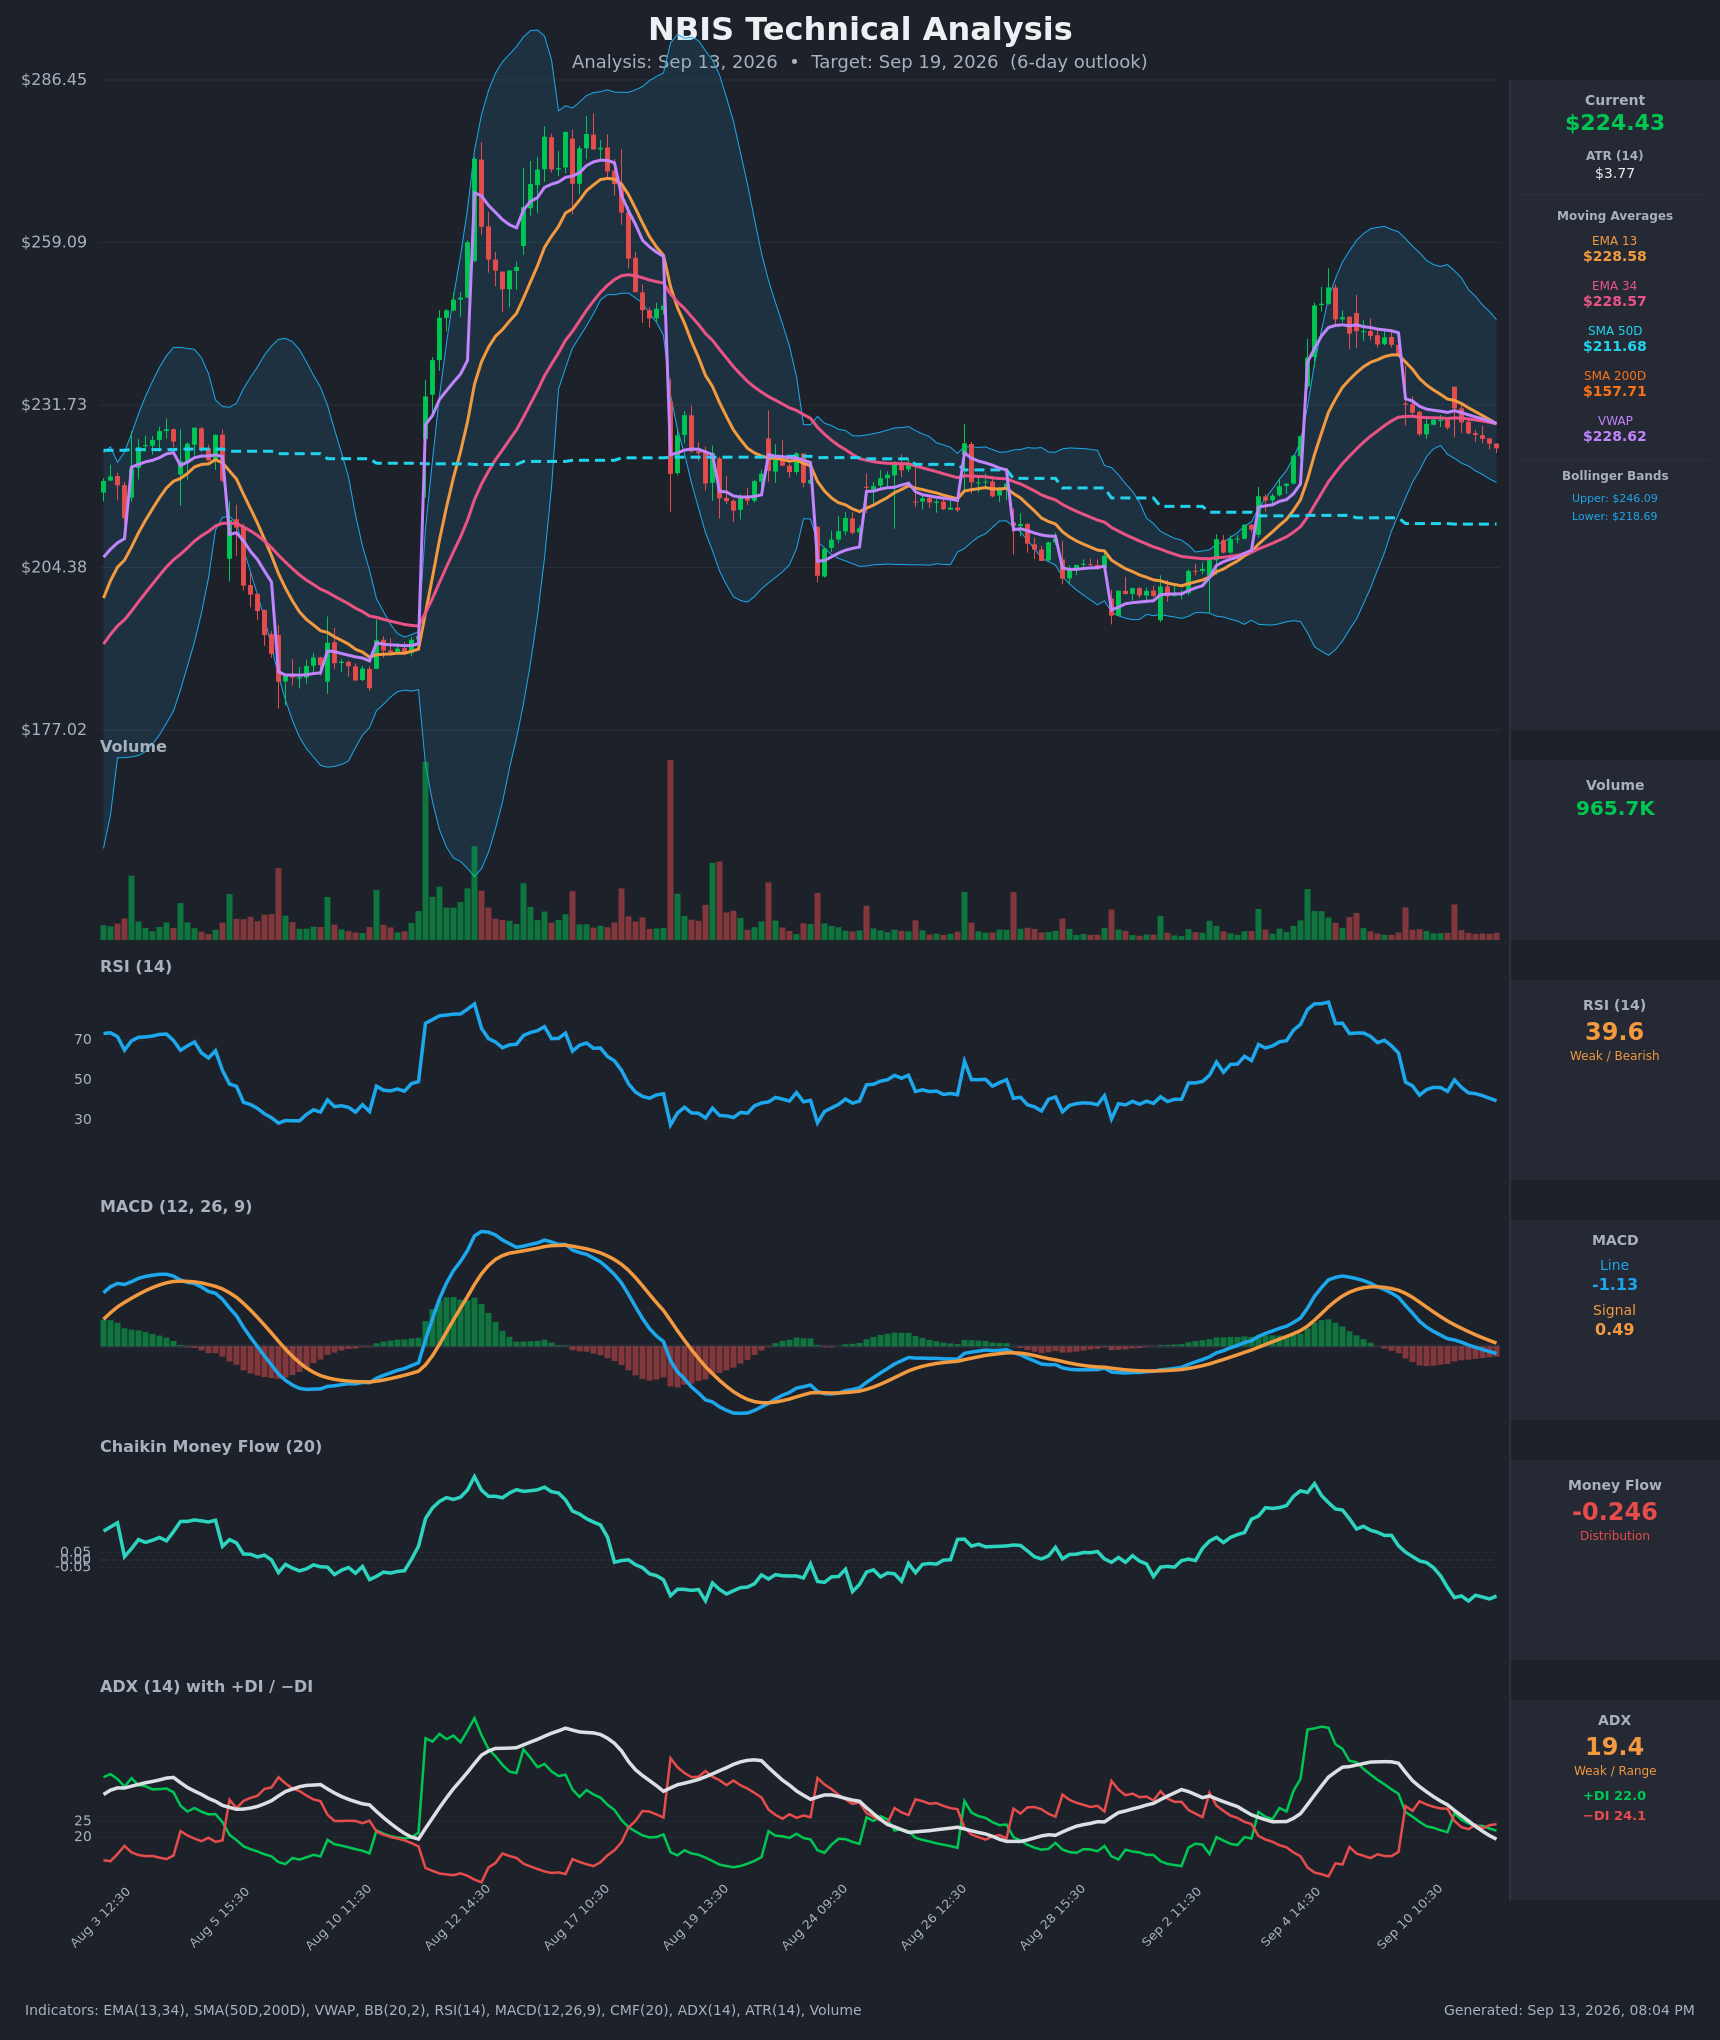
How the technicals adjusted the trades below: they kept the bullish structure's long strike just above spot rather than reaching for a far-OTM lottery ticket, they pushed the condor's short put down to $205 — below the chart models' bearish targets — and they earned the bearish put spread a real place on the list rather than a token mention.
Full technical write-ups: 3-day report → · 5-day report →
4 · Three ways the next five days can go
If NBIS pushes up through $240: that strike is both the Sep 18 expiration's heaviest put line and the chain's single largest gamma strike, so it tends to act as a pivot rather than a wall — puts written there lose value fast on the way up, and the hedging that follows generally works in the move's favor. Above it, the next real pile of contracts is $250, where 22,476 calls sit open across the chain; the week's implied range tops out just beneath that at $247.23. The expiration's nominal call wall at $380 is too far away to matter.
If NBIS drifts between $210 and $240: this is the pin case, and it is where the ladder's own math points. Max pain for Friday sits at $230.00 — about 2.4% above the close — with the $230 and $235 strikes carrying heavy fresh call open interest just overhead and the $225 puts carrying the largest defensive line right at spot. A grind into that zone would expire most of the week's positioning worthless, and both chart models' ranges overlap this band from below.
If NBIS breaks below $210: that is the chain's largest put pile (20,364 contracts) and it sits just under the 50-day average at $211.68. Below it the options structure thins quickly, with the implied range bottom at $201.87 landing almost exactly on the first swing support at $201.89. One rough estimate suggests dealer hedging in this name is currently positioned to amplify moves rather than cushion them, so a clean break of $210 is the branch that gets untidy fastest.
5 · Three defined-risk structures
Prices are end-of-day midpoints as of the September 11, 2026 close. All structures are hypothetical. Verify live prices before trading — these will be stale by the open.
If you lean bullish: Sep 18 $227.50/$240 call debit spread
- Trade: Buy the Sep 18 $227.50 call, sell the Sep 18 $240 call. (A debit spread means you pay up front; the most you can lose is what you paid, and you're betting on the stock finishing above your long strike plus that cost.)
- Debit: $3.95 · Max profit: $8.55 · Max loss: $3.95 · Break-even: $231.45
- Why it fits: This is the structure the volatility data argues for — with IV rank at 4/100 and option prices running about 4 vol points below what NBIS has actually delivered, you want to own premium, not sell it. The short strike sits on $240, the expiration's put wall and the chain's largest gamma strike, which is a natural stalling point rather than a level to hope through.
- Makes sense only if: you believe the call-side skew and the week's fresh call building at $227.50 and $235 are early money rather than late chase.
- Invalidated if: NBIS closes below $210.00.
- Managing it: take profits at roughly 60–70% of maximum value rather than holding for the last dollar of a 7-day spread; the short-term uptrend is fighting a month-long downtrend, which argues for early exits. If NBIS is still under $225 at Wednesday's close, the thesis is running out of clock — close it.
- Liquidity note: the $227.50 calls traded 20¢ wide (2.6% of mid) on 520 contracts, the $240 calls 10¢ wide on 4,051 contracts. Both fill easily.
- Analyze this position →
If you expect the range to hold: Sep 18 $195/$205/$250/$260 iron condor
- Trade: Sell the $205 put and buy the $195 put; sell the $250 call and buy the $260 call, all Sep 18. (You collect a credit up front and keep it if NBIS finishes between the short strikes.)
- Credit: $2.20 · Max profit: $220 per condor · Max loss: $780 · Break-evens: $202.80 and $252.20
- Why it fits: the short strikes sit just outside the week's implied range rails of $201.87 and $247.23, and the $250 call short strike leans on the chain's heaviest call pile (22,476 contracts). The upper break-even at $252.20 clears the implied range entirely; the lower one at $202.80 sits marginally inside it, so the put side is the vulnerable wing.
- Health warning: you're selling premium that hasn't been rich lately — with IV rank at 4/100 and implied volatility running below delivered movement, this is the least favored of the three structures on pure pricing grounds, and it is here because a $230 max pain and a mixed trend read make a pin genuinely plausible.
- Makes sense only if: you expect the $210–$240 corridor to hold through Friday and are comfortable being short both tails in a negative-gamma regime.
- Invalidated if: NBIS closes beyond either short strike — $205.00 or $250.00.
- Managing it: close at about 50% of max credit; exit regardless by Thursday's close rather than carrying expiration-day gamma. If either short strike is breached on a closing basis, close that wing rather than hoping.
- Liquidity note: the $205 puts traded 5¢ wide (2.2%), the $195 puts 3¢, the $250 calls 7¢ on 5,692 contracts, the $260 calls 2¢. This is the most liquid four-leg combination on the board.
- Analyze this position →
If you lean bearish: Sep 18 $225/$212.50 put debit spread
- Trade: Buy the Sep 18 $225 put, sell the Sep 18 $212.50 put.
- Debit: $5.13 · Max profit: $7.37 · Max loss: $5.13 · Break-even: $219.88
- Why it fits: this is the trade that follows the chart models rather than the flow. Both target the $218.50–$219.50 area by Wednesday and Friday respectively, which sits below this spread's break-even, and the short strike at $212.50 keeps you above the $210 put pile where structure gets crowded. Same volatility logic as the bullish spread — cheap options favor buying the move rather than selling it.
- Makes sense only if: you read Friday's failed gap (open $234.80, close $224.55) as distribution and give the MACD and money-flow deterioration more weight than the call-side skew.
- Invalidated if: NBIS closes above $228.60 — the level both chart models name as the kill switch for their bearish case.
- Managing it: this is a countertrend trade against a week of positive price momentum, so take 50–60% of max value when offered and don't hold past Thursday.
- Liquidity note: the $225 puts traded 20¢ wide (2.2% of mid) on 1,653 contracts and about $1.53 million of premium; the $212.50 puts 15¢ wide on 1,058 contracts. Fills are straightforward.
- Analyze this position →
If none of these: no trade
There is an honest case for standing aside here. The options read and the chart read point in opposite directions over the identical five-day window, and in that situation the only structure that doesn't require picking a winner is the condor — which is collecting premium that has been thin, not rich, relative to what this stock actually delivers. Selling range in a name whose options are pricing a ±10% week while its 20-day realized volatility runs at 80.9% is not the free lunch a high-IV-rank setup would be; the whole point of the volatility data is that NBIS options are cheap, and cheap options are a poor thing to be short. If neither directional view moves you enough to pay $4–$5 for a defined-risk spread, the correct position size is zero until $228.60 or $210.00 breaks and one of the two reads wins.
6 · Quick FAQ
What is NBIS's expected move this week? ±$22.68, or ±10.10%, into the September 18 expiration — a $201.87 to $247.23 range around the $224.55 close, per the options market's straddle pricing as of September 11.
Is NBIS expected to go up or down over the next five days? Options positioning as of September 11 leans bullish — call-side skew, thinning put open interest and call-dominated unusual flow — but that is a read of what traders have already done, not a forecast, and both chart models lean the other way. The actionable map is the $201.87–$247.23 range with $210.00 below and $250.00 above.
Are NBIS options expensive right now? No. IV rank of 4/100 says option prices are lower than 96% of the past year's readings, and on top of that they're running about 4 vol points below the movement NBIS has actually delivered over the past 20 days — a discount that sits around the 43rd percentile of this stock's own recent readings. That combination favors owning premium over selling it.
Where is NBIS's biggest options support and resistance? For the September 18 expiration specifically, the put wall is $240.00 and the call wall is $380.00 — but the put wall sits above spot and the call wall is 69% away, so the practical corridor is the whole chain's heaviest strikes: $210.00 on the downside and $250.00 on the upside.
What invalidates this week's read? A close below $210.00.
Methodology & disclosures. Data: end-of-day options-chain snapshot for NBIS, 2026-09-11, generated 2026-09-13T20:04:37Z. Prices shown are midpoints and will differ from live markets. Momentum/positioning scores and volatility-premium comparisons are descriptive measurements of past option flow and past price movement — not investment advice, signals, forecasts, or guarantees. Earnings dates and reported results are from the data provider's earnings feed as of 2026-09-13T20:04:37Z; report dates can change. All trade structures are hypothetical. Every structure shown has a defined maximum loss; you can lose the entire max-loss amount. Options involve substantial risk and are not suitable for all investors.