NBIS Options Are Pricing a $23 Move Into September 25 — And the Flow Is Leaning Higher
The options market implies a $200.40–$246.68 range for NBIS into the September 25 expiration, with call-side flow, thinning put open interest and a premium that is rich versus delivered movement. Here's the positioning map and three defined-risk ways to trade it.
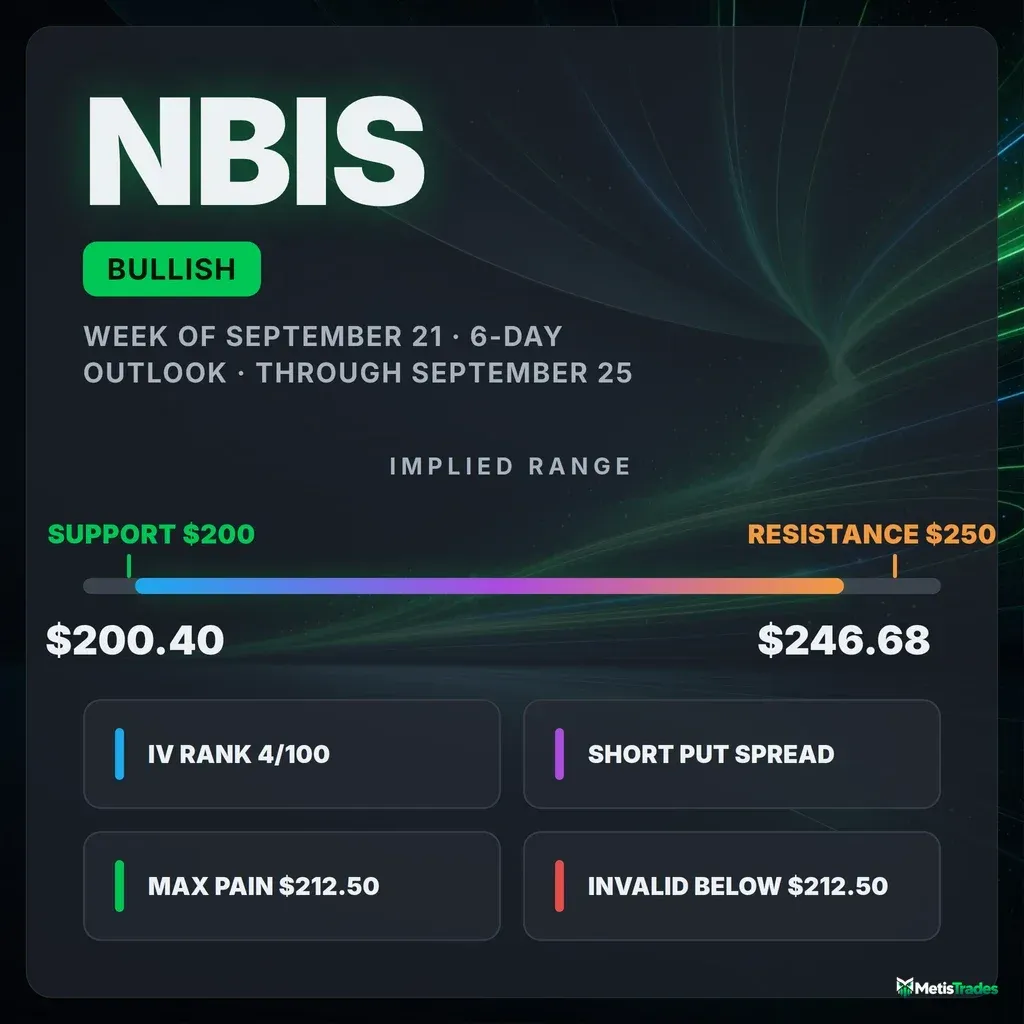
The options market implies a $200.40–$246.68 range into the September 25 expiration; here's what's driving it and three defined-risk ways to trade it.
Published Saturday, September 19, 2026 · Data as of Friday, September 18, 2026 close
Explore the live NBIS options data in the Detailed Options Analyzer →
Quick answer
| Item | Answer |
|---|---|
| Market bias | Bullish |
| Options-implied range (into September 25) | $200.40 – $246.68 (±10.35%) |
| Major support | $200.00 (put wall, September 25 expiration) |
| Major resistance | $250.00 (call wall, September 25 expiration) |
| Max pain (September 25) | $212.50 |
| Dealer gamma regime (estimate) | Positive — hedging tends to dampen moves; flip level ≈ $240 |
| Volatility condition | Compressed — IV rank 4.2/100 · premium rich: options priced ~14 vol points above delivered movement |
| Technical check | Confirms (bullish, 3-day and 6-day chart models) |
| Best-fitting strategy | Short put spread (September 25 $210/$200) |
| Analysis invalidated if | NBIS closes below $212.50 |
1 · What matters today
NBIS closed Friday, September 18 at $223.54, and the options market is pricing a move of about $23.14 either way — roughly ±10.35% — through the September 25 expiration. That puts the implied band at $200.40 to $246.68. Our read of the flow leans bullish: put open interest is thinning, call open interest is building fast, and 25-delta calls are carrying a bigger premium than 25-delta puts by more than they usually do for this name. The level that matters most on the downside is $200 — the strike with the biggest pile of open put contracts for this expiration, and the floor of the implied range. Overhead, the heaviest call open interest sits at $250. Both chart models we checked also point higher over the next few days, which supports rather than drives the read. A close below $212.50 breaks the thesis.
2 · What the options market is pricing
What changed this week
The week ended almost exactly where it started — NBIS is down 0.45% over the last five sessions and up 1.56% over twenty — but the positioning underneath rotated hard. Put/call volume came in at 0.53 on Friday (for every put traded, roughly two calls), against a 7-day average of 0.67 and a 14-day average of 0.71; that's the most call-tilted tape in two weeks. Open interest moved the same way: the put/call open-interest ratio is now 0.77 versus a 14-day average of 1.11 — a week ago there were more puts held open than calls, and now there are clearly fewer. Friday alone added roughly 46,100 call contracts of open interest against 16,700 on the put side, on total option volume running 2.2× its 20-day average.
The single biggest forward-looking open-interest change was the September 25 $230 call, which gained 1,643 contracts on 8,709 traded; the September 25 $215 call added 1,578. Our momentum read flipped bearish on a crossover on September 16 and has already been overrun — the daily composite jumped back to +40 versus a 7-day average of +1. That whipsaw is the honest summary of this name right now: the short-, medium- and long-horizon trend reads are all flat (price +3.4% over fifty days), so this is a positioning story, not a trend story.
Expected move
The expected move is the move the options market is pricing in — derived from what at-the-money straddles cost. Into September 25 that's ±$23.14, or ±10.35% of the $223.54 spot, giving a band of $200.40 to $246.68. Here is how that scales out across the next few expirations:
| Expiration | Implied move | Range around $223.54 |
|---|---|---|
| September 25 (7 DTE) | ±10.35% | $200.40 – $246.68 |
| October 2 (14 DTE) | ±14.88% | $190.28 – $256.80 |
| October 16 (28 DTE) | ±21.58% | $175.30 – $271.78 |
The rungs scale almost exactly with the square root of time — there is no bulge at any single expiration, which tells you the chain is not bracing for a dated event inside the next month. It is simply pricing a high-volatility name at a uniformly high level of volatility.
Volatility
At-the-money implied volatility — the market's estimate of how much NBIS will move, baked into option prices — sits at 78.2%. In absolute terms that is enormous; in this stock's own context it is cheap. IV rank is 4.2/100, meaning today's IV is lower than about 96% of the past year's readings, and IV percentile agrees at 4.0. The 30-day average IV is 90.4% and the 90-day average is 113.3%, so implied volatility has come down 38.9% over the past month even as it ticked up 1.9% over the past five sessions. The front-month term-structure read is unavailable today — Friday was an expiration day, so front-month IV can't be interpolated from a same-day-expiring contract.
Realized movement has collapsed faster than implied. Twenty-day realized volatility is 63.7%, an unusually depressed reading compared against this stock's own recent history, while the 5-day-versus-20-day realized ratio (0.97) is about typical — movement is neither accelerating nor decelerating right now, it has simply settled at a lower plateau after August's violence.
Premium rich or cheap: the volatility risk premium is the gap between how much movement options are priced for and how much NBIS has actually delivered — when it's positive, option sellers have been collecting more than realized movement cost them. That gap is currently about 14 vol points, and it sits at the 72nd percentile of this stock's own recent readings: richer than roughly 72% of them. The gap was deeply negative as recently as September 9 and flipped positive around September 10 — that flip is mechanical, the product of August's outsized daily swings rolling out of the 20-day realized-volatility window, not a fresh signal. The combination — IV rank of 4 but a 72nd-percentile premium over delivered movement — says option prices are low versus their own history and still generous versus what the stock has actually been doing. That favors collecting premium this week rather than owning it, which is why every structure below is a credit trade.
Skew and sentiment
Skew measures whether puts and calls the same distance from the stock price cost the same — usually puts are pricier, because traders pay up for crash protection. Not here. The 25-delta put is trading at 76.6% implied volatility against the 25-delta call at 82.6%: puts are running about 6.0 vol points below calls, against a 60-day norm of about 1.8 points below. Traders are paying up for upside, not downside, and by a wider margin than is normal for this name — a reading that sits well above its own norm.
Sentiment across expirations agrees. The 0–7 day bucket reads mildly positive at +14, the 7–30 day bucket is firmly positive at +58, and the 60–120 day bucket at +57, summarized by the term-structure engine as a "Bullish Recovery" regime — the lean is strongest a little further out on the curve than in the very front week. The peer-relative flow reading (nine call contracts versus five puts clearing an unusual-volume bar) is unusually heavy on the call side compared against this stock's own recent history, and net new open interest is running well above its norm on the call side too. Our leading positioning composite — the flow, skew and open-interest inputs stripped of price and IV trend — prints at +56, its highest in two weeks.
The key levels map
| Level | Price | Why it matters |
|---|---|---|
| 52-week high | $299.86 | Price sits 25.5% below it; the whole chain's single heaviest call strike also sits at $300 |
| Call wall (September 25) | $250.00 | Heaviest call open interest at this expiration (3,332 contracts) — piles like this often act as a magnet or a brake |
| Top of implied range | $246.68 | Upper edge of the ±10.35% band the options market is pricing |
| Gamma flip estimate | ≈ $240.00 | Estimate only — the whole-chain pivot for market-maker hedging behavior; also one of the five largest gamma strikes |
| Chart-model resistance | $233.20 | Prior swing high named by the 6-day technical report |
| Swing resistance | $228.57 / $230.30 | Recent price-structure pivot cluster directly overhead |
| Spot (Sept 18 close) | $223.54 | Reference for everything above and below |
| Chart-model support | $217.50 | Moving-average and VWAP confluence cited by both technical reports |
| 20-day moving average | $217.40 | Price is 2.83% above it |
| Max pain (September 25) | $212.50 | The price where the most option value would expire worthless — expirations sometimes gravitate toward it; also this article's kill switch |
| 50-day moving average | $211.96 | Price is 5.46% above it |
| Swing support | $202.88 | First heuristic support cluster below spot |
| Put wall (September 25) | $200.00 | Heaviest put open interest at this expiration (2,774 contracts); also the biggest gamma strike in the entire chain and the floor of the implied range |
| Deeper support | $199.31 / $193.74 | Next swing-pivot clusters if $200 gives way |
One disagreement worth naming: the September 25 expiration's own call wall is $250, but the whole chain aggregated across all expirations puts its heaviest call strike far above, at $300 — that is long-dated speculative open interest, not a level that governs the next six days. The put walls agree: $200 for the week and $200 for the whole chain.
Positioning and unusual flow
The dealer-gamma figure here is an estimate built on an assumed convention, not observed inventory. On that estimate, the September 25 expiration reads positive-gamma — the regime in which market-maker hedging tends to dampen moves rather than amplify them — with the whole-chain flip level estimated around $240. Spot is sitting further below that estimated pivot than it typically does for this name, which is worth knowing but is a "supportive versus fragile" reading, not a directional one.
Three live flow items stand out, all at the September 25 expiration:
- $230 calls: 8,709 contracts traded against 2,326 open — $5.57 million of premium changed hands, and open interest grew by 1,643. Fresh positioning just above spot.
- $250 calls: 4,956 traded, with 3,332 contracts of open interest built at a strike that had none the prior day. That single session is what created the week's call wall.
- $220 puts: 4,348 traded — nearly eight times the open interest — and open interest fell by 783, roughly $3.2 million of premium. Downside protection near the money was being closed, not added.
3 · Technical check
Both chart models point the same way the options flow does. The 3-day model (target date September 22) is bullish with a target of $227.50 and a projected range of $217.50 to $229.50. The 6-day model (target date September 25 — the same date this article is anchored to) is also bullish, targeting $229.00 with a projected range of $215.00 to $231.50. Both projections are the chart tool's own forecasts, and both sit comfortably inside the options-implied $200.40–$246.68 band. That classifies as Confirms: same direction as our bias, smaller magnitude than the options market is pricing.
The most decisive indicator reads are a trend-strength gauge at 33.2 with the positive directional line well above the negative one — a genuinely established uptrend, not chop — set against a money-flow measure sitting in distribution at −0.23 even as price rallied roughly fourteen points off the September 16 low. That divergence is the honest caveat: the bounce has not been fully confirmed by volume-weighted buying. Both reports put their invalidation at a close back below the $217.50–$218 moving-average cluster.
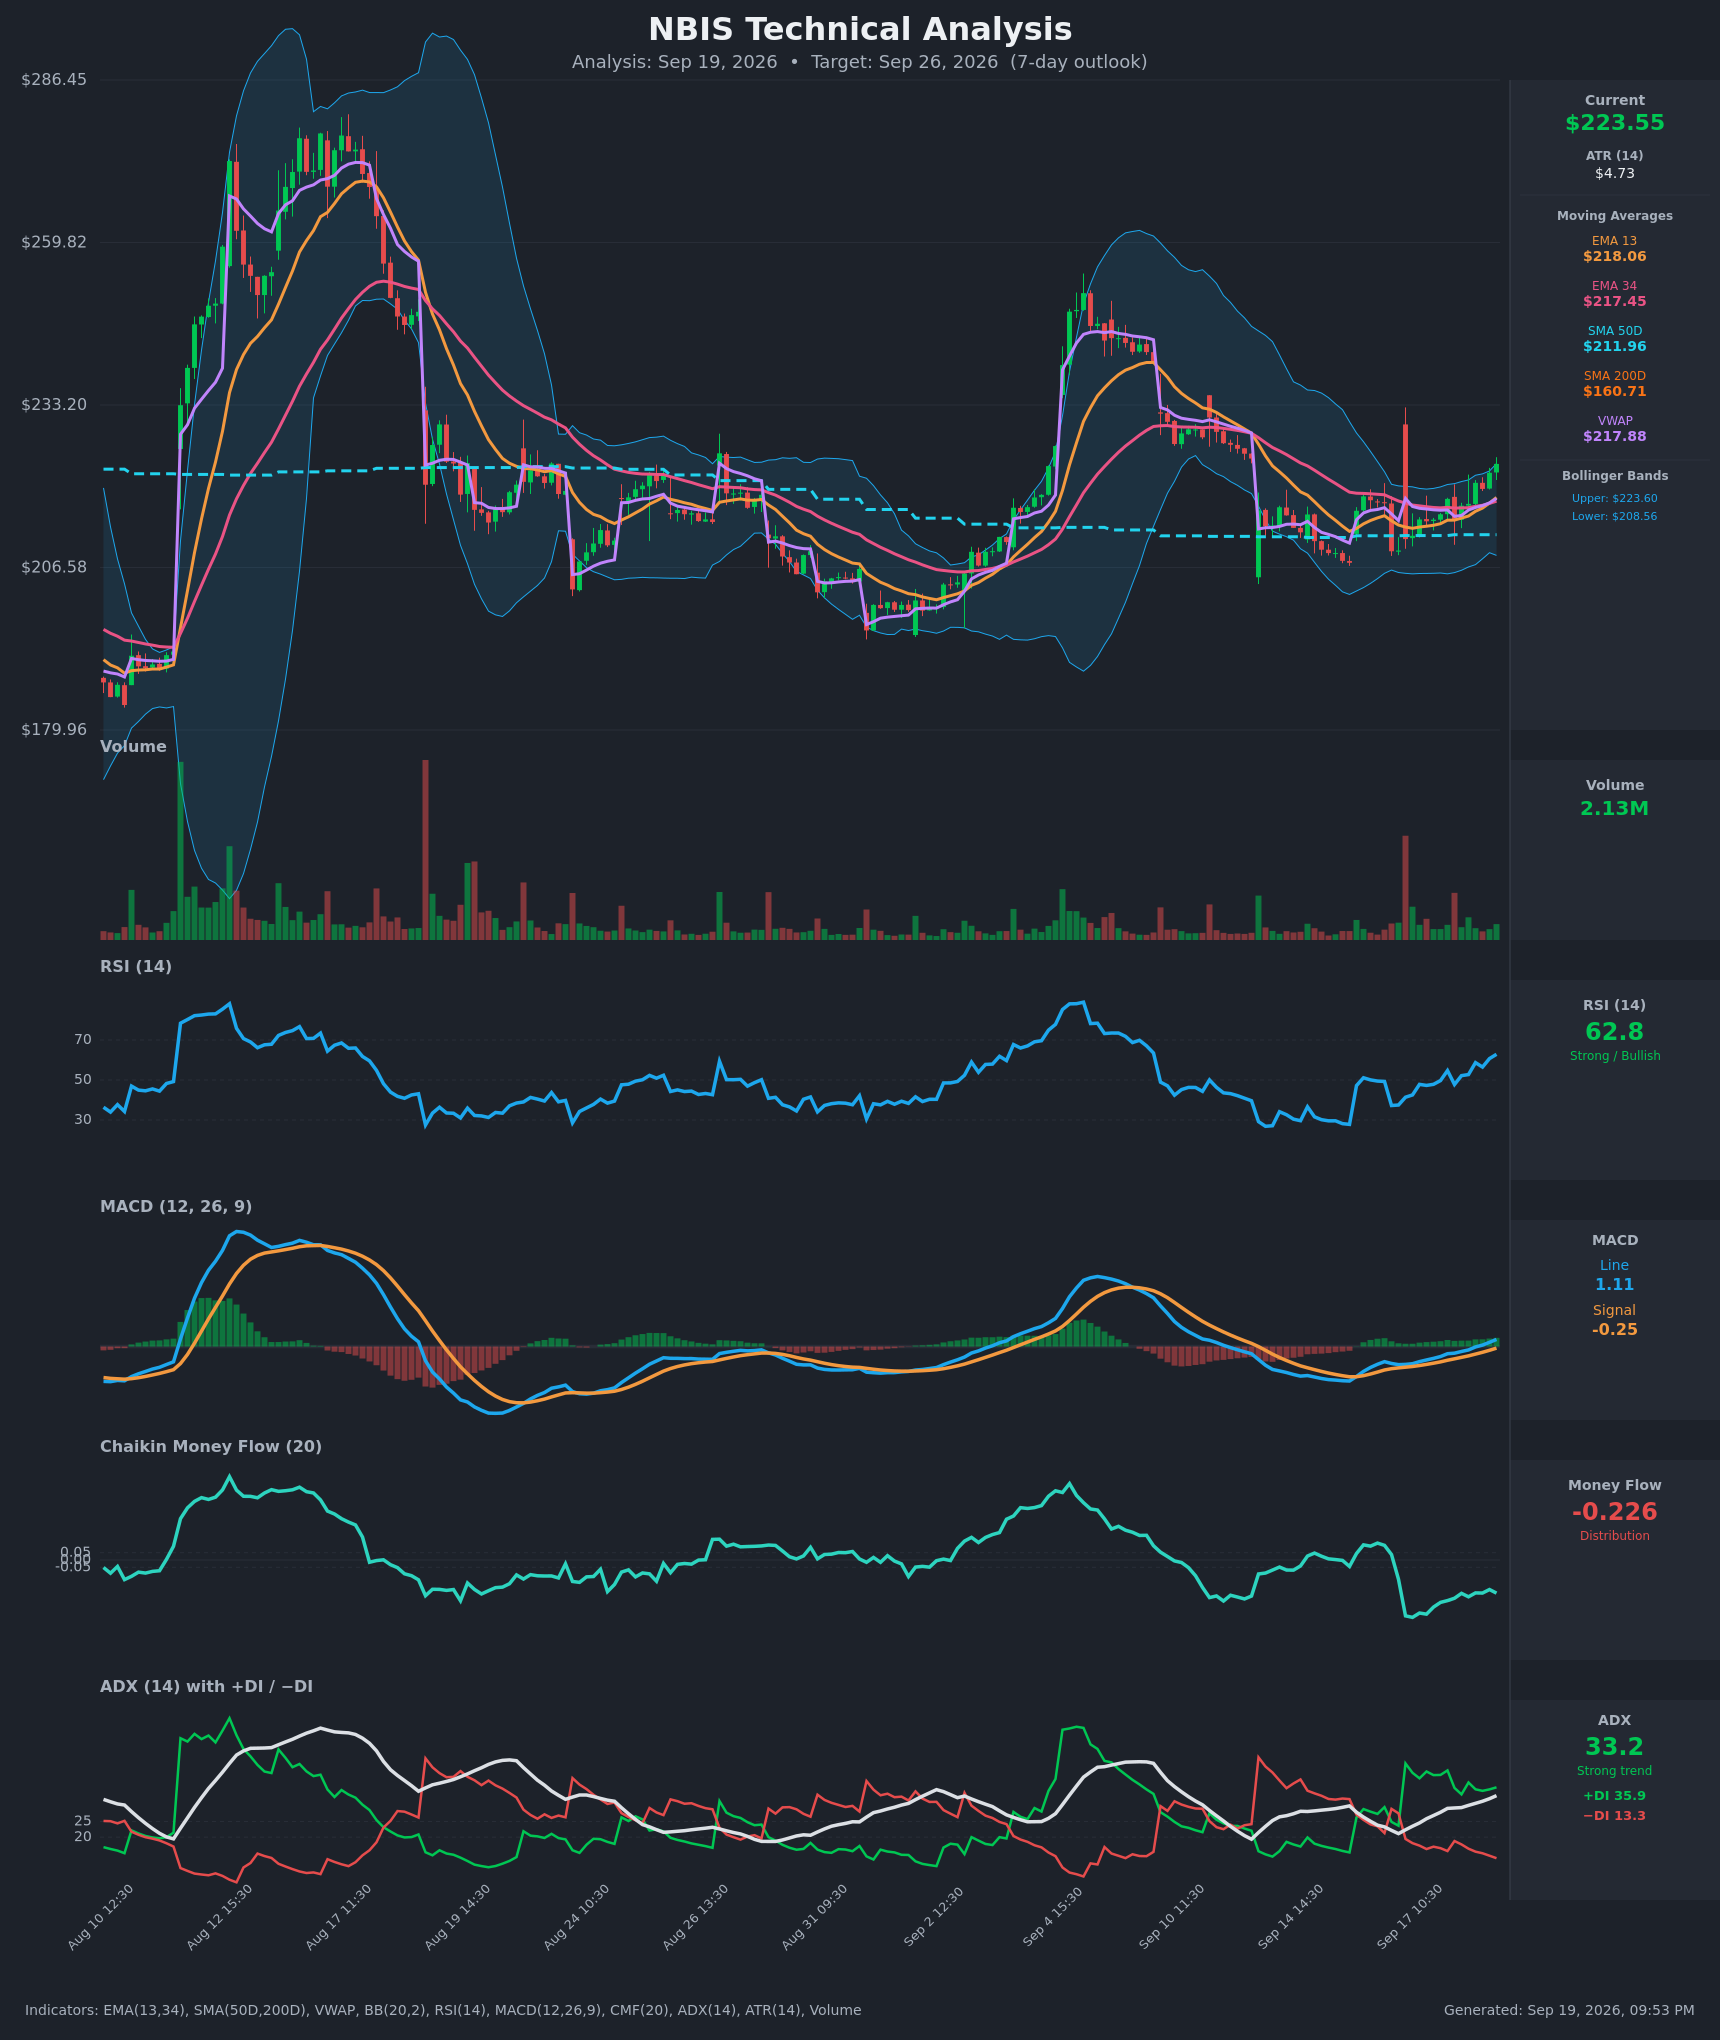
Model vs. Market: The options market implies $200.40–$246.68 into September 25; the 6-day technical model targets $229.00 inside a $215.00–$231.50 range. The chart model expects a far tamer week than the option chain is charging for — which is exactly the condition that rewards selling defined-risk premium rather than buying directional options.
The practical effect on strikes below: because the technical support cluster sits at $217.50 and the chart model's downside edge is $215.00, the short put strike is kept at $210 — below both, and above the put wall that anchors the whole structure.
Full technical write-ups: 3-day report → · 6-day report →
4 · Three ways the next six days can go
If NBIS pushes above the call wall ($250): that pile of 3,332 contracts was built in a single session and sits right at the top edge of the implied range. Heaviest call open interest overhead tends to slow rallies as it is approached, because the hedging around it cuts against the move. A clean break through leaves comparatively thin positioning until $270, where 2,768 contracts sit.
If NBIS drifts between the walls: this is the base case the arithmetic keeps returning to. Max pain for September 25 is $212.50, roughly 5% below spot, and the expiration's own dealer-gamma estimate reads positive — hedging that tends to compress rather than extend moves. In that regime, a stock that closes the week anywhere between $205 and $240 lets every credit structure below work, with expiring open interest exerting a mild downward tug toward $212.50 as the date approaches.
If NBIS breaks below the put wall ($200): that strike is both the heaviest put open interest for the week and the largest gamma strike in the entire chain, so it should absorb a first test. Below it, the implied-range floor at $200.40 is already gone and the next structural shelves are $199.31 and $193.74. Spot sits about 7% under the estimated flip level of $240 — further below it than usual for this name — and one rough estimate suggests that on the far side of a flip, market-maker hedging amplifies selling rather than cushioning it. That is the scenario the invalidation level at $212.50 is designed to get you out ahead of.
5 · Three defined-risk structures
Prices are end-of-day midpoints as of 2026-09-18. All structures are hypothetical. Verify live prices before trading — these will be stale by the open.
If you lean bullish: September 25 $210/$200 put credit spread
- Trade: Sell the September 25 $210 put, buy the September 25 $200 put. You collect a credit up front and keep all of it if NBIS stays above $210.
- Credit: $2.06 · Max profit: $206 · Max loss: $794 · Break-even: $207.94
- Why it fits: the long leg sits exactly on the put wall at $200, where the week's heaviest put open interest and the chain's largest gamma strike coincide, and the short strike is a 25-delta put well below both chart models' downside edges. The premium collected is rich relative to what NBIS has actually delivered (about 14 vol points of gap, a 72nd-percentile reading), which is the condition that pays sellers.
- Makes sense only if: you believe the call-side flow and thinning put open interest describe real demand rather than a one-day burst.
- Invalidated if: NBIS closes below $212.50.
- Managing it: close at roughly 50% of the credit; exit no later than September 24 regardless of price, since a 10% one-day gap in this name is routine into expiration; if NBIS closes through $210, close rather than hope. With the short- and long-horizon trend reads both flat, this is a hold-it-short-and-take-profits-early trade, not a position to carry.
- Liquidity note: the $210 puts quoted $3.60 bid / $3.75 ask (15¢ wide) and the $200 puts $1.58 / $1.66 (8¢). Both fill easily.
- Analyze this position →
If you expect the range to hold: September 25 $205/$200 – $245/$250 iron condor
- Trade: Sell the $205 put / buy the $200 put, and sell the $245 call / buy the $250 call, all September 25. Four legs, one net credit, maximum profit if NBIS finishes between $205 and $245.
- Credit: $1.60 · Max profit: $160 · Max loss: $340 · Break-evens: $203.40 and $246.60
- Why it fits: the short strikes are pinned to the structure — the put side one strike above the put wall, the call side one strike below the call wall — and the upper break-even at $246.60 lands within pennies of the implied-range top at $246.68. Both chart models project a range narrower than this condor's wings, and the expiration's positive-gamma estimate is the regime that favors pinning.
- Makes sense only if: you accept that the bias is bullish and this structure is deliberately bias-neutral — it trades the premium, not the direction.
- Invalidated if: NBIS closes outside $203.40–$246.60 at expiration; manage well before that.
- Managing it: take profit at ~50% of the credit; close the threatened side if either short strike is breached rather than defending both.
- Liquidity note: the $205 puts traded 16¢ wide ($2.42 / $2.58 — the widest leg here, about 6% of mid, so work the order), the $200 puts 8¢, the $245 calls 11¢ and the $250 calls 7¢.
- Analyze this position →
If you lean bearish: September 25 $240/$250 call credit spread
- Trade: Sell the September 25 $240 call, buy the September 25 $250 call. You collect the credit and keep it if NBIS stays below $240.
- Credit: $1.65 · Max profit: $165 · Max loss: $835 · Break-even: $241.65
- Why it fits: the short strike sits at the estimated gamma-flip level of $240 and the long leg is bought directly at the call wall, so the structure is capped by the single heaviest call strike of the week. This is the trade for someone who thinks the $250 open interest is a ceiling rather than a target.
- Makes sense only if: you are explicitly fading this article's bias — the flow, the skew and both chart models are pointing the other way, so size accordingly.
- Invalidated if: NBIS closes above $240.
- Managing it: close at ~50% of the credit or on any decisive close above $233.20, the prior swing high the chart model names as the first real resistance.
- Liquidity note: the $240 calls quoted $3.50 / $3.65 (15¢, about 4% of mid) and the $250 calls $1.89 / $1.96 (7¢). Both are among the most actively traded lines in the expiration.
- Analyze this position →
If none of these: no trade
Premium is rich versus delivered movement and nothing on the calendar is inflating it — so the case for standing aside has to be made on gap risk, and it is a real case. NBIS opened 9.86% higher on September 17 and 8.72% lower on September 14; a single overnight session in this name can travel most of the six-day expected move. Every structure above has a hard maximum loss, but that loss can be delivered in one gap with no chance to manage. If you cannot sit through a $20 overnight move on a $223 stock without touching the position, the rich premium is not compensation, it is bait — and waiting for a week when realized movement and implied movement are closer together is the better trade. Defined risk is the minimum requirement here, not a nicety.
6 · Quick FAQ
What is NBIS's expected move into September 25? ±$23.14 (±10.35%), implying a $200.40–$246.68 range, per the options market's straddle pricing as of the September 18 close.
Is NBIS expected to go up or down over the next six days? Options positioning as of September 18 leans bullish — call open interest built by roughly 46,100 contracts in a session while puts near the money were being closed, and 25-delta calls cost more than 25-delta puts by a wider margin than usual — but that is a read of what traders have done, not a forecast. The actionable map is the $200.40–$246.68 range and the $200/$250 wall pair.
Are NBIS options expensive right now? Two lenses, two answers. IV rank of 4.2/100 says option prices are lower than roughly 96% of the past year's readings; on top of that, they are running about 14 vol points above the movement NBIS has actually delivered over the past twenty days — richer than about 72% of this stock's own recent readings. Cheap versus its own history, generous versus its own realized movement: that combination favors selling defined-risk premium over buying it.
Where is NBIS's biggest options support and resistance? Put wall $200.00 and call wall $250.00 for the September 25 expiration, with max pain at $212.50 in between.
What invalidates this week's read? A close below $212.50.
Methodology & disclosures. Data: end-of-day options-chain snapshot for NBIS, 2026-09-18, generated 2026-09-19T21:53:45.917Z. Prices shown are midpoints and will differ from live markets. Momentum/positioning scores and volatility-premium comparisons are descriptive measurements of past option flow and past price movement — not investment advice, signals, forecasts, or guarantees. All trade structures are hypothetical. Every structure shown has a defined maximum loss; you can lose the entire max-loss amount. Options involve substantial risk and are not suitable for all investors.