NFLX Options Are Pricing a ±$2.91 Move — The $72 Put Wall Sits Right at Spot
Netflix closed Friday, September 18 at $71.79 after a 5% gap down, and the options market is pricing a $68.88–$74.70 range into the September 25 expiration. Here's what the positioning says, where the levels sit, and three defined-risk ways to trade it.
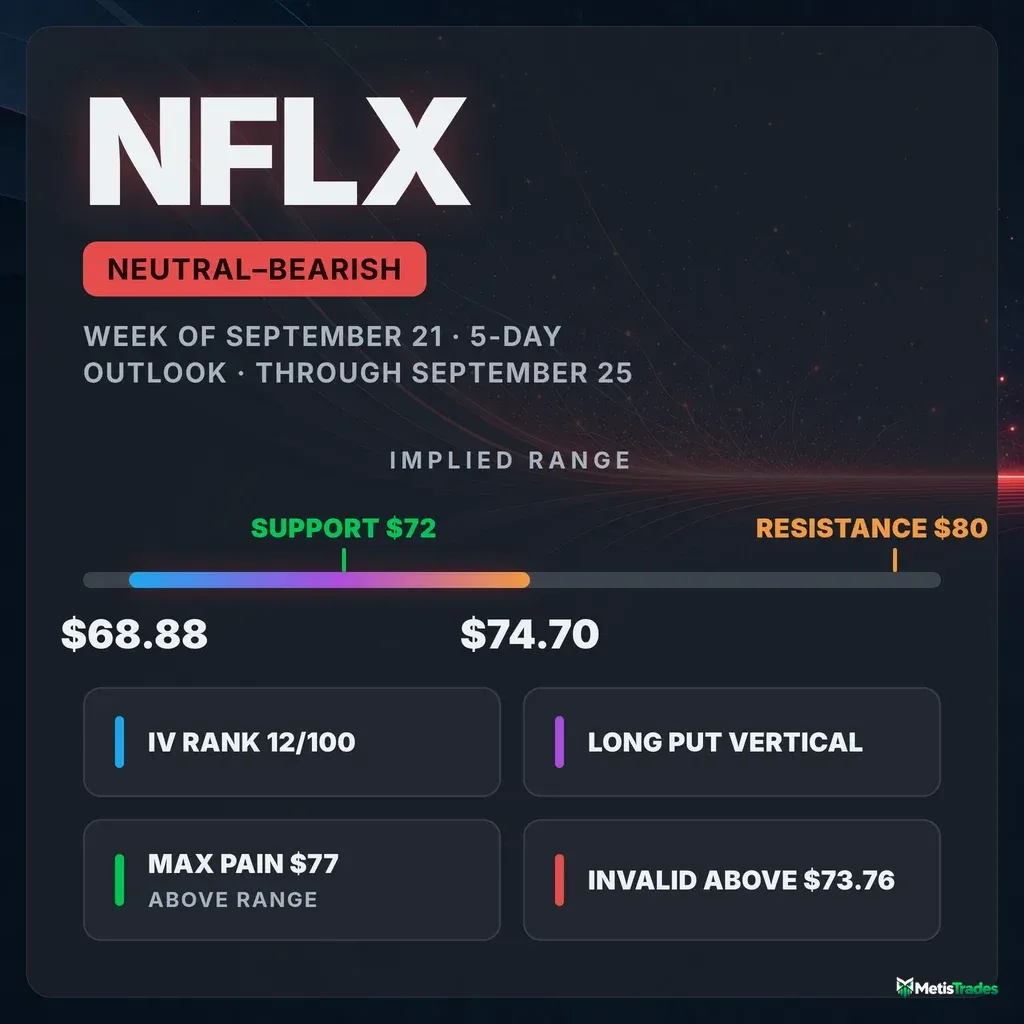
The options market implies a $68.88–$74.70 range into the September 25 expiration; here's what's driving it and three defined-risk ways to trade it.
Published Sunday, September 20, 2026 · Data as of Friday, September 18, 2026 close
Explore the live NFLX options data in the Detailed Options Analyzer →
Quick answer
| Item | Answer |
|---|---|
| Market bias | Neutral with a bearish tilt |
| Options-implied range (into Sep 25) | $68.88 – $74.70 (±4.06%, or ±$2.91) |
| Major support | $72.00 — put wall for the September 25 expiration |
| Major resistance | $80.00 — call wall for the September 25 expiration |
| Max pain (Sep 25) | $77.00 |
| Dealer gamma regime (estimate) | Negative — market-maker hedging tends to amplify moves; a flip-level estimate could not be computed from today's chain |
| Volatility condition | Rising — IV rank 11.92/100 · premium thin: options priced about 3.2 vol points below delivered movement |
| Next earnings | October 20, 2026 (after close) — after every expiration quoted in the ladder below |
| Technical check | Confirms (bearish, 3-day and 5-day chart models) |
| Best-fitting strategy | Long put vertical (debit spread) into September 25 |
| Analysis invalidated if | NFLX closes above $73.76 |
1 · What matters today
Netflix closed Friday, September 18 at $71.79 after gapping down 5.36% from the prior close of $75.31 — on volume 3.7× its 20-day average. Our read of options flow turned sharply negative into that session, and the headline bias lands at neutral with a bearish tilt: the positioning is leaning down, but not hard enough to call it a full bearish stance.
The options market is pricing a move of about ±$2.91 into the September 25 expiration — that's the move implied by what straddles cost — which frames a $68.88 to $74.70 range. The level that matters most is $72.00: that's the strike with the heaviest put open interest for September 25, and it sits within a quarter of spot. Both chart models we checked point lower over the same window, which confirms rather than fights the options read. A close above $73.76 kills this thesis.
2 · What the options market is pricing
What changed this week
The week's story is a fast, one-directional shift in positioning. NFLX fell 7.25% over the trailing five sessions and 10.42% over twenty. Put open interest relative to call open interest — how many puts are held open for every call — went from 0.88 to 1.22 over five days, a 38% jump; against a 7-day average of 0.96 and a 14-day average of 0.89, that is a rapid build of downside protection, and our snapshot readings flag that drift as running well outside this stock's own recent norm. Put/call volume tells the same story more mildly: 0.64 on Friday versus a 7-day average of 0.54 and a 14-day average of 0.48 — put-tilted, and unusually so for this name, but still call-dominated in absolute terms.
Total option volume ran 2.72× its 20-day average, so this was a genuine repositioning session, not a quiet drift. Day over day, call open interest fell 50,359 contracts while put open interest rose 14,667. The single biggest open-interest change in the file sits at the $80 puts expiring September 18 (down 7,257 contracts) — but that expiration has already settled, so treat it as history: into Friday's expiry, upside-put hedges were being unwound as the stock fell through them. Among still-live contracts, the largest builds were the October 16 $60 puts (+2,235 contracts) and a cluster of September 25 calls at $75 through $79 (+1,136 to +1,959 each) — cheap lottery tickets bought into the drop rather than conviction positioning.
Our short- and long-term trend reads agree here rather than diverge: the past week and the past month both read bearish (price −7.2% and −10.4%), while the ~50-day read is flat. Nothing in the multi-horizon picture argues against a short-dated directional structure.
Expected move
Into the September 25 expiration, the options market is pricing a move of ±4.06% — about ±$2.91 around the $71.79 close, or a range of $68.88 to $74.70. That figure comes straight from what at-the-money options cost at that expiration; it is a one-standard-deviation scaling of today's implied volatility, not a forecast.
| Expiration | Implied move | Range around $71.79 |
|---|---|---|
| September 25 | ±4.06% | $68.88 – $74.70 |
| October 2 | ±5.96% | $67.51 – $76.07 |
| October 9 | ±7.46% | $66.43 – $77.15 |
| October 16 | ±8.85% | $65.44 – $78.14 |
The ladder widens smoothly through October 16 — roughly what you'd expect as time is added — and then steps up sharply at the next rung. That step is where the earnings paragraph below points.
Volatility
Chain-wide at-the-money implied volatility — the market's estimate of how much NFLX will move, baked into option prices — sits at 34.8%. That is 2.9% higher than the prior day, 7.8% higher than five days ago, and 3.5% above where it stood thirty sessions back. It is running above its 30-day average (32.1%) but still below its 90-day average (36.4%).
The striking number is IV rank: 11.92/100. That means today's implied volatility is cheaper than roughly 88% of the past year's readings — even after a 5% gap down. The September 25 expiration's own at-the-money read is lower still at 29.3%, consistent with a front expiration that carries no scheduled event. The front-month versus 60-day comparison is unavailable today: Friday was an expiry date, and that comparison cannot be computed from a same-day-expiring contract. Meanwhile, actual delivered movement has accelerated — the 5-day realized volatility is running about 1.33× the 20-day figure, a meaningful step above this stock's own recent norm.
Premium rich or cheap. The gap between how much movement options are priced for and how much NFLX has actually delivered — the volatility risk premium — sits at about −3.2 vol points (34.8% implied against 37.97% realized over the past twenty days). When that gap is positive, option sellers have been collecting more than realized movement cost them; here it is negative, meaning the stock has been moving more than options are charging for. At the 23rd percentile versus this stock's own recent readings, that premium is thinner than roughly three-quarters of them. A week ago the gap was nearly flat (−0.7 vol points on September 17); Friday's gap-down pushed realized volatility up and widened it mechanically. The combination — IV rank 11.92 and a 23rd-percentile premium versus delivered movement — favors owning premium this week rather than collecting it. One caveat on the calendar: the October 20 report is thirty days out, close enough that implied volatility in the later expirations carries a real scheduled reason for being elevated, so don't read the far end of the term structure as free premium.
Earnings on the calendar
Netflix reports after the close on October 20. That date falls after every expiration in the ladder above, which is why the front rungs price so modestly. The fingerprint shows up one rung further out: the implied move jumps from ±8.85% at the October 16 expiration to ±13.16% at October 23 — that step-up is the market bracing for the report, not a change in how it sees the next month generally. On recent history, the last four reports have split evenly: a penny beat in July against an expected $0.79, a nine-cent miss in April, a penny beat in January, and an eleven-cent miss last October. That is context for why the hump exists, not a view on the outcome.
Skew and sentiment
Puts and calls the same distance from the stock price don't cost the same — and right now 25-delta puts are running 1.1 vol points over matching calls (35.84% versus 34.73%). The telling part is the baseline: over the prior sixty days, the median reading had puts 1.1 points cheaper than calls. That is a 2.2-point swing in downside-protection demand, and our snapshot readings put it well outside this name's normal band. Traders are paying up for crash protection in a stock where they normally don't.
Sentiment across expiration dates is genuinely split. Options expiring within a week lean mildly positive (+23), while the 7–30 day window leans negative (−24) and the 30–60 day window is the most negative of all (−36). The summary regime label is Mixed — no single stance dominates the curve. Our leading positioning read, which strips out lagging price and IV inputs, printed −38 on Friday after sitting at +22 as recently as September 14. That is the fastest swing in the ninety-day series.
The key levels map
| Level | Price | Why it matters |
|---|---|---|
| 200-day moving average | $85.48 | Price sits 16.02% below it — the long-term trend structure is broken |
| Swing resistance | $81.09 | Upper edge of the pre-breakdown range |
| Call wall (Sep 25) | $80.00 | Heaviest call open interest for the target expiration (5,192 contracts) — and also the heaviest call strike across the whole chain (102,986) |
| Swing resistance | $78.44 | Prior consolidation shelf |
| Max pain (Sep 25) | $77.00 | The price where the most option value would expire worthless — expirations sometimes gravitate toward it, and this one sits well above spot |
| 50-day moving average | $75.72 | Broken on Friday's gap; now overhead |
| Largest gamma strike (all expirations) | $75.00 | Biggest total gamma·open-interest pile in the chain — a natural magnet if price reclaims it |
| Top of implied range (Sep 25) | $74.70 | One standard deviation up from spot |
| Swing resistance | $73.76 | Nearest price-structure resistance — and this article's invalidation level |
| Chart-model resistance | $73.32 | Short-term moving average cited by both technical reports as their invalidation |
| Put wall (Sep 25) | $72.00 | Heaviest put open interest for the target expiration (4,429 contracts) — the level the week hinges on |
| Spot | $71.79 | Friday's close |
| Swing support | $70.86 | First price-structure shelf below spot |
| Chart-model support | $70.32 | Lower volatility band cited by both technical reports |
| Bottom of implied range (Sep 25) | $68.88 | One standard deviation down from spot |
| 52-week low / put wall (all expirations) | $65.08 / $65.00 | Price is 10.31% above the 52-week low; $65 carries the biggest put pile in the entire chain (123,229 contracts), though not for September 25 |
Two things worth naming plainly. First, the September 25 expiration's own put wall ($72) is not the chain-wide put wall ($65) — the near-dated hedges are clustered right at the money while the longer-dated ones sit far below. Second, the call wall agrees across both scopes at $80, which is a long way above spot; there is no meaningful call-side barrier between $71.79 and $80 for this expiration.
Positioning and unusual flow
The dealer-gamma estimate for the September 25 expiration is negative — under the standard assumption that market makers are net long calls and net short puts, their hedging in this regime tends to amplify moves rather than cushion them. Read that as an estimate, not observed inventory; the chain did not produce a usable flip-level estimate today, so we won't quote one.
Three live flow items stood out. The September 25 $72 calls traded 16,401 contracts against just 78 contracts of prior open interest — a turnover ratio above 200× and about $1.78 million of premium, the single largest dollar-premium contract in the chain. That is same-week, at-the-money call activity into a gap-down, which reads more like fast money fading the drop than a structural position. The September 25 $69 puts traded 14,630 contracts against 547 open — downside hedging right at the lower implied-move rail. And on the open-interest side, the October 16 $60 puts added 2,235 contracts, a build of far-out-of-the-money protection extending past this week's window.
3 · Technical check (the 20%)
Both chart models read bearish, and both classify as Confirms against the options bias. The 3-day model (target date September 23) projects $70.85 with a range of $69.20 to $73.30. The 5-day model (target date September 25 — the same date this article is anchored to) projects $70.50 with a range of $68.20 to $73.60. Both targets sit comfortably inside the options-implied $68.88–$74.70 band, so the two views are describing the same week rather than arguing about it.
The decisive technical read in both write-ups is trend strength: an ADX near 53.5 with the negative directional line overwhelmingly dominant, which describes an unusually well-established downtrend rather than a wobble. Cutting the other way, both reports flag a positive money-flow reading alongside a deeply oversold momentum oscillator — some absorption is happening into the decline. Both name the same invalidation: a reclaim of roughly $73.32.
Model vs. Market: The options market implies $68.88–$74.70 into September 25; the 5-day technical model targets $70.50. The models agree on direction and the chart's target sits inside the options band — so the disagreement isn't about where, it's about conviction: the options chain is pricing a symmetric range while the chart model is pricing a skewed drift toward its lower half.
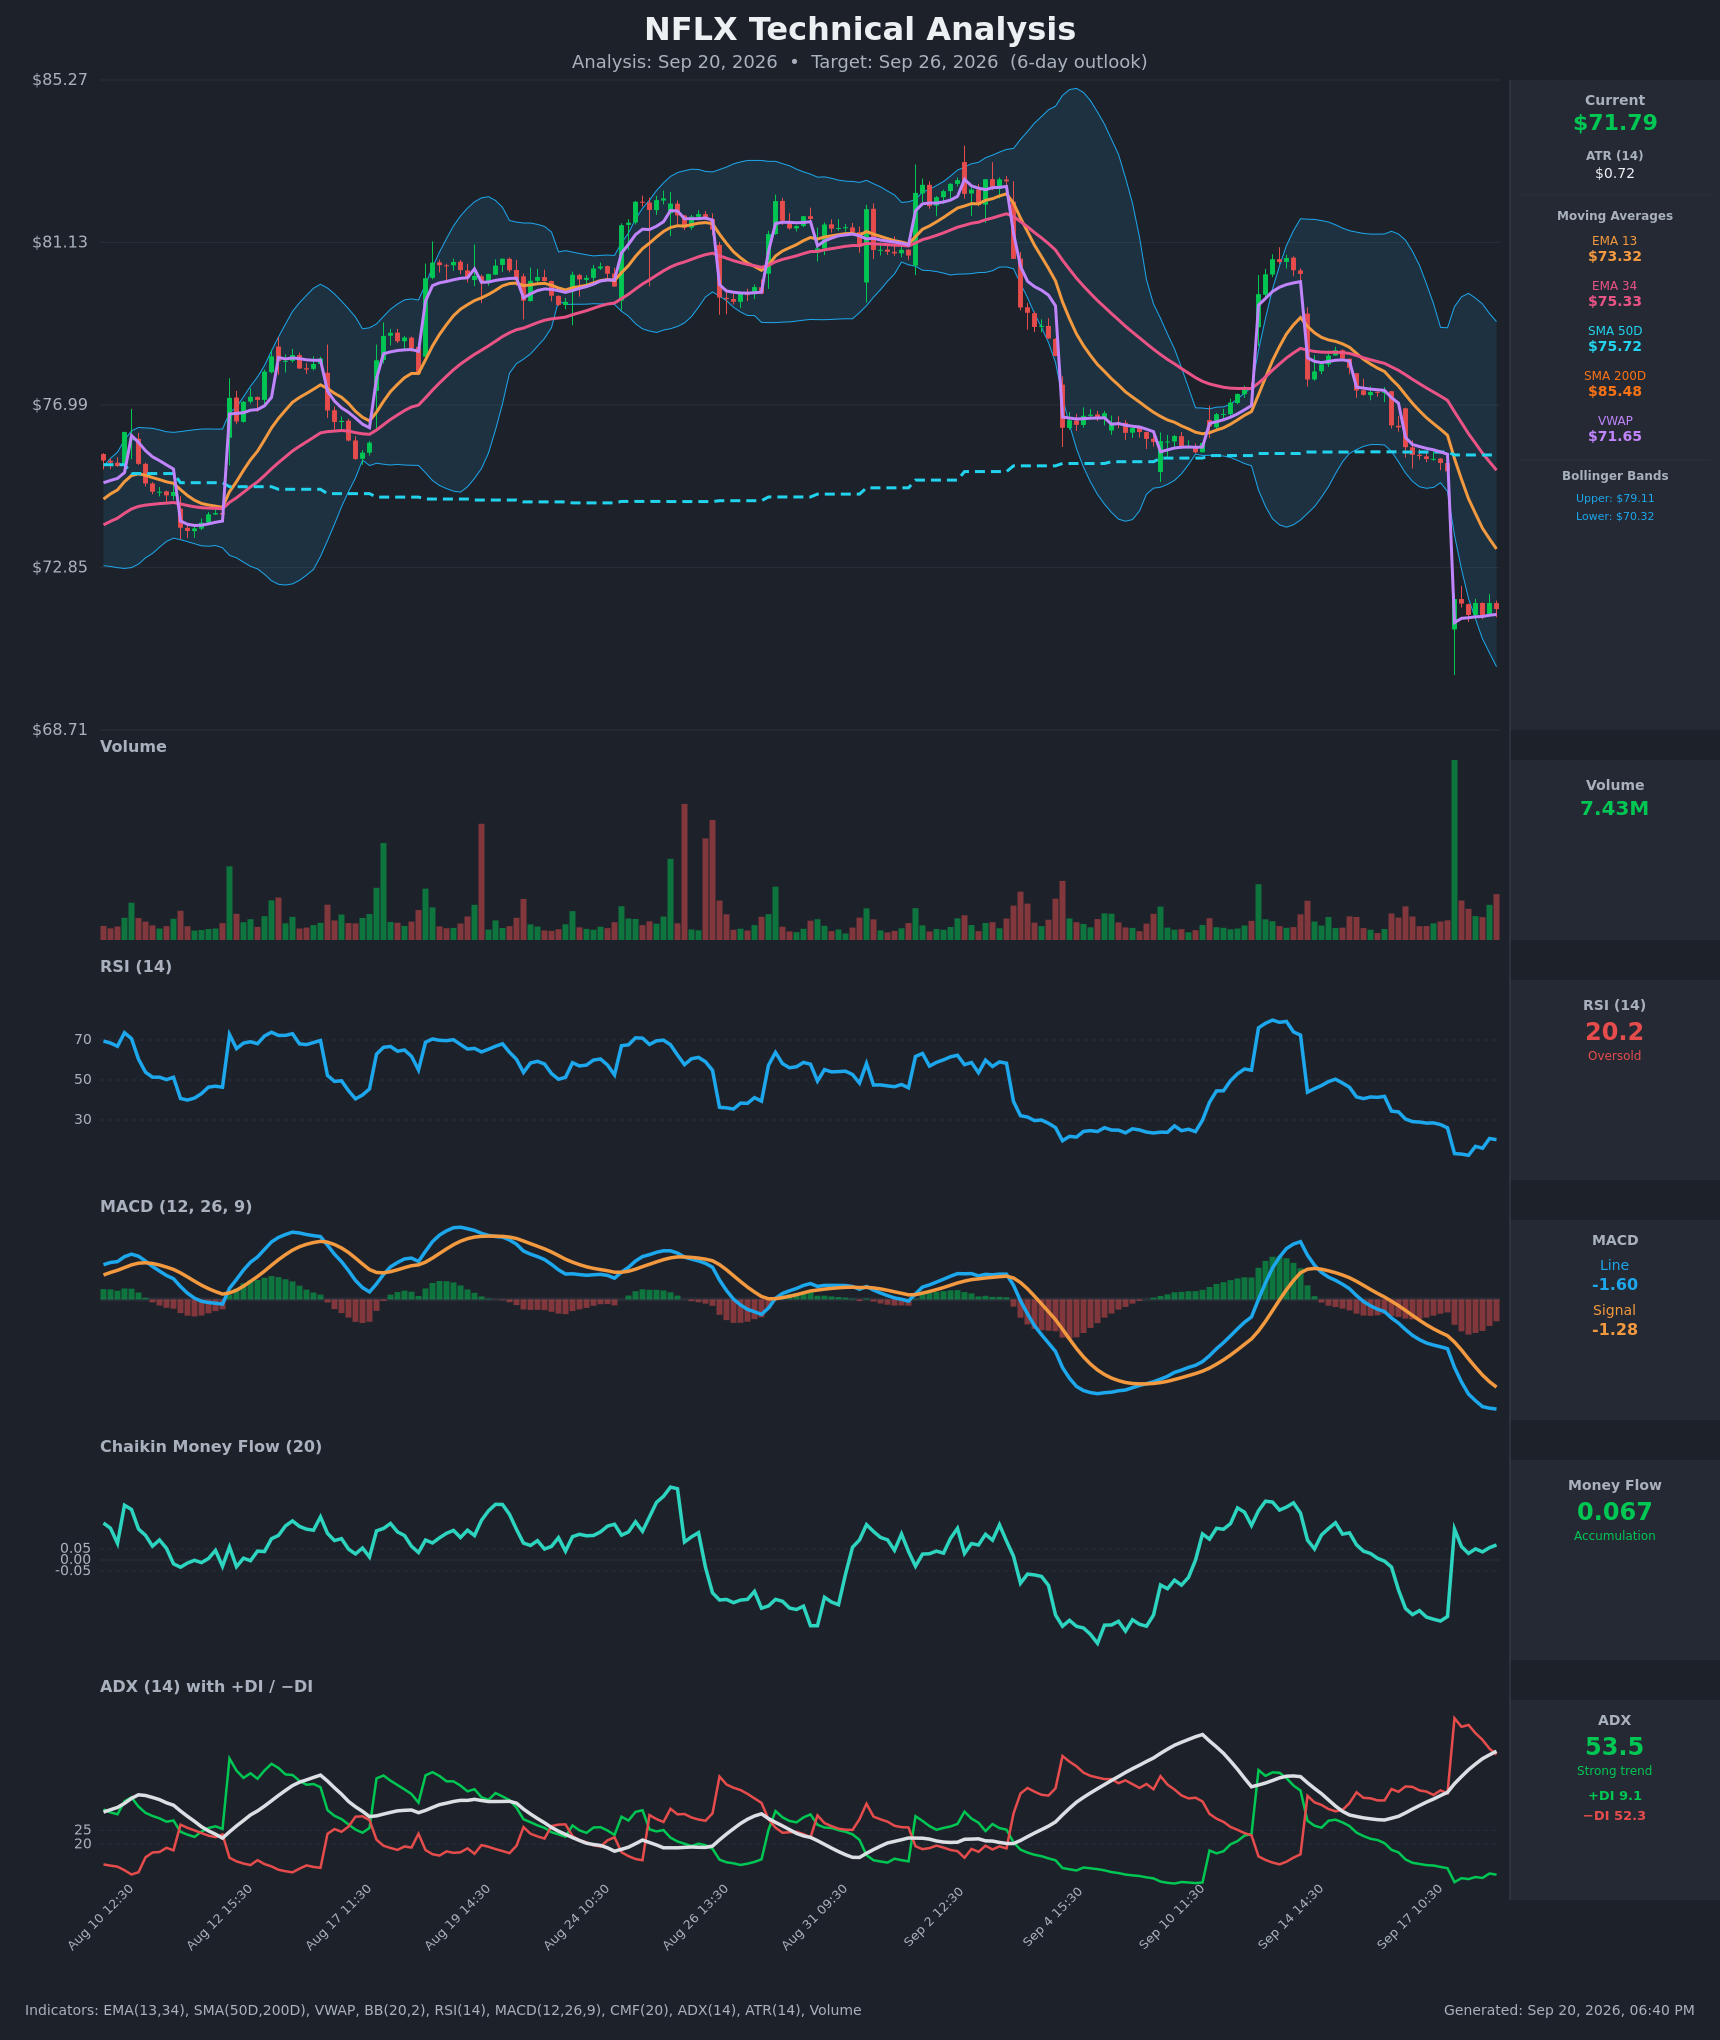
How the technicals shaped the strikes below: they pulled the short strikes of the range-bound structure downward, so its short call sits at $74 rather than at the $74.70 implied rail, and its short put sits at $69 rather than higher. Nothing else changed.
Full technical write-ups: 3-day report → · 5-day report →
4 · Three ways the next five days can go
If NFLX pushes above the call wall ($80.00): this would require an 11% rally in five days — far outside what the options market is pricing. What matters more practically is the space beneath it: there is no meaningful call-side open-interest barrier between spot and $80 for this expiration, so if price did reclaim the $75 gamma cluster, positioning offers little overhead friction until much higher. Heavy call open interest overhead tends to slow rallies; here there simply isn't any nearby.
If NFLX drifts between the walls: the $72 put wall sits essentially at spot and max pain for September 25 sits at $77 — far above. When the pin level is that far from price, the "expirations gravitate toward max pain" effect is generally weak; it would take a 7% rally to get there. The more plausible pinning story is the $72 put wall itself: that open interest has to be hedged, and concentration at a strike this close to spot often produces chop around it into Friday.
If NFLX breaks below the put wall ($72.00): this is the branch the estimated gamma regime speaks to. With the dealer-gamma estimate for this expiration negative, market-maker hedging in this state tends to amplify selling rather than cushion it — so a decisive break of $72 has less structural support beneath it than the open-interest map suggests, with the next price-structure shelves at $70.86 and $70.32 and the lower implied rail at $68.88. Treat the gamma framing as an estimate built on an assumed dealer sign convention, not observed inventory.
5 · Three defined-risk structures
Prices are end-of-day midpoints as of September 18, 2026. All structures are hypothetical. Verify live prices before trading — these will be stale by the open.
If you lean bearish: long put vertical (debit spread)
- Trade: Buy the September 25 $72 put, sell the September 25 $69 put
- Debit: $0.99 ($1.25 paid − $0.265 collected) · Max profit: $201 per spread · Max loss: $99 per spread · Break-even: $71.02
- Why it fits: With the premium gap negative — options priced about 3.2 vol points below what NFLX has actually delivered, thinner than roughly three-quarters of this stock's own recent readings — buying premium is the structurally favored side this week. The long strike sits exactly at the $72 put wall, so the trade is a direct bet that the level breaks; the short strike sits at $69, just inside the $68.88 lower implied rail, which is where the market is already pricing the move to end.
- Makes sense only if: you think Friday's gap was the start of a move rather than the end of one. Both chart models and the options positioning agree with that; the oversold readings and positive money flow in the technical reports argue against it.
- Invalidated if: NFLX closes above $73.76.
- Earnings exposure: Expires twenty-five days before the October 20 report — no earnings-gap risk.
- Managing it: Take profit at roughly 60–70% of maximum value rather than holding for the full $201 — the last dollar of a vertical is the slowest to arrive. Because the week's direction is running with the twenty-day trend and against nothing durable, there's no reason to hold past Thursday; close it there regardless. If NFLX reclaims $73.32, the technical thesis behind the trade is gone before the invalidation print.
- Liquidity note: the $72 puts quoted 4¢ wide on a $1.25 mid (about 3%) with 4,592 contracts traded; the $69 puts quoted a penny wide on 14,630 contracts. Both fill easily.
- Analyze this position →
If you expect the range to hold: iron condor, shaded lower
- Trade: Sell the September 25 $69 put / buy the $67 put, and sell the September 25 $74 call / buy the $76 call
- Credit: $0.44 · Max profit: $44 per condor · Max loss: $156 per condor · Break-evens: $68.57 and $74.44
- Why it fits: A condor collects a credit for the stock finishing between the short strikes. These rails bracket the implied range asymmetrically — the short call sits at $74, below the $74.70 upper rail, shaded toward the chart models' $70.50 target, while the short put sits at $69, effectively on the lower rail. It is a range trade with a downward lean rather than a symmetric one.
- Health warning: you're selling premium that hasn't been rich lately — the implied-versus-delivered gap is negative and in the bottom quarter of this stock's own recent readings, and IV rank is 11.92. That is the least attractive backdrop for a credit structure, and the $44-to-$156 payoff reflects it.
- Makes sense only if: you believe the post-gap consolidation the chart reports describe simply holds for five sessions — the third scenario in both write-ups, which they assign the lowest probability.
- Invalidated if: NFLX closes outside $68.57–$74.44 before expiration; at that point one side is in the money and the structure's math has turned.
- Earnings exposure: Expires twenty-five days before the October 20 report — no earnings-gap risk.
- Managing it: Close at roughly 50% of max credit; exit regardless by Wednesday, September 23 if price is pressing either short strike. With so little credit collected, there is no room to "manage" a tested side by rolling — close rather than hope.
- Liquidity note: the $69 puts and $67 puts each quoted a penny wide; the $74 calls quoted 2¢ wide on a $0.42 mid and the $76 calls a penny wide on $0.155. In percentage terms the wings look wide because the options are cheap — in dollars, one cent of slippage per leg is manageable, but a four-leg structure this thin gives back real edge to the spread.
- Analyze this position →
If you lean bullish: short put spread
- Trade: Sell the September 25 $71 put, buy the September 25 $69 put
- Credit: $0.52 · Max profit: $52 per spread · Max loss: $148 per spread · Break-even: $70.48
- Why it fits: A credit spread pays you up front and wins if the stock stays above the short strike. The bull case rests on the $72 put wall behaving like a floor rather than a trapdoor, plus the absorption signal both chart reports flag — positive money flow into the decline while momentum sits deeply oversold. The short strike sits a dollar below that wall and the break-even at $70.48 sits below the $70.86 swing shelf.
- Health warning: same as above — you're selling premium that hasn't been rich lately, and you're doing it against the direction of the positioning read.
- Makes sense only if: you're explicitly fading the bias, betting the oversold relief bounce the technical reports assign roughly a one-in-three chance to actually arrives.
- Invalidated if: NFLX closes below $70.32.
- Earnings exposure: Expires twenty-five days before the October 20 report — no earnings-gap risk.
- Managing it: Close at ~50% of max credit; exit regardless by Wednesday, September 23. If NFLX closes through $71, close rather than hope — with the estimated gamma regime negative for this expiration, a break below the put wall is the scenario where hedging flows work against you fastest.
- Liquidity note: the $71 puts quoted 3¢ wide on a $0.785 mid (about 4%) with 7,407 contracts traded; the $69 puts a penny wide. Fills are easy.
- Analyze this position →
If none of these: no trade
There is a straightforward case for standing aside. IV rank at 11.92 means option prices are near the bottom of their one-year range, and the premium-versus-delivered gap is negative — so the credit structures above are paid poorly for real risk, which is why both carry health warnings. That argues for the debit spread instead, but the debit spread has its own problem: it needs a directional move to arrive inside five sessions, and the same technical reports that confirm the bearish direction also describe an oversold, absorbing tape where the most likely near-term outcome is a shallow bounce before continuation. Paying $99 for a five-day window to be right about timing as well as direction is a real ask. If you can't articulate why the $72 put wall breaks this week rather than next, waiting for either a decisive break of $72 or a reclaim of $73.76 — and trading the resolution instead of the coil — costs nothing.
6 · Quick FAQ
What is NFLX's expected move this week? ±$2.91 (±4.06%) into the September 25 expiration, framing a $68.88–$74.70 range, per the options market's straddle pricing as of September 18, 2026.
Is NFLX expected to go up or down over the next five days? Options positioning as of September 18 leans mildly bearish — put open interest built 38% in five days and 25-delta puts flipped from cheaper-than-calls to 1.1 vol points richer — but that's a read of what traders have done, not a forecast. The actionable map is the $68.88–$74.70 range and the $72.00 / $80.00 levels.
Are NFLX options expensive right now? IV rank 11.92/100 says option prices are lower than about 88% of the past year's readings; on top of that, they're running roughly 3.2 vol points below the movement NFLX has actually delivered — thinner than about three-quarters of this stock's own recent readings. The verdict: this is a week to own premium rather than sell it, with the caveat that implied volatility in expirations past October 16 is elevated for a scheduled reason (the October 20 report), not because it's free.
When is NFLX's next earnings report? October 20, 2026, after the close — after every expiration in the ladder above, which is why the implied move jumps from ±8.85% at the October 16 expiration to ±13.16% at October 23.
Where is NFLX's biggest options support and resistance? For the September 25 expiration: put wall $72.00, call wall $80.00. Across the full chain the heaviest put strike is $65.00 instead — the near-dated hedges sit much closer to spot than the longer-dated ones.
What invalidates this week's read? A close above $73.76.
Methodology & disclosures. Data: end-of-day options-chain snapshot for NFLX, 2026-09-18, generated 2026-09-20T18:40:49.294Z. Prices shown are midpoints and will differ from live markets. Momentum/positioning scores and volatility-premium comparisons are descriptive measurements of past option flow and past price movement — not investment advice, signals, forecasts, or guarantees. Earnings dates and reported results are from the data provider's earnings feed as of 2026-09-20T18:40:49.294Z; report dates can change. All trade structures are hypothetical. Every structure shown has a defined maximum loss; you can lose the entire max-loss amount. Options involve substantial risk and are not suitable for all investors.