NIO Options Are Pricing a $0.39 Move — But Every Wall Sits at $4.00
NIO's options chain has quietly turned call-heavy while the stock sits 3% off its 52-week low, and the entire September 18 expiration — call wall, put wall and max pain — is stacked on a single $4.00 strike. Here's the implied range, the level map, and three defined-risk ways to trade a four-day window.

The options market implies a $3.30–$4.08 range into the September 25 expiration, the whole September 18 expiry is pinned to one $4.00 strike, and option premium is about as cheap as it gets for this name — here's what's driving it and three defined-risk ways to trade the next four days.
Published Sunday, September 13, 2026 · Data as of Friday, September 11 close
Explore the live NIO options data in the Detailed Options Analyzer →
Quick answer
| Item | Answer |
|---|---|
| Market bias | Slightly bullish |
| Options-implied range (into September 25, the nearest rung the chain could price) | $3.30 – $4.08 (±10.51%, or ±$0.39 around the $3.69 close) |
| Major support | $3.57 (52-week low) — note the September 18 put wall sits above spot at $4.00 |
| Major resistance | $4.00 (September 18 call wall) |
| Max pain (September 18) | $4.00 |
| Dealer gamma regime (estimate) | Positive — market-maker hedging tends to dampen moves; flip level ≈ $3.00 |
| Volatility condition | Falling — IV rank 6/100 · premium thin: options are priced about 6.6 vol points above delivered movement, which is a slimmer cushion than 72% of this stock's own recent readings |
| Technical check | Confirms (bullish, 2-day and 4-day models) |
| Best-fitting strategy | September 18 $3.50/$4.00 call debit spread |
| Analysis invalidated if | NIO closes below $3.57 |
1 · What matters today
NIO closed Friday, September 11 at $3.69, just 3.4% above its 52-week low, after a month that took 18% off the share price. The options chain, though, has quietly stopped acting scared. For every 100 call contracts traded on Friday, only about 18 puts changed hands — against roughly 27 over the past two weeks — and open call interest grew by nearly 21,000 contracts while puts shrank. That call-tilted flow, plus a positioning read that has been climbing while price fell, is why our read leans slightly bullish rather than neutral.
The map is unusually simple: the September 18 expiration's heaviest call open interest, its heaviest put open interest, and its max pain strike all sit at $4.00. Options price a $3.30–$4.08 range into September 25. Two chart models also lean bullish over the same window. A close below $3.57 kills the thesis outright.
2 · What the options market is pricing
What changed this week
Price did the bleeding and the chain did the opposite. NIO fell 4.40% over the trailing five sessions and 18% over twenty, then gapped up 3.07% on Friday — opening at $3.69 from a $3.58 prior close and closing right there. Implied volatility (the market's estimate of how much NIO will move, baked into option prices) fell 8.56% in a single day, is down 4.76% over five sessions and down 19.9% over thirty. IV rank finished at 6.47/100 against a 14-day average of 14.1 — option prices are cheaper than at any point in almost a year.
Underneath, the money moved to the call side. Put/call open interest slipped from 0.36 to 0.34 over five days; put/call volume printed 0.18, versus a 14-day average of 0.27. The single biggest open-interest change in a live contract was the October 16 $4.00 calls, which added 11,223 contracts to reach 23,554 open on 3,010 traded and about $36,000 of premium — traders building a position at the same $4.00 strike that dominates every other expiration. (Into Friday's settled expiry, by contrast, the $4.50 puts shed 3,051 contracts of open interest — history, not a live level.) Total option volume ran only 0.46× its 20-day average, so this was a quiet tape, not a stampede.
One honest tension: the short- (about a week), medium- (about a month) and long-term (about two and a half months) trend reads all point the same way — down, with price off 4.4%, 18% and 25.6% over those windows. The flow has turned before the tape has. A momentum crossover on September 4 marked the first bullish turn in that series since late August, and it has not yet been confirmed by price.
Expected move
The expected move — the move the options market is pricing in, derived from what straddles cost — could not be computed for the September 18 expiration itself: the $3.50 call and $3.50 put implied volatilities disagreed badly (31.7% versus 47.0%), which means at least one quote is unreliable, so that rung is left unpriced rather than blended into a number no market is showing. The same applies to October 2. The nearest clean rung is September 25:
| Expiration | Implied move | Range around $3.69 |
|---|---|---|
| September 25 (14 days) | ±10.51% | $3.30 – $4.08 |
| October 9 (28 days) | ±11.04% | $3.28 – $4.10 |
| October 16 (35 days) | ±15.57% | $3.12 – $4.26 |
Note how little the ladder widens between two weeks and four weeks — an extra fortnight of calendar time buys barely half a percentage point of implied range — and then jumps at October 16. That step is where the chain's open interest is concentrated, not an event hump; there is no scheduled earnings date in this data to explain it.
Volatility
At-the-money implied volatility sits at 46.19%, against a 30-day average of 54.8% and a 90-day average of 58.5%. IV rank is 6.47/100 — meaning today's IV is cheaper than roughly 94% of the past year's readings — and the IV percentile is under 1. The front-month read is unavailable today (Friday was an expiration day, so a same-day-expiring contract can't be used to interpolate the front tenor), which also leaves the term-structure comparison blank for this snapshot.
Realized volatility — how much NIO has actually been moving — is 39.6% over twenty days and 38.7% over ten, both about typical for this stock versus its own recent history. The 5-day/20-day realized ratio is 0.99, which is to say movement is neither accelerating nor decaying; the stock is falling at a steady, unremarkable pace.
Premium: thin, not rich. The volatility risk premium — the gap between how much movement options are priced for and how much NIO has actually delivered — sits at about 6.6 vol points (46.2% implied against 39.6% realized). When that gap is positive, option sellers have been collecting more than realized movement cost them. But the level matters: this reading lands in the 28th percentile of this stock's own recent history, meaning today's cushion is thinner than about 72% of those readings, and the gap-versus-its-own-norm measure is unusually depressed for this name. The path is stark — that premium was 35 vol points on August 28 and 13.9 as recently as September 10 before Friday's IV collapse halved it. Combine IV rank 6/100 with a 28th-percentile premium and the verdict is clean: this is a week to own option premium, not to sell it.
Skew and sentiment
Skew — the fact that puts and calls the same distance from the stock price don't cost the same — is doing something extreme here, and it deserves a caveat. The 25-delta call is marked at 165.8% implied volatility against 44.6% for the 25-delta put: a 121 vol-point gap in favor of calls, versus a 60-day norm of roughly 15 points. Read literally, nobody is paying up for crash protection; they're paying up for upside. Read carefully, a large part of that number comes from penny-quoted out-of-the-money calls ($4.50 and $5.00 strikes marked at one cent) where any implied volatility solver produces silly figures. The direction of the signal is corroborated by the flow, which is why it's worth quoting at all — but don't treat the magnitude as tradeable.
The cleaner sentiment reads agree. Put/call volume at 0.18 is unusually call-tilted even for this name's own baseline. Sentiment in short-dated options — the model's read of directional lean bucketed by time to expiry — prints +44 in the 0–7 day bucket, +34 in the 7–30 day bucket and +72 in the 30–60 day bucket, with the overall regime labelled broadly bullish; the 7-day averages for those same buckets are +18, +19 and +37, so today's reading is a step up, not a steady state. Net new open interest was call-side by a wide margin (+20,776 calls against −2,876 puts) — an unusually heavy day of call building versus this stock's own norm.
Our leading positioning read — built only from flow, skew and term-structure inputs, with lagging price trend deliberately excluded — printed 78 out of 100 and is flagged as a bullish divergence: over the trailing ten sessions price fell about 18% while that score climbed roughly 100 points. These are conditions that have historically preceded a turn, not a confirmed turn.
The key levels map
| Level | Price | Why it matters |
|---|---|---|
| 200-day moving average | $5.17 | 28.7% above the close — the long-term trend line is nowhere near |
| Swing resistance cluster | $4.46 – $4.94 | Heuristic swing-pivot levels from recent price structure |
| 50-day moving average | $4.54 | 18.8% overhead |
| Second call shelf (September 18) | $4.50 | 12,138 calls open — the next pile above the wall |
| 20-day moving average | $4.19 | 12% overhead; first trend level a rally would meet |
| Top of implied range (Sept 25) | $4.08 | One standard deviation up, per straddle pricing |
| Call wall, put wall and max pain (September 18) | $4.00 | 47,036 calls and 7,940 puts open at this one strike for the target expiry; chain-wide it holds 156,068 calls and 67,396 puts and is by far the largest gamma strike |
| 2-day model resistance | $3.71 | Top of the current consolidation per the chart model |
| Friday's close / spot | $3.69 | Also Friday's gap-open level |
| 2-day model support | $3.66 | Short-term moving-average shelf |
| Gap origin | $3.58 | Thursday's close, left unfilled by Friday's gap up |
| 52-week low / 4-day model support | $3.57 | The line that decides whether this is a base or a pause |
| Nearest put shelf below spot (September 18) | $3.50 | 2,608 puts open — the only real downside option structure inside the week |
| Bottom of implied range (Sept 25) | $3.30 | One standard deviation down |
| Gamma flip level (estimate) | $3.00 | One rough estimate suggests hedging flips from cushioning to amplifying below here |
The headline oddity: for the September 18 expiration, the heaviest call strike and the heaviest put strike are the same strike, $4.00 — and so is max pain. The chain-wide aggregate agrees. There is no options-derived floor beneath the stock this week; $4.00 is a magnet above, not a ceiling with a matching trapdoor below.
Positioning and unusual flow
The dealer gamma estimate for the September 18 expiration is positive, matching the whole-chain read — under the model's assumed sign convention, market-maker hedging in this regime tends to dampen moves rather than amplify them, which is consistent with a stock that has been grinding rather than crashing. Treat it as an estimate built on assumed dealer inventory, not observed positioning.
Three live flow items stood out. The September 25 $3.50 calls traded 1,768 contracts against 804 open — more than two contracts traded for every one held — for about $50,000 of premium, the single largest live premium print of the day. The October 30 $3.50 calls traded 601 contracts against just 1 contract of open interest, roughly $22,000 of brand-new positioning in a strike that barely existed on Thursday. And the October 16 $4.00 calls saw that 11,223-contract open-interest build noted above. Every one of them is a call, and every one of them is struck at or below $4.00.
3 · Technical check (the 20%)
Both chart models lean the same way the options flow does. The 2-day model is bullish with a target of $3.74 and a projected range of $3.63–$3.77, built on a strong money-flow reading (CMF 0.447, accumulation), a bullish short-EMA stack and ADX at 28.4 with the positive directional line clearly on top. It flags a tight Bollinger squeeze under $3.70–$3.71 as a coiled setup and names $3.66 as support, $3.71 as resistance.
The 4-day model, whose target date is the September 18 expiration this article is built around, is also bullish: target $3.76, projected range $3.58–$3.80, support $3.57, resistance $3.76. Its supporting evidence is a MACD crossover from deeply negative territory and an RSI recovery off oversold — but it carries an explicit warning that money flow on the longer window is still at −0.285 (distribution) and that price remains far below its 50-day ($4.54) and 200-day ($5.17) averages. Both reports classify this as a counter-trend bounce inside a bigger downtrend, which is exactly how we'd characterise the options read too.
Both TA targets sit comfortably inside the options-implied range, so this is confirmation, not divergence — but of magnitude, barely any. The chart models are arguing over eight cents while the options market is pricing seventy-eight. That gap is why the structures below are built with defined maximum losses and strikes taken from the option walls rather than from the TA targets; the technical read raised confidence in the direction, not in the size.
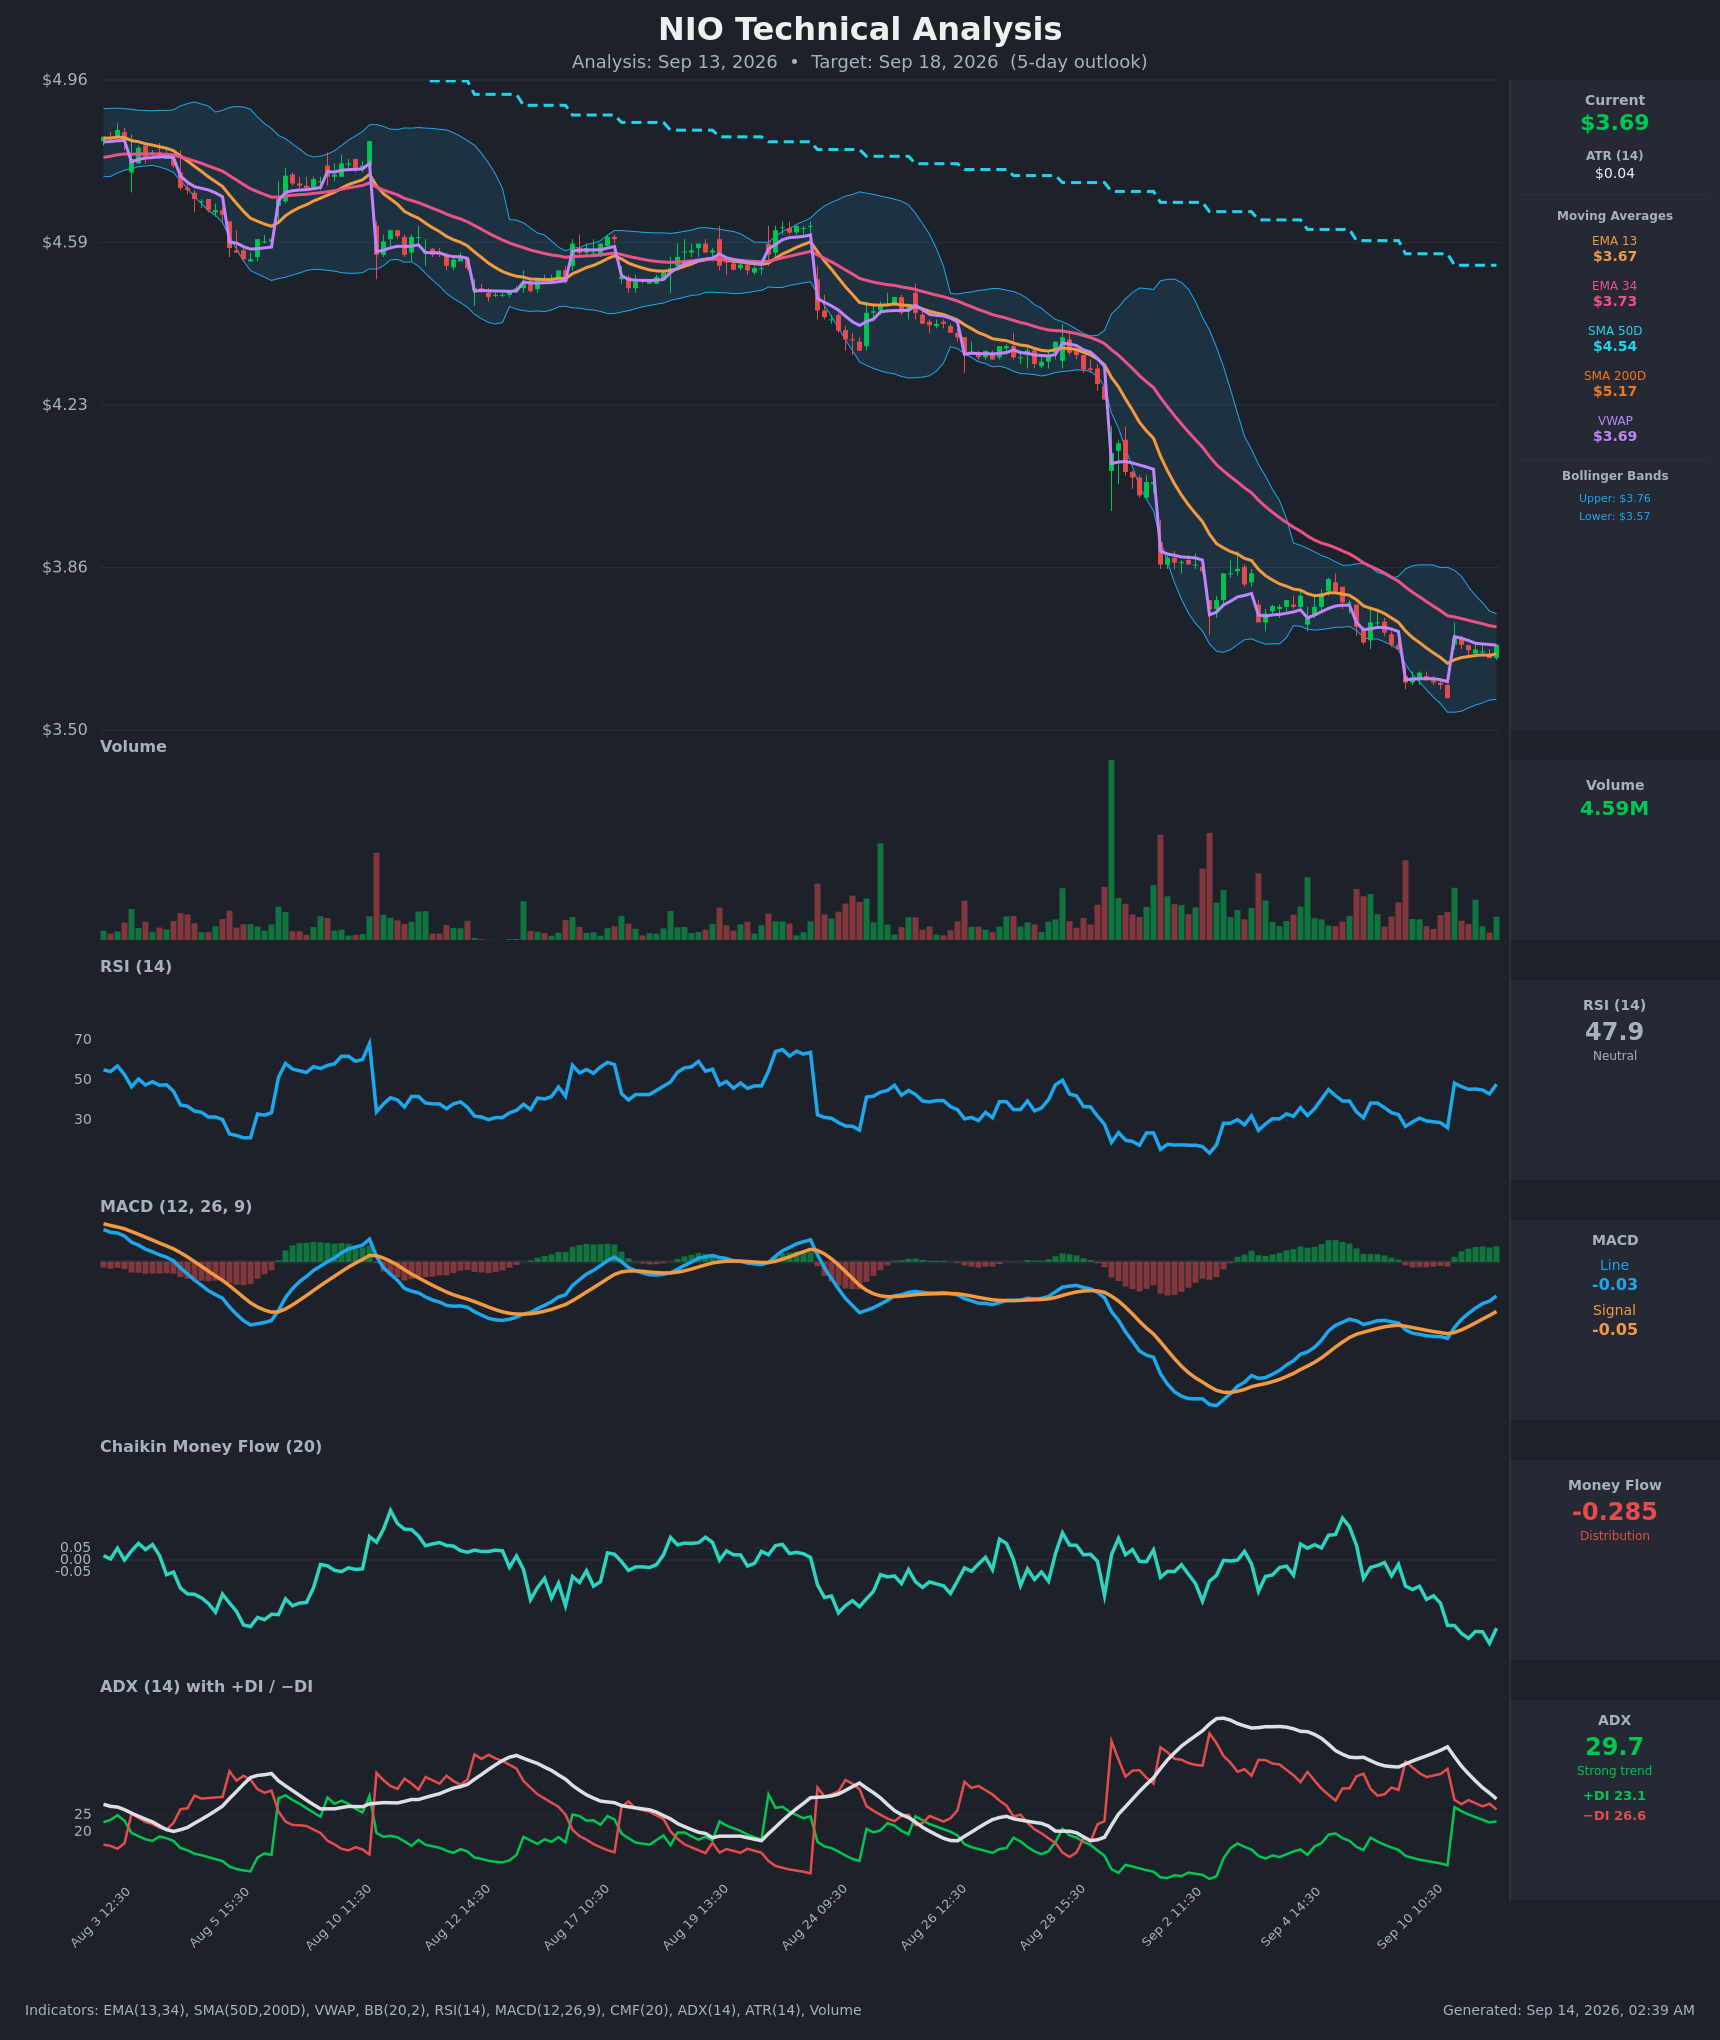
Model vs. Market: The options market implies $3.30–$4.08 into September 25; the 4-day technical model targets $3.76 with a $3.58–$3.80 band. The chart says "small bounce"; the chain says "a move of either sign is affordable right now" — which argues for paying for optionality rather than selling it.
Full technical write-ups: 2-day report → · 4-day report →
4 · Three ways the next four days can go
If NIO pushes above the call wall ($4.00): 47,036 calls are open at that strike for September 18 and more than 156,000 across the chain. The heaviest call open interest overhead tends to slow rallies as hedging flows lean against them, and with the dealer gamma estimate positive, that damping is the base case. Above $4.00 the positioning thins quickly — the next markers are the implied-range top at $4.08 and the 20-day moving average at $4.19.
If NIO drifts between the levels: this is the pin case, and it is unusual because max pain sits above spot at $4.00 rather than below. Expirations sometimes gravitate toward the price where the most option value expires worthless, and with 47,036 calls and 7,940 puts stacked there, the gravitational centre for September 18 is an 8.4% rally away. A quiet week that drifts from $3.69 toward $3.85–$4.00 is fully consistent with the positioning.
If NIO breaks below $3.57: there is no put wall underneath to catch it — the heaviest put strike below spot for this expiration is $3.50, holding only 2,608 contracts. Below the 52-week low the level map is effectively empty until the implied-range floor at $3.30. Spot currently sits about 19% above the estimated gamma flip level of $3.00, a smaller cushion than this stock usually carries, and one rough estimate suggests hedging below that line amplifies selling rather than cushioning it. That is the tail this thesis is exposed to.
5 · Three defined-risk structures
Prices are end-of-day midpoints as of Friday, September 11. All structures are hypothetical. Verify live prices before trading — these will be stale by the open.
A note on this chain before the trades: NIO strikes are spaced $0.50 apart, which is 13.5% of the share price, and most out-of-the-money contracts are quoted a penny or two wide. Every structure below is a debit — you pay, you can't lose more than you paid — which is the right family when premium is this thin, but the bid-ask is a meaningful share of the edge in all three.
If you lean bullish: September 18 $3.50/$4.00 call debit spread
- Trade: Buy the September 18 $3.50 call, sell the September 18 $4.00 call
- Debit: $0.195 ($19.50 per spread) · Max profit: $30.50 · Max loss: $19.50 · Break-even: $3.695
- Why it fits: this is the walls trade. You buy at the strike where the flow is building and cap at the strike that is simultaneously call wall, put wall and max pain — there is no structural reason to pay for anything above $4.00 this week. Note what you're actually paying: with the stock at $3.69, $0.19 of the $0.195 cost is intrinsic value, so you're buying a roughly 77-delta position for about half a cent of time premium. That is what IV rank 6/100 buys you.
- Makes sense only if: you accept that the 52-week low is four cents below the break-even, so there is no margin for a bad open.
- Invalidated if: NIO closes below $3.57.
- Managing it: because it is nearly all intrinsic, this behaves like stock with a cap — take profits into any touch of $3.95–$4.00 rather than waiting for full expiry value, and cut if the $3.57 low breaks. Four days is short, and the short- versus long-term trend reads disagree, so earlier is better than later.
- Liquidity note: the $3.50 calls traded 1,372 contracts Friday at $0.19/$0.23 — four cents wide, about 19% of the mid — and the $4.00 calls are penny-wide on 3,214 contracts. Assume a real fill nearer $0.21 than $0.195 and re-run the math before sending it.
- Analyze this position →
If you expect the range to hold: September 18 $3.50/$4.00/$4.50 call butterfly
- Trade: Buy one September 18 $3.50 call, sell two September 18 $4.00 calls, buy one September 18 $4.50 call
- Debit: $0.19 ($19.00) · Max profit: $31.00 (at exactly $4.00 at expiry) · Max loss: $19.00 · Break-evens: $3.69 and $4.31
- Why it fits: this is the max-pain expression. It pays most if September 18 settles at the strike where every wall and the max-pain calculation converge, and because the wings are penny options it costs essentially the same as the plain vertical above. A debit butterfly is also the honest structure when premium is thin — you're buying the pin, not selling volatility that hasn't been rich lately.
- Makes sense only if: you think the drift toward $4.00 is more likely than a clean break through it; above $4.31 this loses where the vertical would have been at max profit.
- Invalidated if: NIO closes below $3.57.
- Managing it: butterflies do most of their work in the last 48 hours; don't expect to be rewarded for holding one at 4 DTE, and take anything above 60% of max value if the stock parks near $4.00 early.
- Liquidity note: the $4.50 calls are quoted at a penny with 12,138 contracts open and 337 traded — fillable, but four legs on penny quotes means slippage can eat a fifth of the theoretical edge. Work the order as a package.
- Analyze this position →
If you lean bearish: September 18 $3.50/$3.00 put debit spread
- Trade: Buy the September 18 $3.50 put, sell the September 18 $3.00 put
- Debit: $0.015 ($1.50 per spread) · Max profit: $48.50 · Max loss: $1.50 · Break-even: $3.485
- Why it fits: this is the cheap expression of the tail the bullish case ignores — a break of the $3.57 52-week low into a zone with essentially no put open interest, heading toward the $3.30 implied-range floor and, further down, the $3.00 gamma flip estimate. At IV rank 6/100 the market is charging almost nothing for that possibility.
- Makes sense only if: you treat it as a lottery ticket or a hedge against one of the structures above, not as a thesis. It needs a 5.8% drop in four days just to break even.
- Invalidated if: NIO closes back above $3.80 (the top of the 4-day chart model's projected band), at which point the downside case has failed within the window.
- Managing it: there is nothing to manage at $1.50 of risk — either the low breaks or the ticket expires. Do not add to it mid-week.
- Liquidity note: the $3.50 puts traded 285 contracts at $0.02/$0.03 against 2,608 open; the $3.00 puts are marked at a penny bid and offered on 31 contracts of volume. Getting the $0.015 midpoint is optimistic — even paying $0.03 leaves a 15-to-1 payoff, but size accordingly.
- Analyze this position →
If none of these: no trade
There is a strong case for standing aside here, and it isn't the usual one. Premium is cheap, so the "don't sell cheap options" argument does the work of eliminating credit structures — with the volatility risk premium in the 28th percentile of its own recent readings, collecting $0.02 to risk $0.48 on a condor is not a trade, it's a donation. But the debit side has its own problem: strikes are spaced $0.50 apart on a $3.69 stock, so every structure is either nearly all intrinsic or nearly all lottery, with no middle ground to express a modest view. Add penny-wide quotes where the spread can be 20–40% of the mid, and four days of calendar time, and the honest answer for many accounts is that the edge doesn't survive the friction. Waiting for the September 25 expiration — which the chain can actually price, and which gives the positioning divergence room to resolve — is a legitimate alternative to all three.
6 · Quick FAQ
What is NIO's expected move this week? ±$0.39, or ±10.51%, into the September 25 expiration — a $3.30–$4.08 range around the $3.69 close, per the options market's straddle pricing as of September 11. The September 18 rung could not be priced: its call and put implied volatilities disagreed too much for the quotes to be trusted.
Is NIO expected to go up or down over the next four days? Options positioning as of September 11 leans slightly bullish — call volume is running four-to-one over puts, open call interest is building at $4.00 across multiple expirations, and our positioning read has been rising while price fell — but that is a description of what traders have done, not a forecast. The actionable map is the $3.30–$4.08 range, the $4.00 wall above and the $3.57 line below.
Are NIO options expensive right now? No. IV rank of 6/100 says option prices are lower than about 94% of the past year's readings; on top of that, they're running only about 6.6 vol points above the movement NIO has actually delivered — a thinner cushion than 72% of this stock's own recent readings. That combination favors owning premium rather than collecting it.
Where is NIO's biggest options support and resistance? For September 18, the call wall is $4.00 (47,036 contracts) and the put wall is also $4.00 (7,940 contracts) — the same strike is both, which means there is no options-derived floor below spot. The nearest put shelf underneath is $3.50, and the structural line is the 52-week low at $3.57.
What invalidates this week's read? A close below $3.57. Below the 52-week low there is no meaningful put open interest until $3.50 and no implied-range support until $3.30.
Methodology & disclosures. Data: end-of-day options-chain snapshot for NIO, 2026-09-11, generated 2026-09-14T02:39:16Z. Prices shown are midpoints and will differ from live markets. Momentum/positioning scores and volatility-premium comparisons are descriptive measurements of past option flow and past price movement — not investment advice, signals, forecasts, or guarantees. All trade structures are hypothetical. Every structure shown has a defined maximum loss; you can lose the entire max-loss amount. Options involve substantial risk and are not suitable for all investors.