NOK Options Price a $0.69 Move Into Nov 13 — Positioning Says Range, the Charts Say Lower
NOK options imply a $6.97–$8.35 range into the November 13 expiration, with the heaviest open interest stacked above the stock at $8.00 and $8.50. Here is why our read is neutral, why premium is cheap, and three defined-risk ways to trade it.
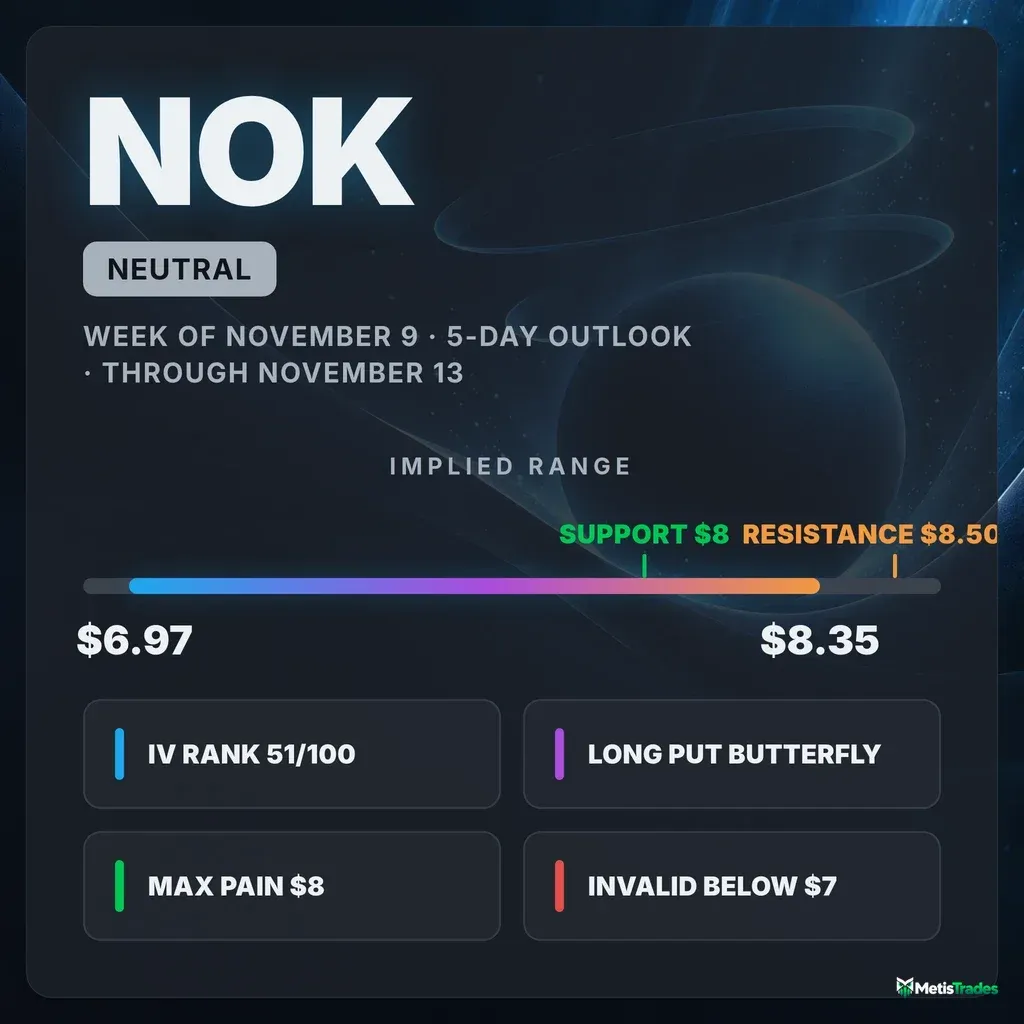
The options market implies a $6.97–$8.35 range for NOK into the November 13 expiration. This article covers what is driving that range and three defined-risk ways to trade it while premium is cheap.
Published Sunday, November 8, 2026 · Data as of Friday, November 6, 2026 close
Explore the live NOK options data in the Detailed Options Analyzer →
Quick answer
| Item | Answer |
|---|---|
| Market bias | Neutral |
| Options-implied range (into Nov 13) | $6.97 – $8.35 (±$0.69, ±8.98%) |
| Major support | $8.00 put wall for the Nov 13 expiration. It sits above the $7.66 close, so treat it as a level to reclaim rather than a floor. Nearest chart support is $7.46. |
| Major resistance | $8.50 call wall (Nov 13 expiration) |
| Max pain (Nov 13) | $8.00 |
| Dealer gamma regime (estimate) | Positive for the Nov 13 expiration, so hedging tends to dampen moves. The whole-chain estimate is negative, so hedging can amplify moves further out. Flip level: n/a (not available in today's data). |
| Volatility condition | Neutral. IV rank 50.6/100 · premium thin: options are priced ~25 vol pts below the movement NOK has actually delivered. |
| Technical check | Mixed. The chart model is bearish on both the 3-day and 5-day views, with a $7.50 target that sits inside the implied range. |
| Best-fitting strategy | Nov 13 $7/$7.50/$8 long put butterfly (debit), if price stays contained |
| Analysis invalidated if | NOK closes below $7.00 |
1 · What matters today
NOK has dropped 10.5% in five sessions and 26% in a month. Even so, the options market is not positioned for a collapse into November 13. It is pricing a move of about $0.69 either way, a range of $6.97 to $8.35. The heaviest open contracts for that expiration sit above the stock, at $8.00 and $8.50. That is where the short-term pull runs, while the bigger trend still points down. Put those together and our read is neutral: a range-bound five days, not a straight-line breakdown.
Options are also cheap relative to how violently NOK has actually been moving, which favors buying defined-risk structures over selling premium. The level that changes the picture is $7.00: a close below it means sellers have broken through the implied floor. The chart-based model leans lower ($7.50 target), but its target still sits inside the range the options are pricing.
2 · What the options market is pricing
What changed this week
The stock fell 10.5% over five sessions to a $7.66 close. A gap down on November 5 (from $8.26 to a $7.89 open) did most of the damage, and a small gap up on Friday, November 6 only partly repaired it.
Volatility. At-the-money implied volatility rose 9.7% over the five sessions, then eased 3.7% on Friday.
Put-call activity. Put trading picked up. The put/call volume ratio (how much put activity there is relative to calls; above 1 means puts dominate) printed 0.38. That compares with a 7-day average of 0.36 and a 14-day average of 0.34, and it is well above this name's 60-day median of 0.28. Open interest (contracts currently held open) moved the other way: the put/call OI ratio slipped to 0.37 from a 7-day average of 0.385. New money went to calls on the day, with call open interest up about 25,300 contracts while put open interest fell about 5,500.
Biggest OI change. The December 18 $8 calls added 10,908 contracts, rising to 13,425.
Flow tone. Our read of options flow swung hard negative, to −41 against a 7-day average of −6. Most of that came from the price drop itself and a jump in put pricing, not from fresh bearish bets. The short- and long-term trend reads all point the same way, down, over the past week, month, and two months. A brief bullish turn in flow on October 28 failed within days.
Expected move
The expected move is the move the options market is pricing in, derived from what straddles cost. Into November 13 it is ±$0.69 (±8.98%) around $7.66, which gives a range of $6.97–$8.35.
| Expiration | Implied move | Range around $7.66 |
|---|---|---|
| Nov 13 | ±8.98% | $6.97 – $8.35 |
| Nov 20 | ±12.53% | $6.70 – $8.62 |
| Nov 27 | ±13.21% | $6.65 – $8.67 |
| Dec 4 | ±16.66% | $6.38 – $8.94 |
The ladder widens smoothly with time, with no sudden step-up between rungs. The market is not bracing for a specific dated event inside this window, just for NOK's ongoing high-volatility tape.
Volatility
Implied volatility (IV) is the market's estimate of how much NOK will move, baked into option prices. At-the-money IV is 60.53%. IV rank is 50.6/100, meaning today's IV is cheaper than about 49% of the past year's readings. In other words, it is dead middle of its range (the IV percentile of 54 says the same thing).
IV sits slightly below its 30-day average (61.3%) and further below its 90-day average (65.1%). It is down 6.4% over 30 sessions. The front-month vs. 60-day comparison is unavailable today (expiry day), since November 6 options expired at Friday's close. Realized volatility is the bigger story. NOK's 20-day realized volatility of about 86% is running well above this stock's own recent norm. Here, "unusually high" means unusual for NOK, not versus the broader market.
Premium is cheap, not rich. The volatility risk premium is the gap between how much movement options are priced for and how much NOK has actually delivered. When it is positive, option sellers have been collecting more than realized movement cost them. Right now it is negative: options are priced about 25 vol points below the movement NOK has delivered over the past 20 days. The VRP percentile, where today's gap sits versus this stock's own recent readings, is 9/100. Premium is richer than only 9% of NOK's recent readings, which is about as thin as it gets for this name.
The gap turned negative on October 22 and has stayed between roughly −22 and −30 points ever since. That reflects a run of selloff gaps inside the realized window, not a one-day blip. Put an average IV rank together with a 9th-percentile premium and the setup favors owning premium through defined-risk debit structures this week rather than selling it.
Skew and sentiment
Skew means puts and calls the same distance from the stock price don't cost the same. When puts are pricier, traders are paying up for crash protection. Right now 25-delta puts carry about 74.1% IV against 59.7% for comparable calls. That is a gap of roughly 14.4 vol points in favor of puts, against a 60-day norm of about −3.6 (calls usually price slightly richer on NOK). That is an unusually steep tilt for this stock, and it jumped almost entirely within the last five sessions.
After a 26% monthly slide, we read this mainly as holders insuring what they have left. That is a protective reflex rather than a fresh short campaign, as the put-OI decline and the closing of large deep in-the-money put positions in December and January suggest.
Shorter-dated options tell a different story than longer-dated ones. Sentiment in options expiring within a week reads +56 (bullish, with calls building), against a 7-day average of +29. The 7–30 day bucket reads +40 against a 20 average. The 30–60 and 60–120 day buckets lean bearish at −25 and −26. Traders have a name for this split, a "bullish blow-off" pattern: a leveraged front-end chase of short-dated calls while longer-dated positioning stays defensive. Overall option volume was light, at only 0.41× its 20-day average, so Friday's tone came from a thin session.
The key levels map
| Level | Price | Why it matters |
|---|---|---|
| 100-day / 200-day moving averages | $10.37 / $10.34 | Long-term trend ceiling; price is ~26% below both |
| Whole-chain call wall & largest gamma strike | $10.00 | Heaviest call open interest across all expirations (172,581 contracts), far above this window |
| 50-day moving average | $9.74 | Intermediate trend resistance |
| Swing resistance cluster | $9.59 / $9.39 / $9.12 | Prior pivot highs from the October breakdown |
| Whole-chain put wall; Nov 20 max pain | $9.00 | The aggregate put pile is now deep in the money and is a legacy of higher prices, not live support |
| 20-day moving average | $8.80 | Short-term trend line |
| Call wall (Nov 13) | $8.50 | The strike with the biggest pile of open call contracts for this expiration (3,855). These piles often act like magnets or barriers. |
| Swing resistance; implied range top | $8.37 / $8.35 | Upper edge of the priced-in move sits right at prior structure |
| Unfilled Nov 5 gap | $7.89 – $8.26 | Overhead gap zone price would need to fill to repair the breakdown |
| Put wall & max pain (Nov 13) | $8.00 | The strike with the biggest pile of open put contracts (2,909) and the price where the most option value would expire worthless. Expirations sometimes gravitate toward max pain. It is also the second-largest gamma strike chain-wide. |
| Swing resistance | $7.78 | First pivot overhead |
| Close | $7.66 | Friday, November 6 |
| Chart support (Nov 5 low) | $7.46 | Floor of the post-gap consolidation |
| Lower Bollinger Band (TA) | $7.17 | The chart model's nearer downside magnet |
| Heavy put strike / invalidation | $7.00 | Large put open interest in Nov 20, Dec 18, and Jan 15; a top-five gamma strike |
| Implied range bottom | $6.97 | Lower edge of the priced-in move into Nov 13 |
| 52-week low | $5.86 | Last line of the yearly range |
The November 13 walls ($8.00 put, $8.50 call) differ sharply from the whole-chain walls ($9.00 put, $10.00 call). The near-term expiration's own levels are the ones that matter for this window.
Positioning and unusual flow
Market makers hedge the options they've sold. One rough estimate suggests that for the November 13 expiration alone, their hedging sits in a positive regime, where it tends to dampen moves. Across all expirations the same estimate turns negative, where hedging tends to amplify moves. For the next five days, the near-expiration's cushioning effect is the more relevant one, which supports a contained range. A gamma flip level, the price below which hedging tends to accelerate selling rather than cushion it, could not be estimated from today's chain.
Three flows stand out:
- Nov 13 $7.50 calls: 3,173 contracts traded against 1,072 open, about 3× the open interest. Open interest grew from 89 to 1,072, and roughly $116,000 of premium changed hands, the single largest dollar flow in the chain. Traders were buying a near-the-money bounce ticket for this exact window.
- Nov 13 $8 calls: 1,528 contracts traded, with open interest up 619 to 1,423 (about $20,600 in premium). These are aimed squarely at the $8.00 max-pain level.
- Dec 18 $7 puts and Jan 15 $7 puts: open interest rose 3,666 and 5,576 contracts. Longer-dated protection is building at $7. That is why a close below $7.00 is our line in the sand: it is where the market's insurance is concentrated.
3 · Technical check
Both technical reports are bearish and both target $7.50.
- 3-day view (to November 11): projected range of $7.28–$7.80, support at $7.46, resistance at $7.72. Its dominant scenario, a bearish pennant breakdown, is invalidated by a close above $7.80.
- 5-day view (to November 13): projected range of $7.05–$7.95, with support at $7.46 and then $7.17, and resistance at $7.80 and then $8.01. Its breakdown case is invalidated by a daily close above $7.85.
The trend reading is strong: ADX near 37 with sellers clearly in control. Money-flow, though, has recovered from deeply negative to roughly neutral, a sign the heavy distribution of November 4–5 has faded.
Against our neutral options read, the classification is Mixed. The direction differs, but the magnitude agrees: a $7.50 target is a modest 2% dip that sits comfortably inside the $6.97–$8.35 implied range. The charts see continuation lower. The options market sees a contained five days with near-term call buying toward $8.00. The two reconcile around a range centered just below spot.
Model vs. Market: The options market implies $6.97–$8.35 into November 13; the 5-day technical model targets $7.50 (projected range $7.05–$7.95). The model's whole projection fits inside the priced-in move, so the disagreement is about tilt within the range, not about a breakout. A close below $7.46 would hand the argument to the charts. A reclaim of $7.85–$8.00 would hand it to the call buyers.
The TA adjusted our strike selection: the range-bound butterfly below is centered at $7.50, the chart model's target.
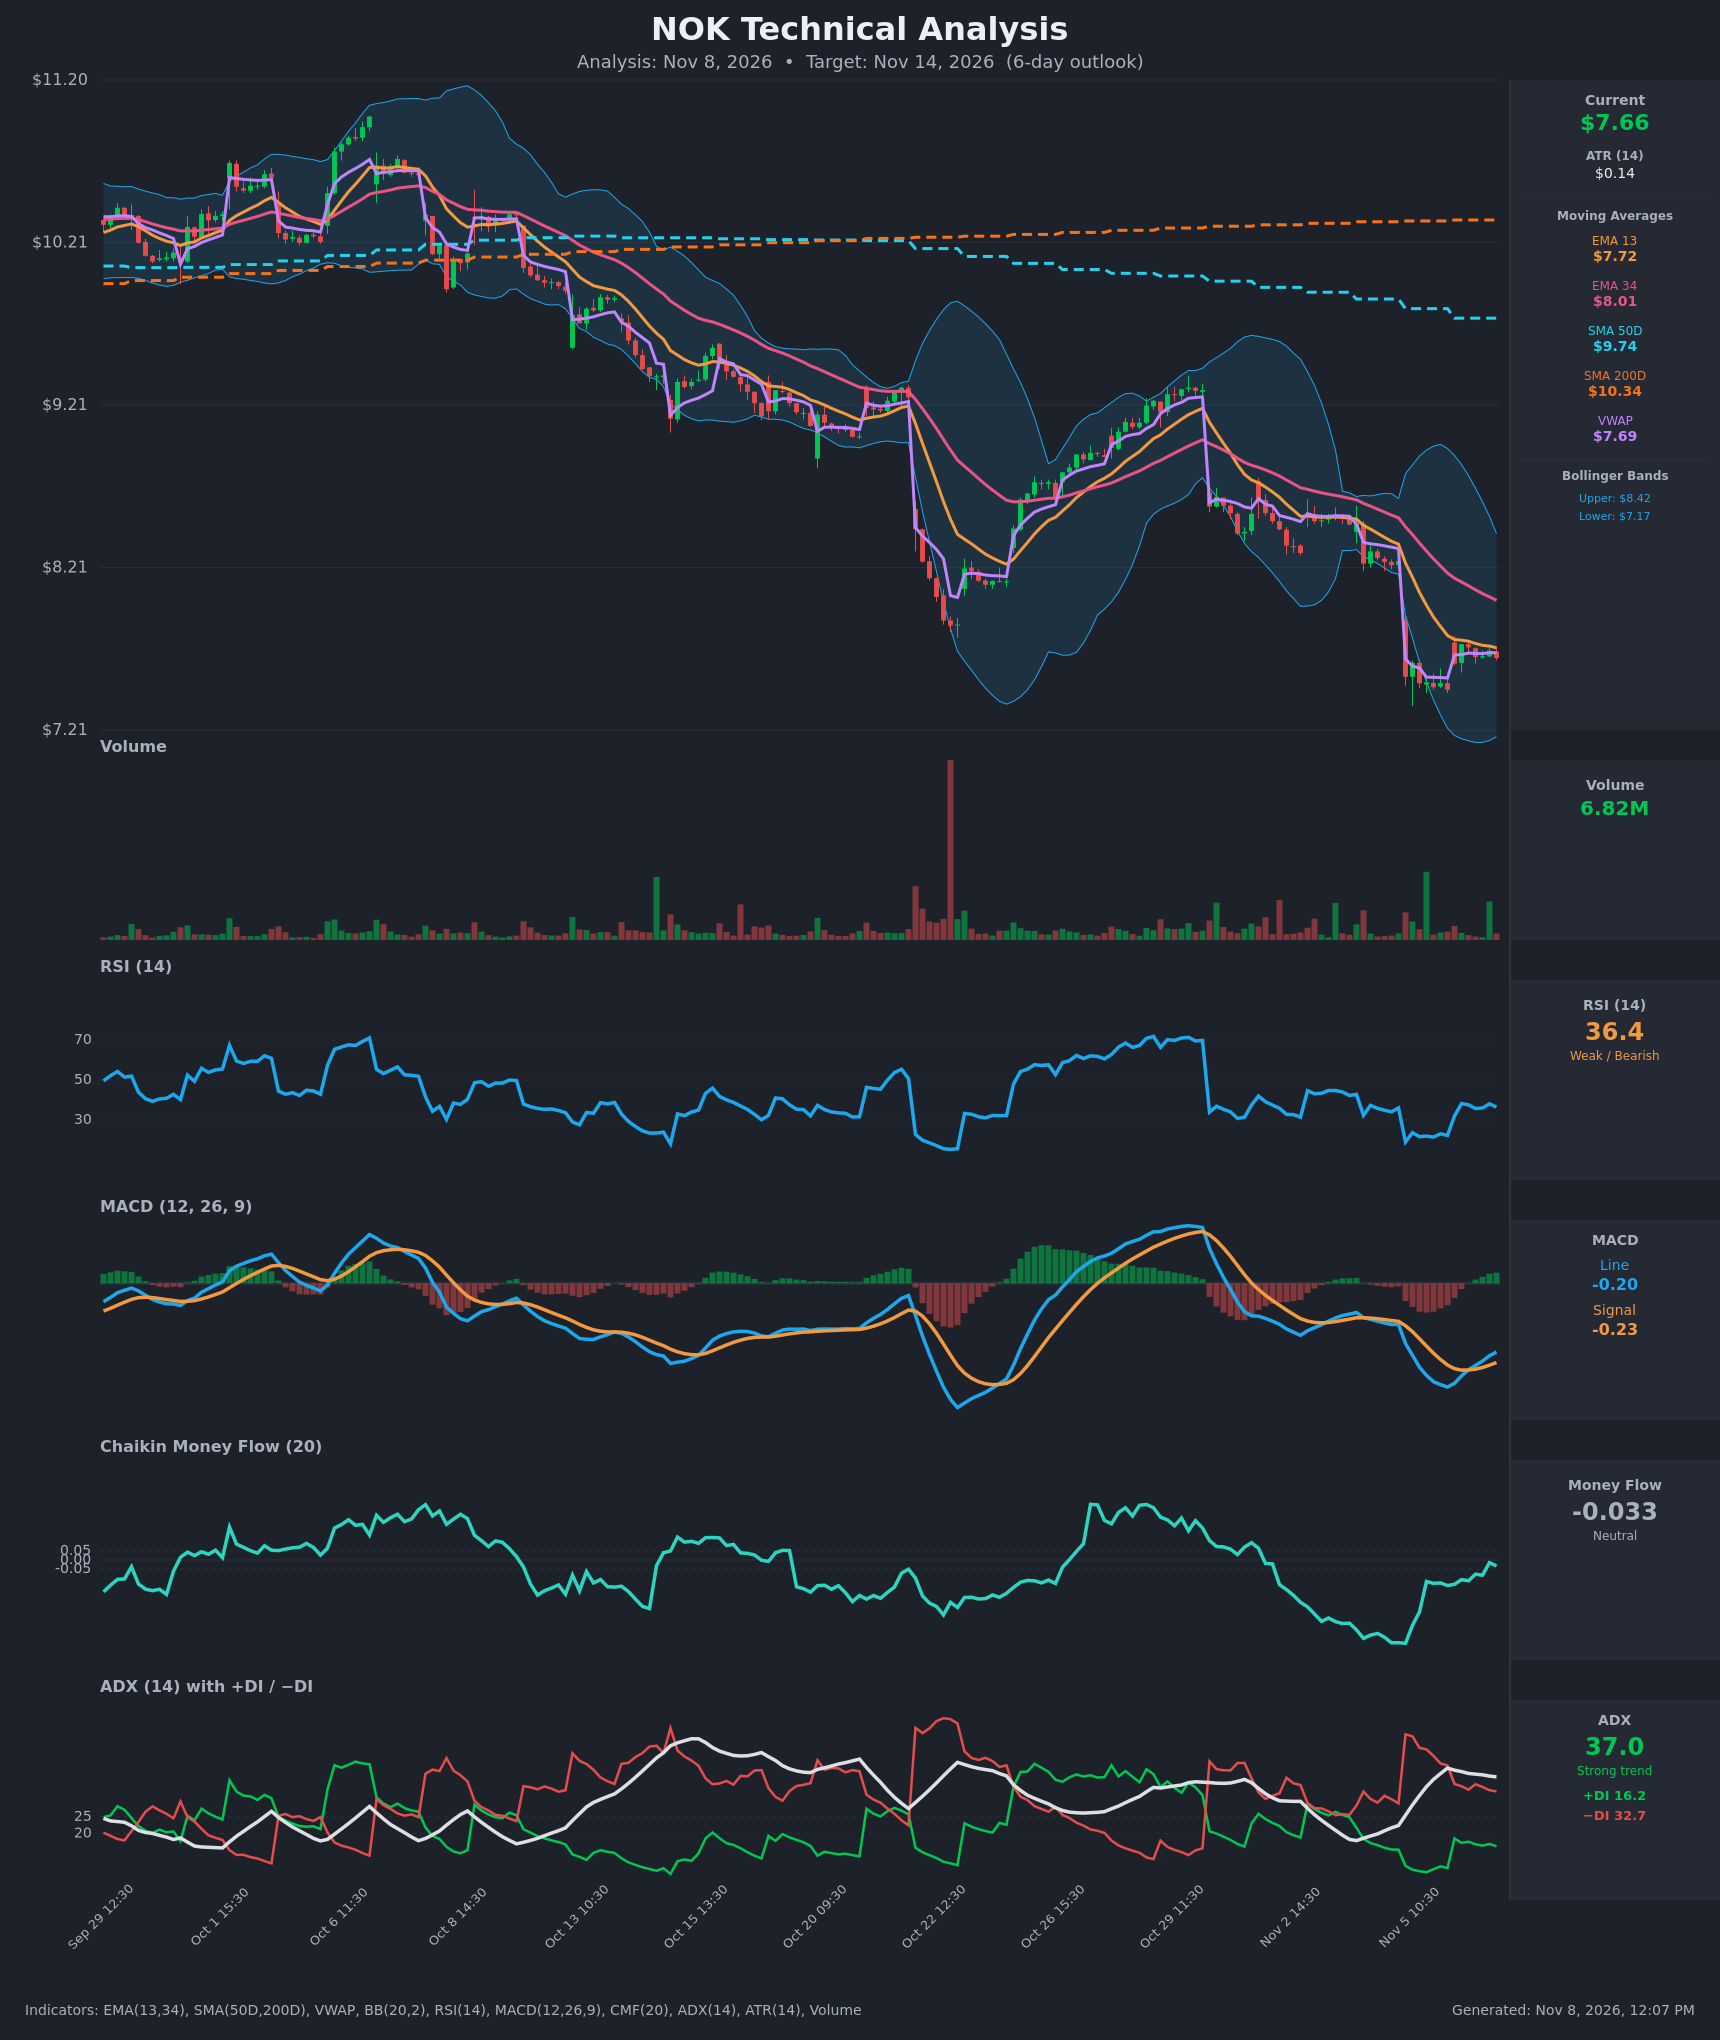
Full technical write-ups: 3-day report → · 5-day report →
4 · Three ways the next five days can go
If NOK pushes back above the call wall ($8.50): It would first have to fill the November 5 gap and reclaim the $8.00 put wall and max pain. The near-term call buying at $7.50 and $8 would be in the money and could add fuel. Above $8.50, positioning for this expiration thins out quickly, but $8.62 (the November 20 implied top) and the 20-day average at $8.80 sit close overhead. This is the low-odds branch for five days.
If NOK drifts between $7.46 and $8.00: This is the pin case. The near-expiration's positive-gamma estimate tends to dampen swings, and expiring open interest tends to pull price toward max pain at $8.00. The fresh $7.50 call position also gives traders a reason to defend the middle of this band. A finish between $7.50 and $8.00 is the outcome positioning is built around.
If NOK breaks below $7.46 and then $7.00: The chart pennant triggers, and the next magnets are $7.17 and the heavy $7 put strike. Below the near-term expiration, one rough estimate suggests the whole-chain hedging regime is negative. That means a break could accelerate rather than be cushioned, which is why a close below $7.00 invalidates the range read.
5 · Three defined-risk structures
Prices are end-of-day midpoints as of November 6, 2026. All structures are hypothetical unless flagged as an entered position. Verify live prices before trading, because these will be stale by the open.
Because premium is thin relative to realized movement, all three ideas are debit structures: you pay a small, fixed amount and that is your maximum loss. A premium-selling iron condor is deliberately left out. You'd be selling premium that hasn't been rich lately, and the November 13 wings outside the expected move pay only pennies.
If you expect the range to hold: long put butterfly (best fit)
- Trade: Nov 13 expiration. Buy one $8 put, sell two $7.50 puts, buy one $7 put. The center is at the chart model's $7.50 target, between support at $7.46 and the $8.00 max pain.
- Debit: $0.145 ($14.50 per butterfly) · Max profit: $0.355 ($35.50) at exactly $7.50 at expiration · Max loss: $0.145 ($14.50) · Break-evens: $7.145 and $7.855
- Why it fits: The options-implied range, the near-expiration positive-gamma estimate, and both chart reports all point to a finish in the mid-$7s. A butterfly is a cheap debit that pays most when price stays put, the right shape when premium is thin and you want range exposure without selling volatility.
- Makes sense only if: you believe the post-gap consolidation holds roughly between $7.15 and $7.85 through November 13.
- Invalidated if: NOK closes below $7.00, or above $8.00.
- Managing it: Butterflies gain most in the final day or two. Consider taking profits if the position doubles in value. Exit by November 12 if price is outside the break-evens, and don't hold the short $7.50 puts through the close on expiration day.
- Liquidity note: The $7.50 puts trade 3¢ wide and the $8 puts 5¢ wide, which is workable. The $7 puts quote $0.04 × $0.10, a 6¢ spread on a 7¢ mid. Enter as a single limit order near the mid and expect some slippage on that wing.
- Analyze this position →
If you lean bullish: call debit spread toward max pain
- Trade: Buy the Nov 13 $7.50 call, sell the Nov 13 $8 call.
- Debit: $0.23 ($23 per spread) · Max profit: $0.27 ($27) at $8.00 or higher · Max loss: $0.23 ($23) · Break-even: $7.73
- Why it fits: It mirrors the day's heaviest flow, the $7.50 and $8 call buying. It targets the $8.00 put wall and max pain, the level near-term positioning gravitates toward. Paying a debit makes sense with premium at a 9th-percentile low versus realized movement.
- Makes sense only if: NOK holds $7.46 and starts working into the November 5 gap.
- Invalidated if: NOK closes below $7.46.
- Managing it: The bigger trend is down on every horizon, so keep this short-dated and take profits early, at about 50–60% of max profit. A close below $7.46 means exit rather than hope.
- Liquidity note: The $7.50 calls traded 3¢ wide ($0.35 × $0.38) and the $8 calls 1¢ wide ($0.13 × $0.14). These are the most liquid strikes in the expiration, so fills should be easy.
- Analyze this position →
If you lean bearish: put debit spread
- Trade: Buy the Nov 13 $7.50 put, sell the Nov 13 $7 put.
- Debit: $0.125 ($12.50 per spread) · Max profit: $0.375 ($37.50) at $7.00 or lower · Max loss: $0.125 ($12.50) · Break-even: $7.375
- Why it fits: It expresses the chart model's pennant breakdown toward $7.17–$7.30 with a 3-to-1 payoff. It caps the payoff at $7, where longer-dated put protection is concentrated.
- Makes sense only if: NOK loses $7.46 on a closing basis.
- Invalidated if: NOK closes above $8.00.
- Managing it: Take profits near $7.17 rather than waiting for $7.00. Exit if price closes back above $7.85, the 5-day chart report's invalidation.
- Liquidity note: The $7.50 puts trade 3¢ wide. The $7 puts are thin at 6¢ wide on a 7¢ mid, so expect to give up a penny or two.
- Analyze this position →
If none of these: no trade
Standing aside is a legitimate call here. NOK is realizing about 86% volatility, so a single gap like November 5's can blow through any of these strikes overnight. On a stock this price, bid-ask spreads of a few cents are a large share of each structure's value. If you can't get filled near the midpoint, the edge disappears. With a neutral read and no directional advantage, waiting for a close outside $7.46–$8.00 before committing is a perfectly reasonable plan.
6 · Quick FAQ
What is NOK's expected move this week? About ±$0.69 (±8.98%) into the November 13 expiration, a $6.97–$8.35 range, per straddle pricing as of November 6, 2026.
Is NOK expected to go up or down over the next week? Options positioning as of November 6 reads neutral. Near-term call buying and max pain at $8.00 offset steep put pricing and a falling trend. That is a read of what traders have done, not a forecast. The actionable map is the $6.97–$8.35 range and the $7.46 / $8.00 levels.
Are NOK options expensive right now? No. IV rank of 50.6/100 says option prices sit mid-range for the past year. On top of that, options are priced about 25 vol points below the movement NOK has actually delivered, richer than only 9% of this stock's recent readings. That favors defined-risk buying over premium selling.
Where is NOK's biggest options support and resistance? For November 13: the put wall at $8.00 (currently above the stock, so it is a reclaim level) and the call wall at $8.50. Chart support is $7.46.
What invalidates this week's read? A close below $7.00.
Methodology & disclosures. Data: end-of-day options-chain snapshot for NOK, 2026-11-06, generated 2026-11-08T12:07:31.939Z. Prices shown are midpoints and will differ from live markets. Momentum/positioning scores and volatility-premium comparisons are descriptive measurements of past option flow and past price movement — not investment advice, signals, forecasts, or guarantees. All trade structures are hypothetical. Every structure shown has a defined maximum loss; you can lose the entire max-loss amount. Options involve substantial risk and are not suitable for all investors.