NOK Options Price a ±$0.84 Move Into Sept 18 — With Spot Already Sitting on the $11 Call Wall
The options market implies a $10.29–$11.97 range for Nokia into the September 18 expiration, but the heaviest call open interest in the chain sits at $11.00 — just below Friday's close. Here's what the positioning says and three defined-risk ways to trade it.

The options market implies a $10.29–$11.97 range into the September 18 expiration; here's what's driving it and three defined-risk ways to trade it.
Published Sunday, September 13, 2026 · Data as of Friday, September 11 close
Explore the live NOK options data in the Detailed Options Analyzer →
Quick answer
| Item | Answer |
|---|---|
| Market bias | Neutral |
| Options-implied range (into Sept 18) | $10.29 – $11.97 (±7.55%) |
| Major support | $10.00 (put wall, Sept 18 expiration) |
| Major resistance | $11.00 (call wall, Sept 18 expiration) |
| Max pain (Sept 18) | $10.00 |
| Dealer gamma regime (estimate) | Positive — hedging tends to dampen moves; one rough estimate puts the flip level near $2.00, far below spot |
| Volatility condition | Falling — IV rank 42.7/100 · premium rich: options priced about 12 vol points above delivered movement |
| Next earnings | October 22, 2026 (before open) — after the Sept 18 expiration |
| Technical check | Mixed (bullish, 3-day and 5-day chart models) |
| Best-fitting strategy | Sept 18 iron condor, $10.50/$11.50 short strikes |
| Analysis invalidated if | NOK closes above $11.97 |
1 · What matters today
NOK closed Friday, September 11 at $11.13 after a 13.9% five-session run. The options market is pricing a move of about ±$0.84 (±7.55%) by the September 18 expiration — a $10.29 to $11.97 band, derived from what straddles cost at that expiry. Our read of the flow comes out neutral, and the reason is structural: the single heaviest pile of call open interest in that expiration sits at $11.00, which the stock has just climbed through, while the heaviest put strike and the max-pain level both sit down at $10.00. Price is pinned between a ceiling it just cleared and a floor two dollars of percentage below. The chart models disagree and lean bullish — more on that below. The level that changes the picture is $11.97: a close above the top of the implied range says the momentum, not the positioning, is running this tape.
2 · What the options market is pricing
What changed this week
Money moved toward calls, then paused. The stock gained 13.92% over the trailing five sessions and is up 5.10% over twenty — but it is still 13.6% below where it traded 50 sessions ago. That split matters: the near-term flow and the bigger trend are pointing different ways, and a one-week pop inside a two-month downtrend is a different animal than a fresh leg of an uptrend. The reversal read that flipped on September 8 is nine days old, not nine weeks.
On the ratio side, put activity relative to calls came in at 0.28 on Friday — for every put contract traded there were roughly 3.6 calls — but that is up sharply from a 0.16 average across the prior seven sessions, so puts were relatively busier on Friday than they had been all week. Open interest tells the opposite story: puts held open versus calls sits at 0.30 against a 14-day average of 0.34, so standing put positioning has been thinning, not building. Total option volume ran 1.21× its 20-day average — busy, not frantic.
The largest single open-interest change among still-live contracts was the September 18 $14 puts, which shed 2,364 contracts — deep-in-the-money hedges being retired as the stock rallied away from them. On the constructive side, the October 16 $11 calls added 2,247 contracts of open interest on 2,092 lots of volume, and the September 18 $13 calls added 1,216.
Expected move
Into September 18, the chain prices a 1σ move of ±7.55% — about ±$0.84 around the $11.13 spot, or a $10.29 to $11.97 range. That figure is the size of the move, not a price target, and it comes straight from what at-the-money options cost at that expiry.
| Expiration | Implied move | Range around $11.13 |
|---|---|---|
| Sept 18 (7 days) | ±7.55% | $10.29 – $11.97 |
| Sept 25 (14 days) | ±11.11% | $9.89 – $12.37 |
| Oct 2 (21 days) | ±14.48% | $9.52 – $12.74 |
| Oct 16 (35 days) | ±17.52% | $9.18 – $13.08 |
The ladder scales roughly the way calendar time says it should — each rung widens without any violent kink in between, which means the chain is not bracing for anything specific inside the next five weeks.
Volatility
At-the-money implied volatility — the market's estimate of how much NOK will move, baked into option prices — is 54.3%. IV rank is 42.7/100, meaning today's reading is higher than roughly 43% of the past year's readings and cheaper than the other 57%; the one-year percentile sits at exactly 50. Direction is down over any meaningful window: IV is 22.1% lower than 30 days ago, against a 30-day average of 60.6% and a 90-day average of 72.6%. The last five sessions nudged it up 4.2% and Friday shaved 0.6% off. The front-month read is unavailable today — Friday was an expiration day, so the nearest contract had no life left to interpolate from.
One observation worth flagging: realized volatility over the last 20 days, at 42.1%, is unusually depressed for this stock compared against its own recent history. That is a statement about how much NOK has actually been moving, not about which way. The 5-day versus 20-day realized ratio is 1.09 — movement is picking up modestly versus its own month, consistent with the rally, but nothing extreme.
Premium rich or cheap. The gap between what options are priced for and what NOK has actually delivered — the volatility risk premium — sits at about 12 vol points in sellers' favor (54.3% implied against 42.1% realized). Against this stock's own recent readings, that gap is in the 90th percentile — richer than roughly 90% of them. The path got there fast: the premium has been positive most of the past fortnight but jumped from about 5 vol points on September 9 to 15 on September 10 before settling back Friday, as implied vol held up while the realized move was still working its way into the 20-day window. There is no earnings report inside the next 30 days to inflate that richness artificially — the October 22 report is 39 days out. The combination of a middling IV rank of 43 and a 90th-percentile premium over delivered movement favors collecting premium here rather than owning it, provided the structure is defined-risk.
Earnings on the calendar
Nokia's next report is Wednesday, October 22, before the open, with a consensus estimate of $0.07 per share. It lands after every expiration in the ladder above, which is why none of those rungs carry an earnings bump — the step-up shows up one rung later, where the implied move jumps from ±17.5% at October 16 to ±22.0% at October 23. That gap is the chain pricing the report. The last four quarters each came in a cent or two above the consensus estimate. Nothing in this week's structures touches that date.
Skew and sentiment
Puts and calls the same distance from the stock price do not cost the same, and here the imbalance runs the unusual way: 25-delta calls are marked at 57.0% implied vol versus 54.4% for 25-delta puts, so calls cost about 2.6 vol points more than equidistant puts — traders are paying up for upside exposure, not crash protection. But that call premium has cooled hard. The 60-day norm for this name is calls running 3.7 vol points richer, and over the past seven sessions the average was 11.3 vol points richer. Relative to its own recent history, the upside bid has faded sharply in a matter of days, and the leading positioning read picked that up — it slipped to slightly negative on Friday after averaging solidly positive all week, dragged there almost entirely by that five-session shift in skew.
Sentiment across expiration dates is mixed. The 0–7 day bucket reads flat-to-slightly-negative, while the 7–30 day bucket is the strongest constructive read in the chain, driven by call-side flow dominating delta-weighted volume across four expirations. Over the prior seven sessions those buckets averaged solidly bullish across the board — so Friday's near-dated cooling is a one-day change of tone, not a week-long trend.
The key levels map
| Level | Price | Why it matters |
|---|---|---|
| Top of implied range (Sept 18) | $11.97 | Upper 1σ bound; a close through it kills the neutral read |
| 5-day chart-model upper bound | $11.72 | The technical model's measured-move extension |
| Swing resistance | $11.58 | Nearest heuristic pivot cluster above spot (estimate) |
| Upper Bollinger Band | $11.19 | Chart-model resistance; price closed just under it |
| Spot / last close | $11.13 | Friday's close; also the top of the swing-support cluster |
| Call wall (Sept 18) | $11.00 | 132,522 calls open — the heaviest call strike in that expiration and in the whole chain (235,824 across all expirations); also the largest gamma strike |
| EMA13 (technical) | $10.93 | The chart model's stated invalidation for its bullish case |
| Swing support | $10.66 | Prior consolidation shelf (estimate) |
| 20- and 50-day moving averages | $10.34 / $10.35 | Price sits 7.6% above both |
| Bottom of implied range (Sept 18) | $10.29 | Lower 1σ bound |
| Put wall & max pain (Sept 18) | $10.00 | 61,784 puts open — the biggest downside pile, and the price where the most option value would expire worthless |
| 200-day moving average | $9.70 | Longer-term structural floor, 12.8% below spot |
The Sept 18 walls and the whole-chain walls agree this week — call wall at $11.00, put wall at $10.00 in both — which is unusual and makes those two strikes the cleanest map in the file.
Positioning and unusual flow
One rough estimate of dealer positioning has this chain in a positive gamma regime, both across all expirations and scoped to September 18 alone — in that state, market makers' hedging tends to dampen moves rather than amplify them, which argues for chop inside the walls rather than a runaway. The same estimate places the gamma flip level near $2.00, so far below spot that the fragile side of the regime is not remotely in play this week. Treat all of that as an estimate built on an assumed dealer sign convention, not observed inventory.
Three flow items stand out among still-live contracts. The September 18 $11 calls traded 26,144 contracts against 132,522 open — about $1.08 million of premium, the busiest contract in the chain, and the exact strike that defines the ceiling. The September 18 $11.50 calls turned over 8,585 contracts against just 2,957 open — a 2.9× turnover ratio and $167,000 of premium, meaning most of that volume was fresh positioning rather than closing trades. And the September 18 $10.50 puts traded 6,242 contracts against 4,935 open, adding 747 to open interest: somebody is buying a cheap floor a nickel below the bottom third of the implied range.
3 · Technical check
Both chart models lean bullish, and both are fresh — generated September 13 against the same $11.13–$11.15 reference price. The 3-day model (target September 16) projects $11.28 with a $10.85–$11.42 band. The 5-day model (target September 18, matching this article's expiration) projects $11.42 with a $10.78–$11.72 band. The decisive indicator read in both write-ups is trend strength: ADX at 37.6 with +DI at 37.1 far above −DI at 13.7, which describes an established, still-accelerating uptrend. The counterweight in both is RSI at 73.5, stretched, with price pinned against the upper Bollinger Band at $11.19.
This classifies as Mixed rather than a clean confirm or divergence. The chart model's target sits comfortably inside the options-implied range — so there is no magnitude disagreement — but its direction is firm where the options positioning is balanced. The dominant technical scenario (50% weight in the 5-day report) carries its own invalidation: a close below the EMA13 at $10.93.
Model vs. Market: The options market implies $10.29–$11.97 into September 18; the 5-day technical model targets $11.42 inside a $10.78–$11.72 band. The chart says grind higher; the chain says the heaviest call open interest in the name sits at $11.00 and the max-pain gravity sits at $10.00. Both can be true if the week ends as a shallow, choppy drift — which is exactly what a positive-gamma estimate would predict.
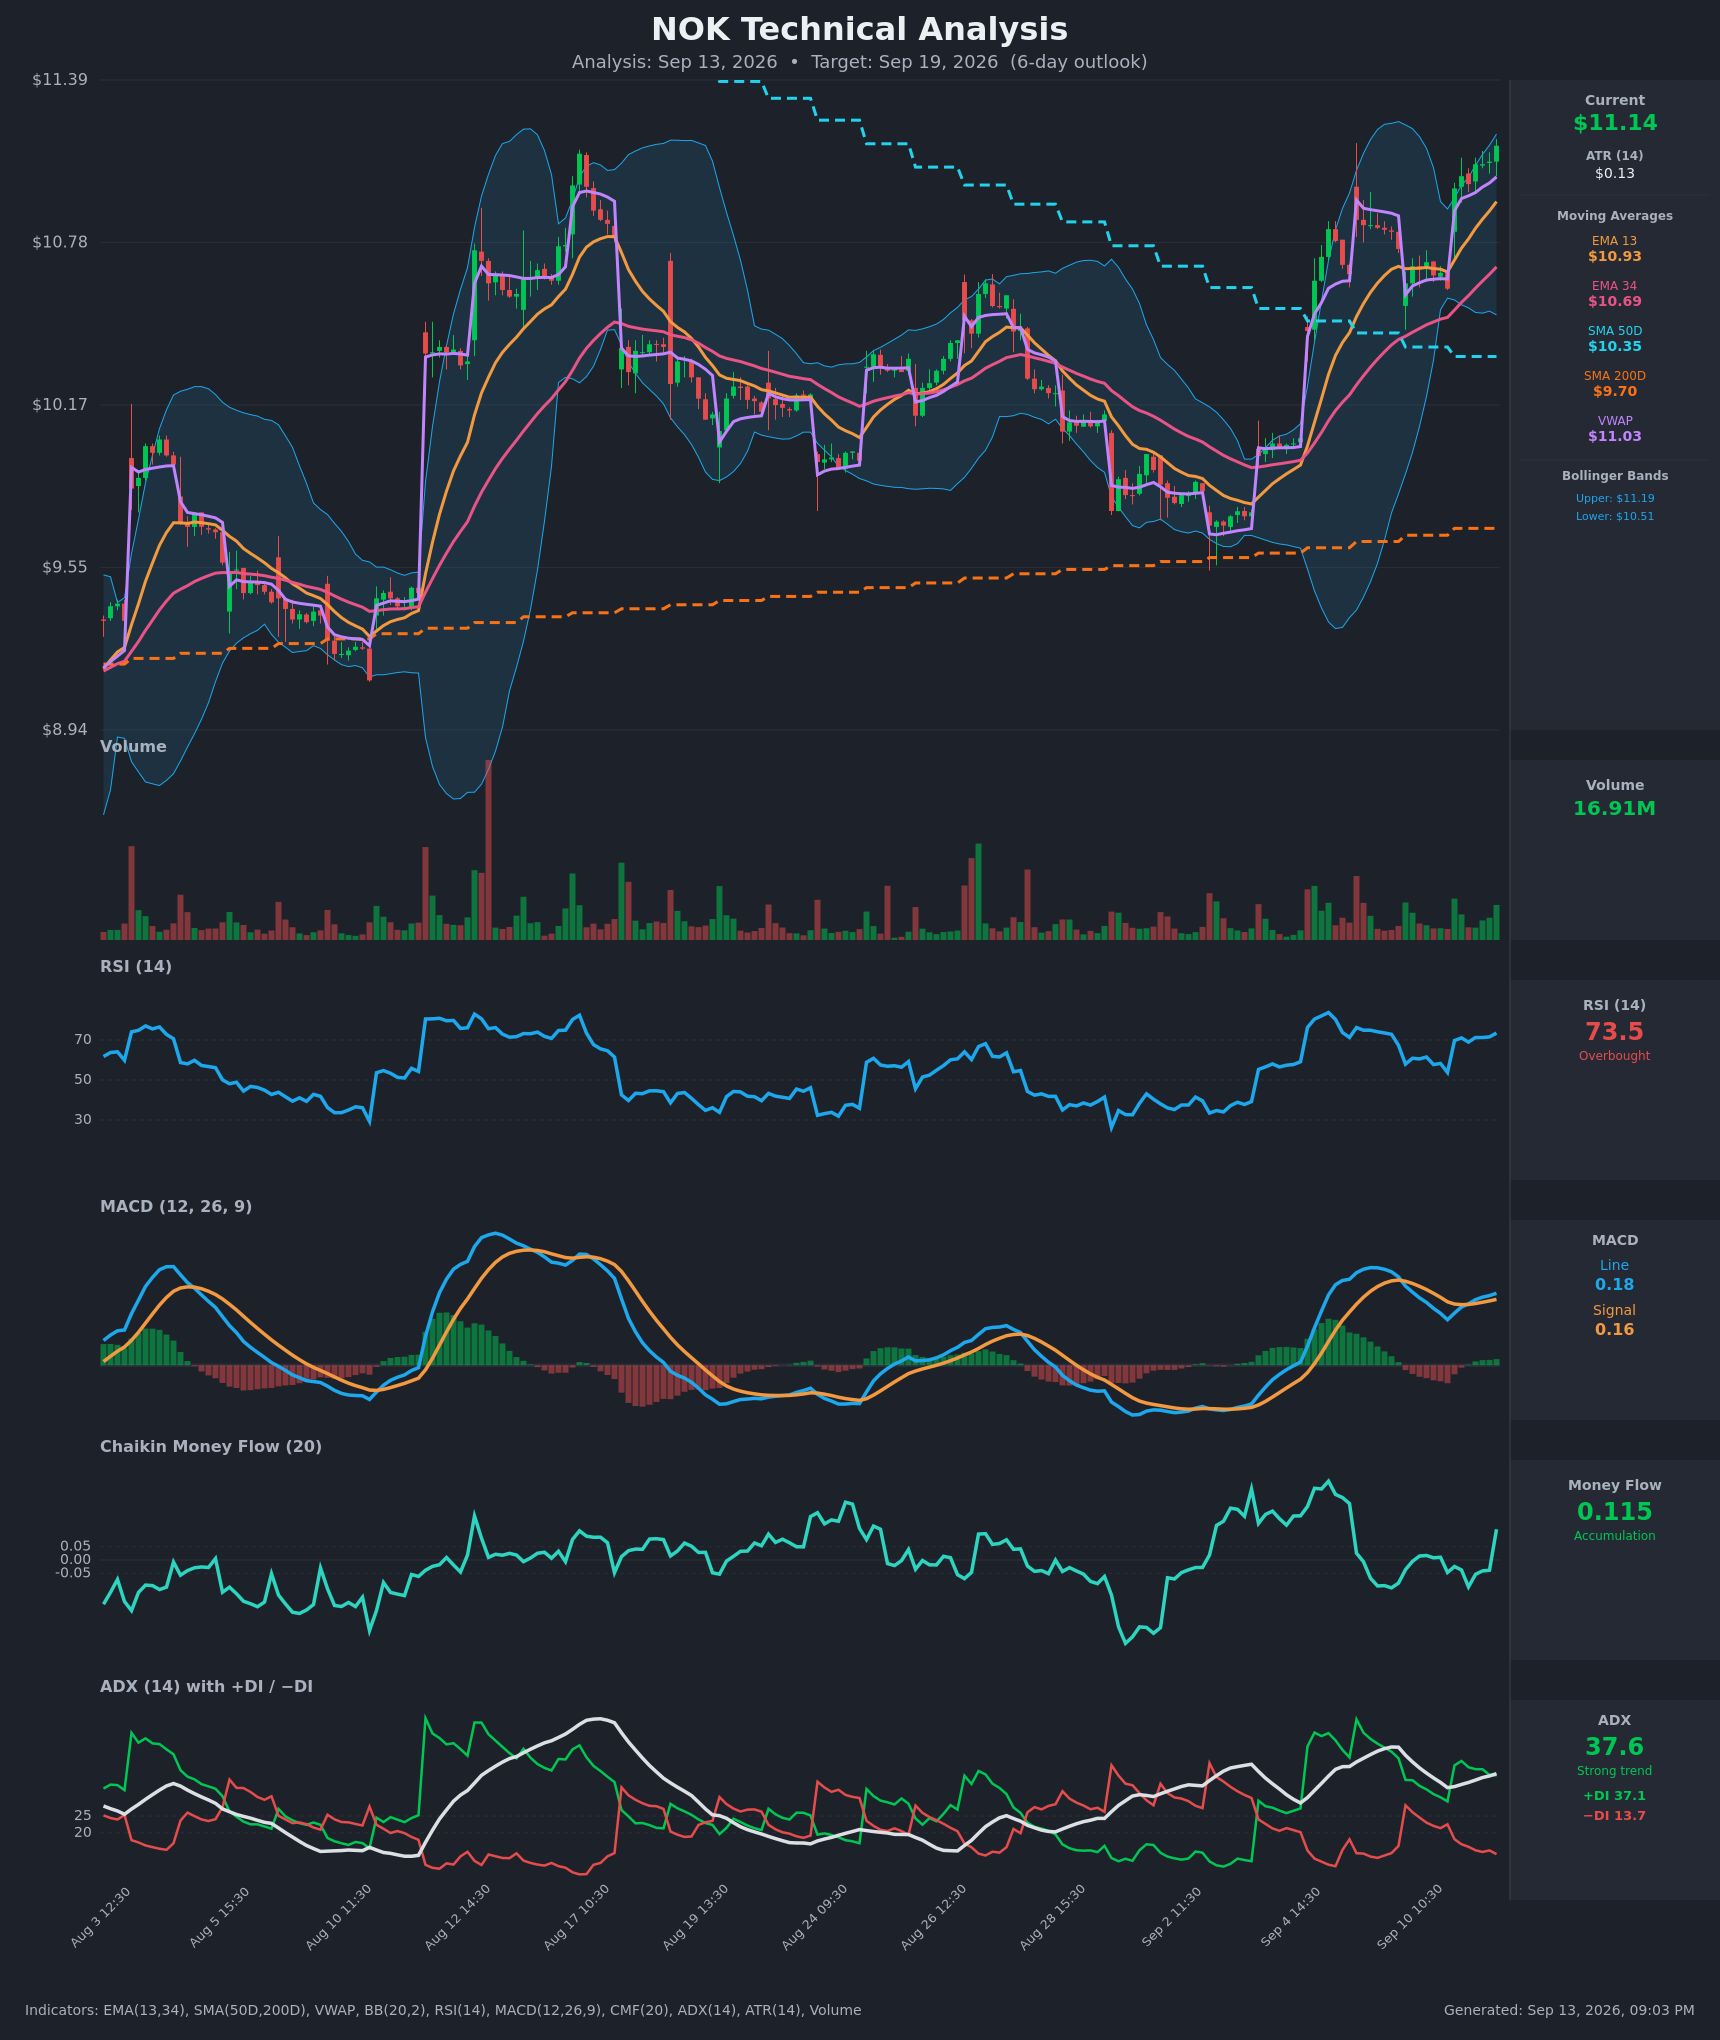
How it changed the strikes below: the bullish TA nudged the call-side short strike of the condor out to $11.50 rather than $11.00, so a grind to the technical target does not immediately breach it.
Full technical write-ups: 3-day report → · 5-day report →
4 · Three ways the next five days can go
If NOK pushes above the call wall ($11.00) and holds: it already has, by 13 cents. The 132,522 contracts of call open interest at that strike are not a wall the stock cannot pass so much as a zone where hedging flows tend to slow a rally down. Above it, the next meaningful options-derived congestion is the $12 strike, where 75,186 calls sit open for September 18 — the chain thins out considerably between $11.50 and $12.00.
If NOK drifts between the walls: this is the case the positioning data leans toward. Max pain for September 18 is $10.00, well below spot, and the dealer-gamma estimate points to hedging that dampens rather than amplifies. In that world price chops in the $10.66–$11.50 area into Friday, the $11.50 calls bought last week decay, and the premium sellers get paid.
If NOK breaks below the put wall ($10.00): that requires a 10.2% slide in five sessions, which would take price through the 20- and 50-day moving averages at $10.34 and $10.35 and out the bottom of the implied range at $10.29. The gamma-flip estimate sits far below spot, so the mechanical accelerant that sometimes turns a drop into a rout is not near — this would be an ordinary give-back of the recent rally, not a structural break, unless it also cleared the 200-day average at $9.70.
5 · Three defined-risk structures
Prices are end-of-day midpoints as of Friday, September 11. All structures are hypothetical. Verify live prices before trading — these will be stale by the open.
If you expect the range to hold: Sept 18 iron condor
- Trade: Buy the $10.00 put / sell the $10.50 put / sell the $11.50 call / buy the $12.00 call, all expiring September 18. You collect premium up front and keep it if the stock finishes between your two short strikes.
- Credit: $0.175 · Max profit: $17.50 per condor · Max loss: $32.50 · Break-evens: $10.325 and $11.675
- Why it fits: This is the structure the volatility premium argues for. Options are priced about 12 vol points above what NOK has actually delivered, richer than roughly 90% of this stock's own recent readings, and the two break-evens sit just inside the market's own 1σ band of $10.29–$11.97. You are being paid to bet that realized movement undershoots implied — which is what that 90th-percentile premium has historically rewarded.
- Makes sense only if: you accept a five-day pin thesis while the chart models are pointing higher. The call side is the live risk, not the put side.
- Invalidated if: NOK closes above $11.50 or below $10.50.
- Earnings exposure: Expires more than a month before the October 22 report — no earnings-gap risk.
- Managing it: Close at roughly 50% of max credit; exit regardless by Wednesday, September 16 if either short strike is touched. With a five-day condor, gamma risk dominates theta in the last two sessions — do not hold this into Friday morning hoping.
- Liquidity note: The $11.50 calls traded 8,585 lots Friday and quote 3 cents wide; the $12 calls are a penny wide; the $10.50 puts are a penny wide on 6,242 lots. The $10 put wing quotes 2 cents wide on a $0.04 mid — ugly in percentage terms, trivial in dollars. Work the whole condor as one package order, not leg by leg.
- Analyze this position →
If you lean bullish: Sept 18 $10.50/$10.00 put credit spread
- Trade: Sell the September 18 $10.50 put, buy the September 18 $10.00 put. You collect a credit and keep it if NOK stays above $10.50.
- Credit: $0.065 · Max profit: $6.50 per spread · Max loss: $43.50 · Break-even: $10.435
- Why it fits: The long wing sits exactly on the put wall and the max-pain strike — 61,784 puts open at $10.00 for this expiration, the thickest downside support the chain offers. The short strike carries a 21-delta, and the recent buying in those same $10.50 puts (6,242 lots, open interest up 747) means the market is treating that shelf as the relevant floor too.
- Makes sense only if: you think the 13.9% five-session run holds its gains. Note the long-horizon trend read is still negative — price is 13.6% below where it sat 50 sessions ago — which argues for short-dated expressions like this one rather than anything you have to nurse for a month.
- Invalidated if: NOK closes below $10.50.
- Earnings exposure: Expires well before the October 22 report — no earnings-gap risk.
- Managing it: This one is 15% return on risk for a week of exposure, so there is no "take half off" — either it expires worthless or you close it. Exit if NOK closes below $10.66, the swing shelf above your short strike; do not wait for $10.50 to print.
- Liquidity note: The $10.50 puts quote a penny wide on heavy volume; the $10 puts quote 2 cents wide on a 4-cent mid, so expect to give up a tick on the wing. Trade it as a spread.
- Analyze this position →
If you lean bearish: Sept 18 $11.50/$12.00 call credit spread
- Trade: Sell the September 18 $11.50 call, buy the September 18 $12.00 call. You collect a credit and keep it if NOK stays below $11.50.
- Credit: $0.11 · Max profit: $11.00 per spread · Max loss: $39.00 · Break-even: $11.61
- Why it fits: Price has run 13.9% in five sessions straight into the heaviest call open interest in the chain, and the call-premium bid that powered the move has already faded — 25-delta calls are 2.6 vol points richer than puts today against a seven-session average of 11.3. Max pain for this expiration sits at $10.00, a long way below. The short strike sits above both chart-model targets ($11.28 and $11.42).
- Makes sense only if: you are fading an overbought tape, not calling a trend change. RSI at 73.5 supports the fade; ADX at 37.6 with +DI dominant argues against it. Size accordingly.
- Invalidated if: NOK closes above $11.50.
- Earnings exposure: Expires more than a month before the October 22 report — no earnings-gap risk.
- Managing it: Close at roughly 50% of max credit. Because this fights a confirmed short-term uptrend that is running against a longer-term downtrend, take profits early rather than holding for the last few cents — exit by Wednesday, September 16 if the position is green.
- Liquidity note: The $11.50 calls quote 3 cents wide on $0.195, the $12 calls a penny wide on $0.085. Both traded in size Friday; fills should be clean as a package.
- Analyze this position →
If none of these: no trade
The premium here is genuinely rich and genuinely clean — a 90th-percentile gap over delivered movement with no earnings inside the window to explain it away. So why stand aside? Because a $10–$11 stock makes credit spreads a poor dollar business: the September 18 condor collects $17.50 against $32.50 of risk, and one bad fill on a penny-wide wing eats a meaningful slice of that. Selling premium is only an edge if you can capture it, and at these absolute price levels commissions and slippage are a real tax on a five-day trade. If your account cannot size this to dozens of contracts without commission drag, the honest answer is to wait for the October expirations, where the same premium is available on contracts worth four to five times as much — or simply to watch whether $11.00 holds as support this week before committing anything.
6 · Quick FAQ
What is NOK's expected move this week? About ±$0.84 (±7.55%) into the September 18 expiration, per the options market's straddle pricing as of the September 11 close — a $10.29 to $11.97 range around the $11.13 spot.
Is NOK expected to go up or down over the next five days? Options positioning as of September 11 reads neutral — momentum and 7–30 day flow lean constructive, but spot sits right on the heaviest call strike with max pain two dollars below — and that is a read of what traders have done, not a forecast. The actionable map is the $10.29–$11.97 range and the $10.00 / $11.00 levels.
Are NOK options expensive right now? Two lenses. IV rank of 42.7/100 says option prices are higher than about 43% of the past year's readings — middling. But they are also running roughly 12 vol points above the movement NOK has actually delivered over the last 20 days, richer than about 90% of this stock's own recent readings. That favors selling premium in defined-risk form, and there is no earnings report inside the window inflating it.
Where is NOK's biggest options support and resistance? Put wall $10.00 and call wall $11.00 for the September 18 expiration — and unusually, the whole-chain walls sit at the same two strikes.
What invalidates this week's read? A close above $11.97, the top of the options-implied range.
Methodology & disclosures. Data: end-of-day options-chain snapshot for NOK, 2026-09-11, generated 2026-09-13 21:03 UTC. Prices shown are midpoints and will differ from live markets. Momentum/positioning scores and volatility-premium comparisons are descriptive measurements of past option flow and past price movement — not investment advice, signals, forecasts, or guarantees. Earnings dates and reported results are from the data provider's earnings feed as of 2026-09-13 21:03 UTC; report dates can change. All trade structures are hypothetical. Every structure shown has a defined maximum loss; you can lose the entire max-loss amount. Options involve substantial risk and are not suitable for all investors.