NOK Options Are Pricing a ±$0.84 Move by September 25 — the Chart Model Sees Half the Swing
The options market implies a $9.84–$11.52 range for Nokia into the September 25 expiration, while the technical model projects a far tighter $10.36–$10.98. Here's what the positioning data actually shows, the levels that matter, and three defined-risk ways to trade a genuinely undecided setup.
Listen to this analysis — prefer audio? This NOK outlook is also available as a podcast episode:
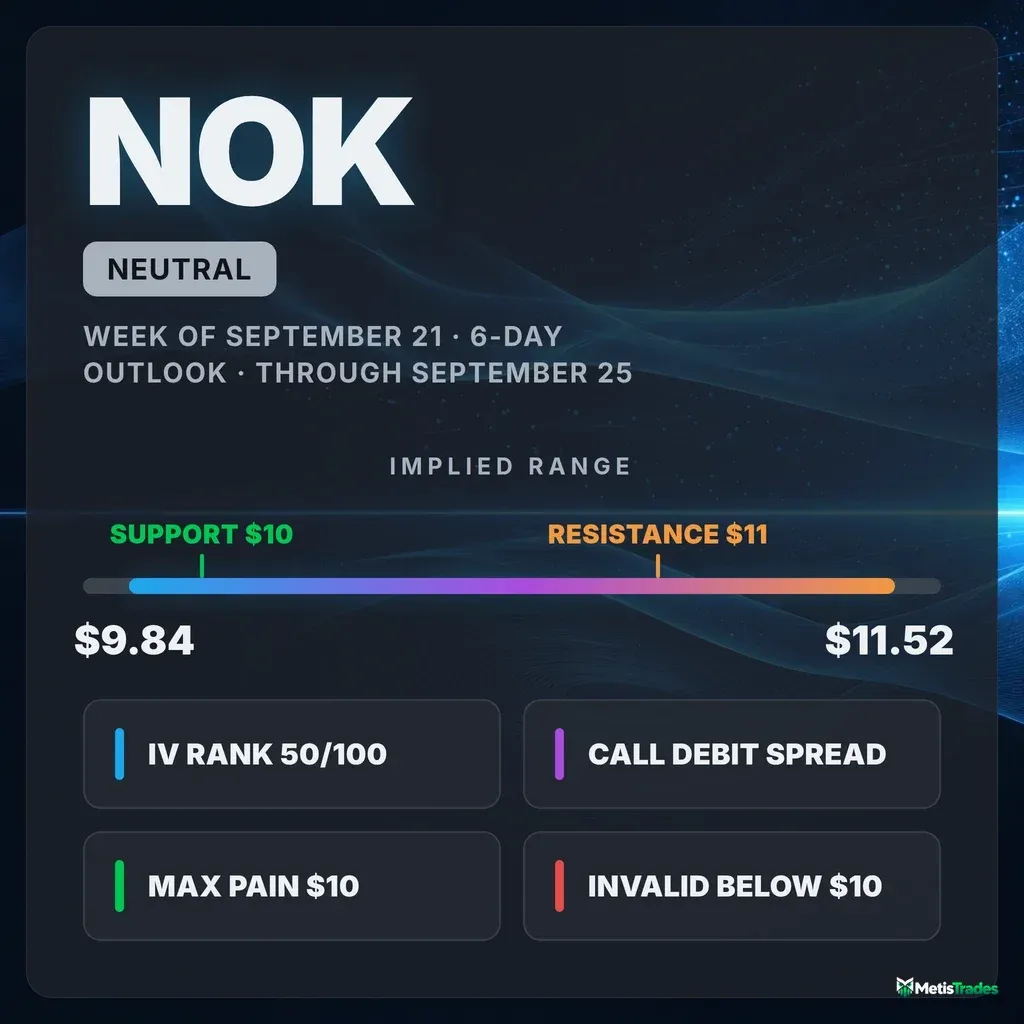
The options market implies a $9.84–$11.52 range into the September 25 expiration; here's what's driving it, the levels that matter, and three defined-risk ways to trade it.
Published Saturday, September 19, 2026 · Data as of Friday, September 18, 2026 close
Explore the live NOK options data in the Detailed Options Analyzer →
Quick answer
| Item | Answer |
|---|---|
| Market bias | Neutral |
| Options-implied range (into September 25) | $9.84 – $11.52 (±7.87%, or ±$0.84) |
| Spot / last close | $10.68 |
| Major support | $10.00 (put wall, September 25 expiration) |
| Major resistance | $11.00 (call wall, September 25 expiration) |
| Max pain (September 25) | $10.00 |
| Dealer gamma regime (estimate) | Positive — market-maker hedging tends to dampen moves; the flip estimate sits at ≈$3.00, far below spot |
| Volatility condition | Rising — IV rank 50/100 · premium thin: options are priced about 7.7 vol points below the movement NOK has actually delivered |
| Next earnings | October 22, 2026 (before open) — 27 days after the September 25 expiration |
| Technical check | Mixed (bullish, 3-day and 6-day chart models, target $10.87) |
| Best-fitting strategy | Call debit spread — September 25 $10.50/$11.00 — if you lean higher; premium is cheap enough that buying beats selling |
| Analysis invalidated if | NOK closes below $10.00 |
1 · What matters today
NOK closed Friday, September 18 at $10.68, and the options market is pricing a move of roughly $0.84 in either direction by the September 25 expiration — a $9.84 to $11.52 band. That range is derived from what at-the-money straddles cost, and it is wide: nearly 8% in six days.
Our read of the options flow comes out genuinely neutral. Short-dated sentiment is flat, the medium-dated chain is call-tilted, price momentum has turned down over the past week, and the stock is sitting close to the middle of a corridor bounded by the heaviest call open interest at $11.00 and the heaviest put open interest at $10.00. Those two strikes, plus a max-pain level of $10.00, are the map for the next six days.
The one number that changes everything: a close below $10.00. That is the put wall, the max-pain strike, and the floor of the pinning case all at once. The chart models lean bullish into this window, but they don't move our read.
2 · What the options market is pricing
What changed this week
The last five sessions have been violent. NOK is down 4.04% over five trading days but up 5.22% over twenty, and the daily tape has been full of gaps — down 9.79% on September 14, then up 5.69%, 5.62% and 2.08% on the three sessions that followed. Friday's share volume of 161.9 million ran 2.03× its 20-day average.
The options chain registered that. At-the-money implied volatility — the market's estimate of how much NOK will move, baked into option prices — finished at 60.2%, up 6.2% on the day and 10.9% over five sessions, though still 16.2% below where it sat a month ago. IV rank climbed to 50/100 from a 14-day average of 44.9.
Put activity has been building steadily. Put volume ran at 0.46 contracts for every call on Friday, against a 7-day average of 0.36 and a 14-day average of 0.25 — traders have roughly doubled their relative put usage in a fortnight. Open interest tells a milder version of the same story: 0.35 puts held open per call, versus a 14-day average of 0.33. The biggest live positioning change was in the October 16 $10 puts, which added 4,701 contracts of open interest; the September 25 $11 calls, by contrast, shed 4,656 contracts even as 6,927 traded. (Into Friday's expiration the settled $12 puts dropped 5,028 contracts — history now, not a live level.)
The short- and long-term trend reads are pulling against each other, which is worth naming plainly: the past week's 4% slide runs against a month that is up 5.2%, and both sit inside a roughly two-and-a-half-month stretch that is down 17.2%. Our momentum read also flipped from bullish to bearish on September 16 after a brief bullish run that began September 8. That is a market rotating fast, not one trending.
Expected move
Into September 25, the options market is pricing a ±7.87% move — about ±$0.84 around the $10.68 spot, or a $9.84 to $11.52 range. Here is how that scales across the nearer rungs of the chain:
| Expiration | Implied move | Range around $10.68 |
|---|---|---|
| September 25 (7 DTE) | ±7.87% | $9.84 – $11.52 |
| October 2 (14 DTE) | ±11.47% | $9.46 – $11.91 |
| October 16 (28 DTE) | ±16.09% | $8.96 – $12.40 |
| October 23 (35 DTE) | ±19.50% | $8.60 – $12.76 |
The rungs scale roughly as you'd expect with time — except for the last one. The step from ±16.09% at October 16 to ±19.50% at October 23 is steeper than the seven extra days justify, and the earnings paragraph below explains why.
Volatility
At-the-money IV of 60.2% puts IV rank at 50/100 — option prices are higher than roughly half of the past year's readings and cheaper than the other half. That sits above the 30-day average of 58.4% but well below the 90-day average of 72.2%, so this is a stock whose options have been repricing downward all quarter and have only just started ticking back up. The front-month read is unavailable in this snapshot: the nearest expiration was expiring the same day, which makes the short-dated term comparison uncomputable — an expiry-day artifact, not a gap in the data.
What's remarkable is the realized side. NOK's 5-day realized volatility is running about 1.8× its own 20-day pace, a reading far above this stock's recent norm — that's the mid-September gap sequence showing up in the numbers. Twenty-day realized volatility itself is 67.8%, about typical for NOK, but the ten-day figure is 91.1%. The stock has been moving harder than its own month-long baseline.
Premium rich or cheap? The volatility risk premium — the gap between how much movement options are priced for and how much NOK has actually delivered — is negative: options are priced about 7.7 vol points below the stock's realized 20-day movement. That reading is thinner than about 72% of this stock's own recent readings. When the gap is positive, option sellers have been collecting more than realized movement cost them; here it's the reverse. The gap flipped from positive to negative on September 14, and that flip is mechanical — the 9.8% down-gap and the rebound that followed entered the 20-day realized-vol window and dragged realized volatility above implied. The implied-vs-delivered gap is also running below its own norm, reinforcing the read. The practical conclusion: with IV rank at a middling 50 and premium priced under delivered movement, this is a week that favors owning defined-risk premium rather than selling it.
Earnings on the calendar
Nokia's next scheduled report is October 22, 2026, before the open, with a consensus estimate of $0.07 per share. That lands after the October 16 expiration and before October 23 — which is exactly where the expected-move ladder steps up hard, from ±16.09% to ±19.50%. That jump is the chain bracing for the report, not a change in the underlying volatility regime. The last four quarters each came in a penny or two above expectations ($0.08 vs $0.07 most recently). Nothing in this article's six-day window carries earnings-gap risk.
Skew and sentiment
Skew measures whether puts and calls the same distance from the stock price cost the same. For NOK they don't — and unusually, it's the calls that are expensive. The 25-delta call is priced at 61.5% implied volatility against 58.6% for the equivalent put, a 2.9 vol-point gap in favor of calls, versus a 60-day norm of 3.4 points. Traders here have been paying up for upside, not crash protection. But that call premium has been shrinking: on a seven-day average the gap was 6.2 points. The upside bid is fading, even if it hasn't reversed.
Volume tells the other half. Raw put/call volume of 0.46 is running above this stock's own recent norm — put-side flow is unusually heavy for NOK, even though in absolute terms calls still dominate two to one. Meanwhile the call-side sweep tilt that this name usually shows was present on Friday but well below its own norm — one call contract cleared the peer-relative unusual bar, against zero puts, where recent sessions have run two to four.
Sentiment across expiration terms is split. The 0–7d bucket scores a near-flat +6. The 7–30d bucket is a solid +38, and the 60–120d bucket +37. The one-phrase summary our read produces is "bullish recovery" — positioning building further out the curve while the front end sits on the fence. That split is exactly why the headline bias lands on neutral rather than a lean.
The key levels map
| Level | Price | Why it matters |
|---|---|---|
| 52-week high | $17.45 | 38.8% above the close — context only |
| Swing resistance | $11.58 | Next structural shelf above the implied range |
| Top of implied range | $11.52 | Upper edge of the ±7.87% move into September 25 |
| Swing resistance | $11.15 | Nearest heuristic pivot cluster overhead (estimate) |
| Call wall (September 25) | $11.00 | Heaviest call open interest for the target expiration (13,480 contracts) — and also the whole chain's heaviest call strike (247,105). The two agree, which is rare and makes this level the cleanest cap on the board. Also the single largest gamma strike. |
| Spot / last close | $10.68 | Friday, September 18 close |
| Swing support | $10.66 | Immediately beneath spot — the first thing to break |
| 20-day moving average | $10.28 | Price sits 3.94% above it |
| Swing support | $10.17 | Heuristic pivot cluster (estimate) |
| 50-day moving average | $10.14 | Price sits 5.31% above it |
| Put wall + max pain (September 25) | $10.00 | Heaviest put open interest for the target expiration (2,730) and the price where the most option value expires worthless. The whole chain's put wall is also $10.00 (176,974 contracts) — again, the two agree. |
| Bottom of implied range | $9.84 | Lower edge of the ±7.87% move |
| 200-day moving average | $9.80 | Price sits 8.96% above it |
| Swing support | $9.59 | Next shelf below the implied range (estimate) |
| Gamma flip (estimate) | ≈$3.00 | One rough estimate places the level where dealer hedging would start amplifying rather than cushioning moves — far below spot, so the entire tradeable range sits on the dampening side |
Positioning and unusual flow
One rough estimate of dealer positioning puts this chain in a positive gamma regime, both across all expirations and scoped to September 25 on its own — meaning market-maker hedging of the options they've sold tends to dampen moves rather than accelerate them. That estimate rests on an assumed convention about which side dealers are on, so treat it as a lean, not a fact. Spot sits about 72% above the flip estimate, which is about typical for this name.
Three live flow items stand out:
- September 25 $10.50 puts — 7,035 contracts traded against just 1,336 held open, a 5.3× turnover, with about $169,000 of premium changing hands. Someone was buying near-the-money downside protection right in the article's expiration.
- October 16 $11 puts — 16,370 contracts traded and roughly $1.38 million of premium, the single largest dollar-premium line in the entire chain. That's the month-out hedge, not a directional swing.
- October 23 $9 puts — 2,689 contracts against 777 open, 3.5× turnover. Cheap, far out-of-the-money tail protection spanning the earnings date.
Read together: the money changing hands in size on Friday was defensive, even while the chain's call open interest still dwarfs its put open interest three to one.
3 · Technical check
Both chart models run bullish. The 3-day model (target date September 22) projects $10.87 with a range of $10.47 to $10.94. The 6-day model, which matches this article's window exactly, also targets $10.87, with a wider projected range of $10.36 to $10.98. Both cite a strong directional trend reading (ADX 39.5 with the positive directional line at 35.7 versus 11.9 on the negative side), a fresh momentum crossover on September 17, and price holding above its short-term moving averages.
Both also flag the same caution: money-flow has been persistently negative (-0.305) through the entire recovery from $10.14 to $10.69 — price rising while the flow measure reads distribution. That is a real divergence, and it is the same tension the options data shows from a different angle: a bid for upside that's slowly losing its premium while put volume builds.
The classification here is mixed, not confirming. The chart models point up; our options read points sideways; the chart target of $10.87 sits comfortably inside the options-implied range, so there's no contradiction to resolve — just a difference in conviction. What the technicals did change is strike selection: the models' resistance shelf at $10.90 sits just under the $11.00 call wall, which is why the bullish structure below tops out there rather than reaching for $11.50.
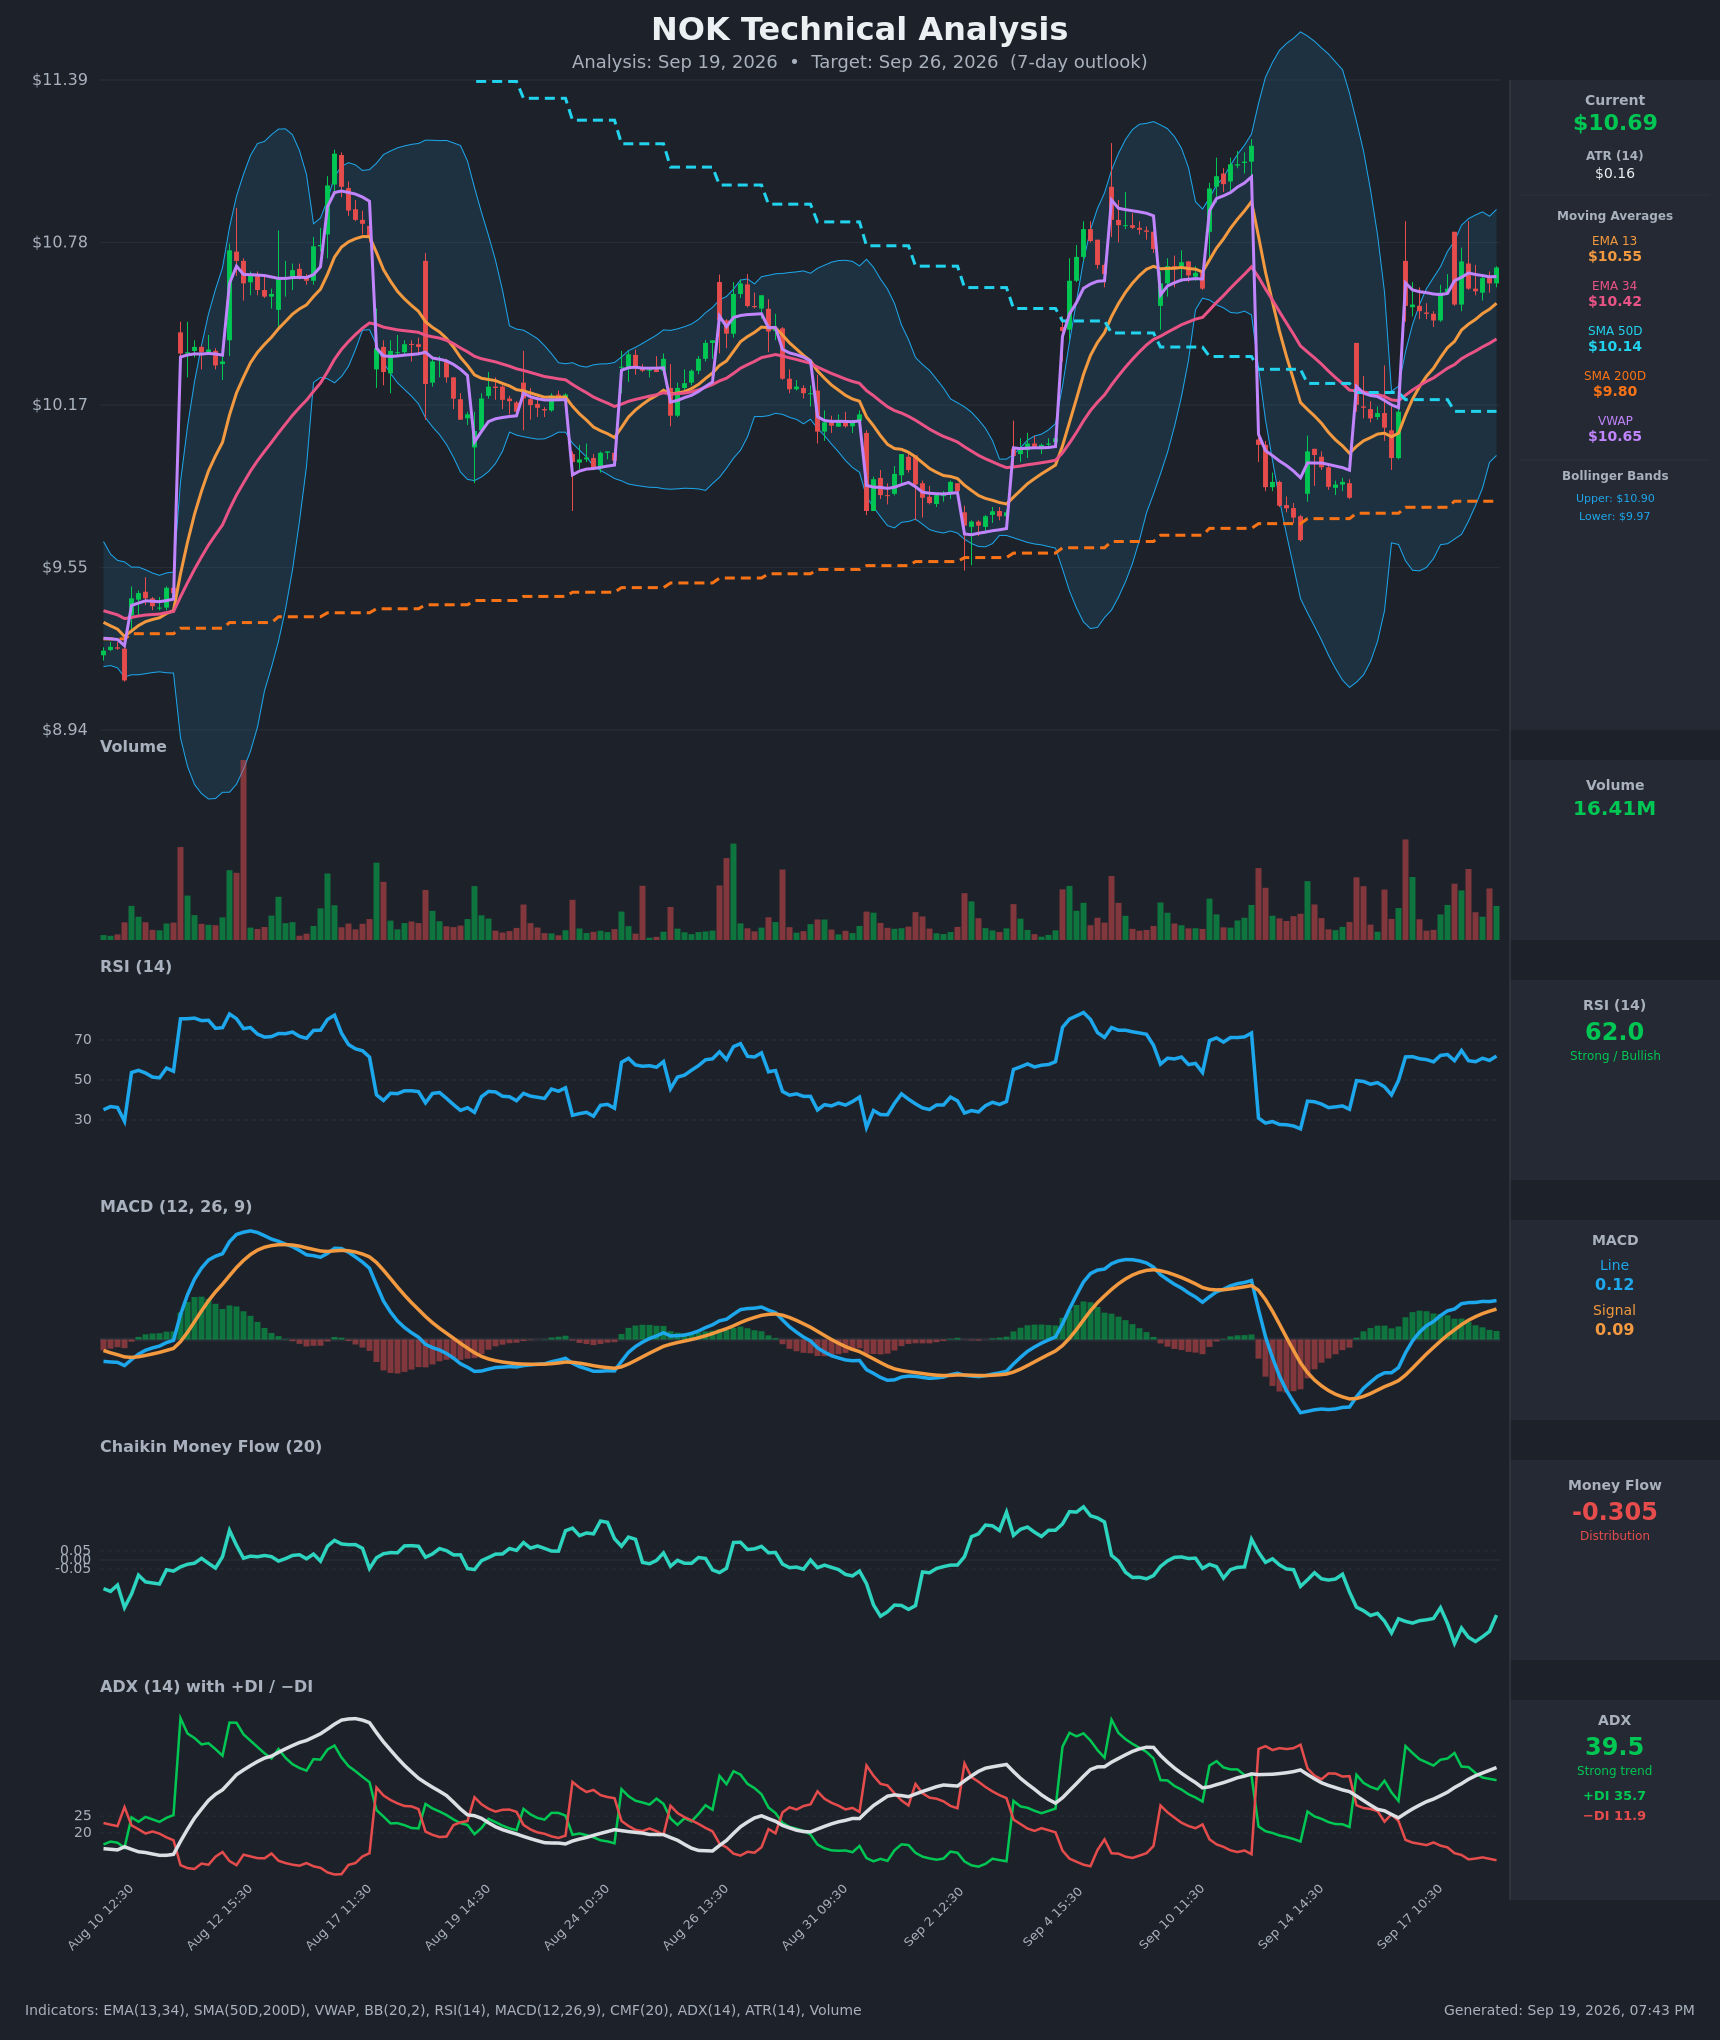
Model vs. Market: The options market implies $9.84–$11.52 into September 25; the 6-day technical model projects $10.36–$10.98 around a $10.87 target. The options range is about two and a half times wider than the chart model's. Either the chart model is underestimating how much this stock has been gapping lately, or option buyers are overpaying for a range the stock won't use — and given that realized movement is currently running above implied, the first reading is the more likely one.
Full technical write-ups: 3-day report → · 6-day report →
4 · Three ways the next six days can go
If NOK pushes above the call wall ($11.00): That strike carries the heaviest call open interest both for September 25 and across the whole chain, and it is also the single largest gamma strike. Positioning that concentrated tends to slow rallies as they approach — dealers hedging into it typically lean against the move. A clean break through leaves much thinner positioning overhead until roughly $11.52, the top of the implied range, with a structural shelf near $11.58.
If NOK drifts between the walls: This is the case the positioning data most supports. Max pain for September 25 is $10.00 and the dealer-gamma estimate points to a dampening regime, so expiring open interest and hedging flows would both tend to pull price toward the lower half of the $10.00–$11.00 corridor as the week runs down. Note that spot at $10.68 sits nearer the call wall than the put wall — the corridor is not symmetric, and the path of least resistance inside it points down toward $10.00, not up.
If NOK breaks below the put wall ($10.00): Below that strike the chain thins out quickly and the price-structure supports take over — the 50-day average at $10.14 would already be broken, leaving the 200-day at $9.80 and a swing shelf at $9.59. The gamma-flip estimate sits far below at roughly $3.00, so this is not an acceleration scenario driven by dealer hedging; it is simply a market that has run out of nearby option-based support. Given that realized volatility is currently outrunning what options are priced for, a break here could travel further than the implied range suggests.
5 · Three defined-risk structures
Prices are end-of-day midpoints as of September 18, 2026. All structures are hypothetical. Verify live prices before trading — these will be stale by the open.
Because premium is priced below delivered movement this week, the long-premium (debit) structures lead here, and the credit structure comes last with a health warning attached.
If you lean bullish: call debit spread
- Trade: Buy the September 25 $10.50 call, sell the September 25 $11.00 call
- Debit: $0.22 ($0.435 paid − $0.215 collected) · Max profit: $0.28 · Max loss: $0.22 · Break-even: $10.72
- Why it fits: You're buying premium in a week where options are priced about 7.7 vol points below what NOK has actually delivered — the rare setup where paying for optionality is the cheaper side of the trade. The short strike sits exactly on the $11.00 call wall, the level where the heaviest call open interest in the entire chain would likely slow a rally anyway, and just above the chart models' $10.90 resistance shelf.
- Makes sense only if: you think the bullish chart read wins out over flat short-dated options sentiment, and you're content capping the upside at the wall.
- Invalidated if: NOK closes below $10.50.
- Earnings exposure: Expires 27 days before the October 22 report — no earnings-gap risk.
- Managing it: Close at roughly 60–70% of maximum value rather than holding to expiration; with only six days on the clock and a short-term trend read that's fighting the medium-term one, waiting for the last few cents rarely pays. Exit regardless by September 24.
- Liquidity note: The $10.50 calls traded 3¢ wide (6.9% of mid) and the $11.00 calls 1¢ wide (4.7%) on Friday, with $93,000 and $149,000 of premium changing hands respectively. Fills should be straightforward.
- Analyze this position →
If you lean bearish: put debit spread
- Trade: Buy the September 25 $10.50 put, sell the September 25 $10.00 put
- Debit: $0.16 ($0.24 paid − $0.08 collected) · Max profit: $0.34 · Max loss: $0.16 · Break-even: $10.34
- Why it fits: Same cheap-premium logic in the other direction, and it targets the pin. Max pain for September 25 is $10.00 and that is also the put wall — so this structure reaches its full value exactly where the expiring open interest would most like the stock to land. It also lines up with the week's dominant flow: 7,035 September 25 $10.50 puts traded against 1,336 open, and put/call volume has nearly doubled relative to its own two-week norm.
- Makes sense only if: you think the five-day downturn (−4.04%) and the building put positioning matter more than the bullish chart read.
- Invalidated if: NOK closes above $10.90 — the chart models' resistance shelf and the level at which the pin-toward-$10 case stops making sense.
- Earnings exposure: Expires 27 days before the October 22 report — no earnings-gap risk.
- Managing it: Take profits at $10.05–$10.10 rather than praying for a touch of exactly $10.00; the put wall is a magnet, not a trapdoor. Exit regardless by September 24.
- Liquidity note: The $10.50 puts traded 2¢ wide (8.3% of mid) with about $169,000 of premium — very tradeable. The $10.00 puts are 2¢ wide on an $0.08 mid, which is 25% in percentage terms; that leg will leak a cent or two on entry, so work the spread as a package, not leg by leg.
- Analyze this position →
If you expect the range to hold: iron condor
- Trade: Sell the September 25 $10.00 put, buy the $9.50 put, sell the $11.00 call, buy the $11.50 call
- Credit: $0.17 · Max profit: $0.17 · Max loss: $0.33 · Break-evens: $9.83 and $11.17
- Why it fits: A credit spread pays you upfront to bet the stock stays inside a band. This one's short strikes are the two walls — $10.00 and $11.00 — so you're betting that the corridor the open interest has built actually holds, supported by a dealer-gamma estimate that points to hedging dampening moves rather than amplifying them.
- Health warning: you're selling premium that hasn't been rich lately. Options are currently priced below the movement NOK has delivered over the past month, which is the worst backdrop for premium selling. On top of that, both short strikes sit inside the ±7.87% implied move — the lower break-even of $9.83 is essentially on top of the implied floor of $9.84. This structure only works if the implied move overstates reality, and the realized-volatility data currently says it understates it.
- Makes sense only if: you have a specific view that the September gap sequence is over and the stock goes quiet into expiration.
- Invalidated if: NOK closes below $10.00 or above $11.00 — at either short strike, close rather than hope.
- Earnings exposure: Expires 27 days before the October 22 report — no earnings-gap risk.
- Managing it: Close at roughly 50% of maximum credit. With max loss at nearly twice max profit, a single gap of the kind NOK produced four times in the past two weeks erases several winners.
- Liquidity note: The $11.00 calls (1¢ wide) and $10.50-area strikes are fine, but the $9.50 puts quote $0.02 bid / $0.04 ask — two cents wide on a three-cent mid. That wing is the slippage risk in this trade; expect to pay up for it.
- Analyze this position →
If none of these: no trade
There is a respectable case for standing aside here, and it has nothing to do with the bias being neutral. It's the volatility arithmetic. NOK's five-day realized movement is running about 1.8× its own 20-day pace, options are priced below what the stock has actually delivered, and the tape has produced four gaps larger than 2% in the last seven sessions — including one of nearly 10%. In that environment, the credit structure is selling cheap insurance into an active mover, and the debit structures need direction within six days to pay. If you don't have a firm view on which side of $10.68 this stock resolves, the honest answer is that $0.16–$0.22 of premium isn't worth a coin flip. Waiting for either a close through $11.00 or a break of $10.00 gives you a level to trade against instead of a range to guess inside.
6 · Quick FAQ
What is NOK's expected move this week? ±$0.84, or ±7.87%, into the September 25 expiration — a $9.84 to $11.52 band, derived from what at-the-money straddles cost as of the September 18 close.
Is NOK expected to go up or down over the next six days? Options positioning as of September 18 reads neutral — short-dated sentiment is flat at +6, medium-dated positioning is call-tilted at +38, and price momentum has turned down over five days — but that's a read of what traders have done, not a forecast. The actionable map is the $9.84–$11.52 range and the $10.00 / $11.00 levels.
Are NOK options expensive right now? IV rank 50/100 says option prices are higher than about half of the past year's readings. On top of that, they're running roughly 7.7 vol points below the movement NOK has actually delivered over the past month — thinner than about 72% of this stock's own recent readings. Verdict: premium is cheap relative to realized movement, which favors buying defined-risk options over selling them this week.
When is NOK's next earnings report? October 22, 2026, before the open — after the October 16 expiration but before October 23, which is why the expected move steps up from ±16.09% to ±19.50% between those two rungs.
Where is NOK's biggest options support and resistance? Put wall $10.00 and call wall $11.00 for the September 25 expiration. Unusually, the whole chain's heaviest call and put strikes sit at the same two levels.
What invalidates this week's read? A close below $10.00.
Methodology & disclosures. Data: end-of-day options-chain snapshot for NOK, 2026-09-18, generated 2026-09-19T19:43:04Z. Prices shown are midpoints and will differ from live markets. Momentum/positioning scores and volatility-premium comparisons are descriptive measurements of past option flow and past price movement — not investment advice, signals, forecasts, or guarantees. Earnings dates and reported results are from the data provider's earnings feed as of 2026-09-19T19:43:04Z; report dates can change. All trade structures are hypothetical. Every structure shown has a defined maximum loss; you can lose the entire max-loss amount. Options involve substantial risk and are not suitable for all investors.