ORCL Options Are Pricing an $11.59 Move — Our Model Sees $114
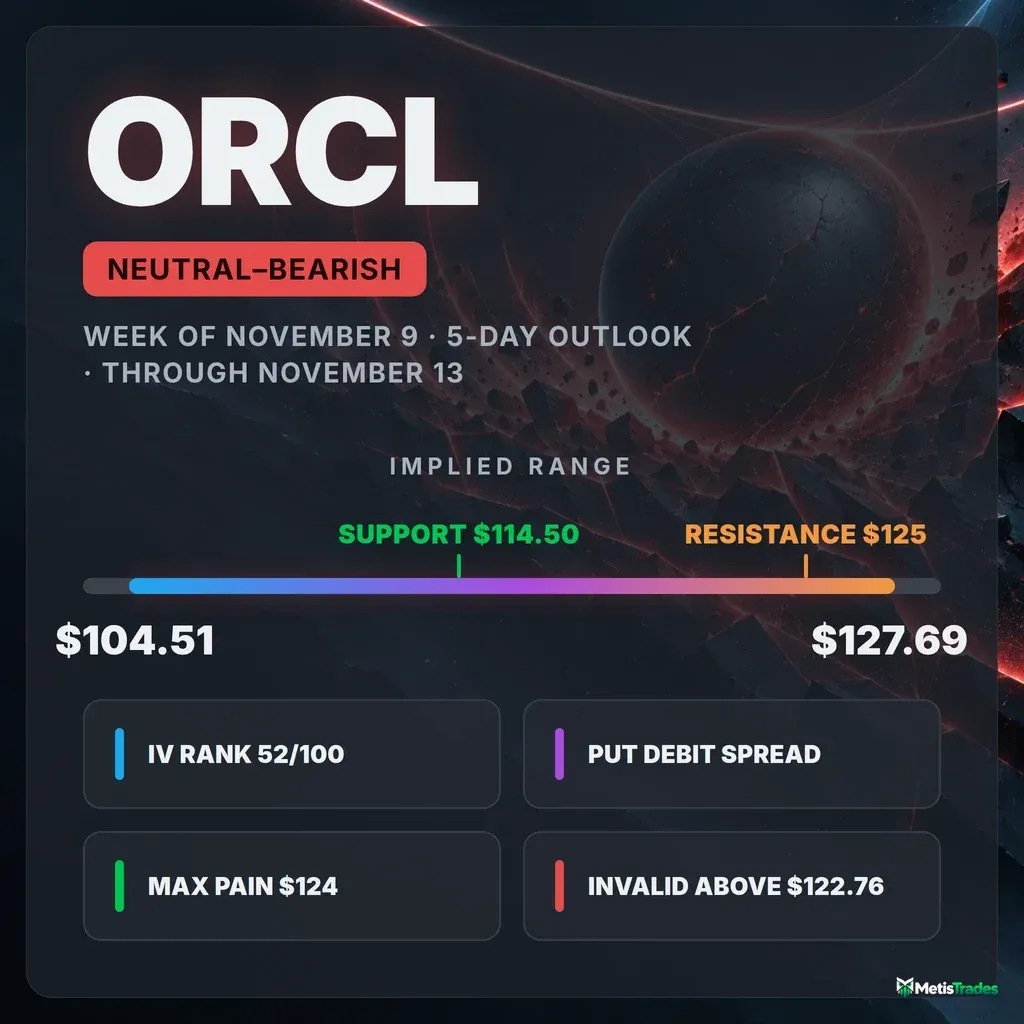
Oracle options imply a $104.51–$127.69 range into the November 13 expiration. Steep put skew, heavy put volume and an aligned downtrend give the setup a slight bearish tilt; below are three defined-risk ways to trade it.
Listen to this analysis — prefer audio? This ORCL outlook is also available as a podcast episode:
The options market implies a $104.51–$127.69 range into the November 13 expiration. Here's what's driving it, where the key levels sit, and three defined-risk ways to trade it.
Published Sunday, November 8, 2026 · Data as of Friday, November 6, 2026 close
Explore the live ORCL options data in the Detailed Options Analyzer →
Quick answer
| Item | Answer |
|---|---|
| Market bias | Slightly bearish (neutral with a bearish tilt) |
| Options-implied range (into Nov 13) | $104.51 – $127.69 (±9.98%, ±$11.59) |
| Major support | $114.50 swing support; below that, $110 (heaviest Nov 13 put open interest below spot). The Nov 13 put wall is at $125.00, which is above spot, so it sits overhead rather than acting as a floor. |
| Major resistance | $125.00 (Nov 13 call wall); $122.76 swing resistance first |
| Max pain (Nov 13) | $124.00 |
| Dealer gamma regime (estimate) | Negative: hedging tends to amplify moves. Flip level n/a (no flip strike resolvable today). |
| Volatility condition | Rising. IV rank 51.66/100. Premium is thin: options are priced ~16 vol pts below delivered movement. |
| Technical check | Confirms (bearish; 3-day target $114.40, 5-day target $114.00) |
| Best-fitting strategy | Nov 13 $115/$110 put debit spread, if you accept the bearish tilt |
| Analysis invalidated if | ORCL closes above $122.76 |
1 · What matters today
ORCL's options market leans slightly bearish heading into the November 13 expiration. The main reason is that traders are paying up for downside protection at a pace that is unusual for this stock. Puts now cost about 9 vol points more than equally distant calls, while the norm for ORCL is roughly 1 point the other way. Options are pricing a move of about $11.59 in either direction, which gives an expected range of $104.51 to $127.69 around Friday's $116.10 close.
The level that changes the picture is $122.76. A close above that swing high would argue the selloff is losing its grip. On the downside, watch $114.50, then the $110 strike. Both technical reports also lean bearish, with targets near $114. Those targets sit inside the options range, so they confirm the read rather than contradict it.
2 · What the options market is pricing
What changed this week
Price. ORCL fell 11.15% over the past five sessions and is down 17.9% over the past month.
Implied volatility. Implied volatility (IV) is the market's estimate of how much ORCL will move, baked into option prices. It rose 15% over the same five days.
Put/call ratios. The put/call open-interest ratio compares put contracts held open to call contracts held open. It climbed from 1.32 to 1.75 in five sessions, so there are now 1.75 puts open for every call, against a 7-day average of 1.57 and a 14-day average of 1.44. Put/call volume shows the same tilt: Friday printed 1.35 puts traded per call, versus a 7-day average of 0.93 and a 14-day average of 0.79. Traders added downside protection at a rapid clip.
Settled history. Into Friday's expiration, the November 6 $110 puts traded nearly 26,000 contracts before expiring essentially worthless.
Trend. The short- and long-term trend reads agree: bearish over the past week, the past month, and the past two-plus months (price is down 23.6% over roughly 50 sessions). A short-lived bullish turn in late October reversed back to bearish on November 4. Near-term flow and the bigger trend point the same way.
Expected move
The expected move is the move the options market is pricing in, derived from what straddles cost. For the November 13 expiration it is ±$11.59, or ±9.98% of the $116.10 spot. That is a 1-standard-deviation band of $104.51 to $127.69.
| Expiration | Implied move | Range around $116.10 |
|---|---|---|
| Nov 13 | ±9.98% | $104.51 – $127.69 |
| Nov 20 | ±13.25% | $100.72 – $131.48 |
| Nov 27 | ±15.32% | $98.31 – $133.89 |
| Dec 4 | ±17.58% | $95.69 – $136.51 |
The rungs widen slowly relative to time. The Nov 13 contracts carry about 72.1% ATM IV, while the Dec 4 contracts carry 63.5%. In other words, the front week is priced richer than the following month, which is the options market's way of flagging near-term stress.
Volatility
Level and rank. At-the-money IV stands at 63.48%. IV rank shows where today's IV sits versus the past year. At 51.66/100, today's IV is cheaper than about 48% of the past year's readings, so it is middle of the road. The 52-week IV percentile of 61.9 says IV was lower than today on about 62% of the past year's days.
Direction. IV dipped 5.1% on Friday from Thursday's spike, but it is up 15% over five days and 29% over 30 days. It sits well above both its 30-day average (55.9%) and its 90-day average (60.8%).
Term structure. Term structure means comparing option prices across different expiration dates. The front-month read is unavailable today because Friday was an expiry day. The per-expiration table above shows the front rung priced above the month.
Realized volatility vs its own norm. Here "unusual" means unusual for ORCL, not versus the broader market. The stock's 20-day realized volatility of about 80% is running well above its recent norm. Movement over the past five days is also accelerating relative to the past month.
Premium rich or cheap. The volatility risk premium is the gap between how much movement options are priced for and how much ORCL has actually delivered. When it's positive, option sellers have been collecting more than realized movement cost them. Today it is sharply negative: options are priced about 16 vol points below the roughly 80% realized volatility ORCL has delivered over 20 days.
On a percentile basis, the gap sits at 4/100 versus this stock's own recent readings, thinner than 96% of them. It was mildly positive through October 27, flipped negative on October 28 when a +12% one-week rally entered the realized window, and has stayed deeply negative through the subsequent selloff. That path reflects genuine price swings, not an earnings artifact.
The "so what": IV rank 51.66 combined with a 4th-percentile premium over delivered movement favors owning premium through defined-risk debit structures over selling it this week.
Skew and sentiment
Skew. Puts and calls the same distance from the stock price don't always cost the same. When puts are pricier, traders are paying up for crash protection. Right now 25-delta puts trade at 68.5% IV versus 59.4% for calls, a gap of about 9.1 vol points. ORCL's 60-day median is −1.0 points, meaning calls are normally slightly richer. Skew is stretched well beyond its own history and has steepened by about 7 points in just five sessions.
Put/call ratios. The put/call ratio measures put activity relative to calls; above 1 means puts dominate. Friday's 1.35 volume ratio is unusually heavy put trading for this name, one of the most extreme readings versus its own norm in the file.
Short-dated sentiment. The one counterweight is in the shortest-dated options. Sentiment in options expiring within a week reads +28, driven entirely by call open interest building on Friday (+4,930 calls versus −2,996 puts). The 7–30 day window reads −5, with richer-than-usual puts offset by some call building. Across expirations the regime reads "Mixed": the bearish pressure is concentrated in skew and volume, not in every corner of the curve.
The key levels map
| Level | Price | Why it matters |
|---|---|---|
| 200-day moving average | $155.40 | Long-term trend line, 25% overhead |
| Whole-chain call wall | $150 | Heaviest call strike across all expirations (66,796 contracts), far out of reach this week |
| 50-day moving average | $139.12 | Below the 200-day, a bearish long-term structure |
| 20-day moving average | $129.36 | Just above the top of the implied range |
| Upper implied rail (Nov 13) | $127.69 | Edge of the 1σ expected move |
| Nov 13 call wall and put wall | $125.00 | The strike with the biggest pile of open contracts, which often acts like a magnet or barrier. For Nov 13, both the largest call and largest put open interest sit here. |
| Max pain (Nov 13) | $124.00 | The price where the most option value would expire worthless. Expirations sometimes gravitate toward it. It sits 7% above spot. |
| Swing resistance | $122.76 | Nearest heuristic overhead pivot, and this article's invalidation level |
| Whole-chain put wall / largest gamma strike | $120 | 74,926 puts open across all expirations; the single heaviest gamma strike |
| Spot (Friday close) | $116.10 | Reference price |
| Swing support | $114.50 | Nearest heuristic floor from recent pivots |
| Nov 13 heavy put strike | $110 | 2,793 puts open, the largest Nov 13 put pile below spot; also a top-five gamma strike |
| 52-week low | $109.21 | Spot is only 6.3% above it |
| Gamma strike | $105 | Fifth-largest gamma concentration in the chain |
| Lower implied rail (Nov 13) | $104.51 | Edge of the 1σ expected move |
Positioning and unusual flow
Dealer gamma. Market makers hedge the options they've sold. One rough estimate puts ORCL in a negative gamma regime, for both the Nov 13 expiration and the chain as a whole. In that regime, dealer hedging tends to amplify moves rather than dampen them. No gamma-flip level could be resolved today, so there is no estimated price above which that behavior reverses. Treat this as an estimate built on an assumed dealer convention, not observed inventory.
Walls above spot. The 5-day expiration's call wall and put wall both sit at $125.00, and the whole chain's heaviest put strike is $120. Most of that put open interest is now in the money after the slide. Those piles reflect protection bought at higher prices, so they sit overhead rather than below spot.
Notable flow (all tradeable, non-expired contracts):
- Nov 13 $120 calls: 5,700 contracts traded against 212 open the prior day, and open interest jumped by 1,472. That is about $1.65 million of premium. Someone is positioning for a sharp bounce, or selling into one.
- Nov 13 $110 puts: 6,710 contracts traded (about $1.52 million of premium), and open interest rose to 2,793. That reinforces $110 as the week's downside reference.
- Dec 18 $100 puts: open interest rose 4,647 to 19,358 contracts, a sign that longer-dated crash protection is still being added.
3 · Technical check
3-day report. The near-term technical model is bearish, with a $114.40 target and a projected range of $111.50–$117.50 (its own forecast, not what options are pricing). The target sits well inside the options-implied $104.51–$127.69 band and matches the options lean, so the classification is Confirms. The most decisive reads are a strong trend reading (ADX 39 and rising, sellers firmly in control) and persistently negative money flow (CMF −0.18). Its key levels are support at $113.69 and resistance at $116.70, and its dominant breakdown scenario is invalidated on a close above $118.30.
5-day report. The model aligned with the Nov 13 target date is also bearish, targeting $114.00 with a projected range of $108.50–$119.00. That also Confirms. It describes the past two sessions as a bearish flag (a tight pause after a sharp drop) and flags $120.54 as resistance and the line its dominant scenario's invalidation hinges on.
Model vs. Market: The options market implies $104.51–$127.69 into Nov 13; the 5-day technical model targets $114.00 with a $108.50–$119.00 range. The chart model expects a drift lower inside a band about half as wide as the one options are priced for. That is a hint that the market's ±$11.59 cushion may be generous if the flag resolves quietly.
The TA nudged strike selection: the range structure below is centered at $115, close to both technical targets, and the bearish spread's short strike sits at $110, inside the 5-day model's range.
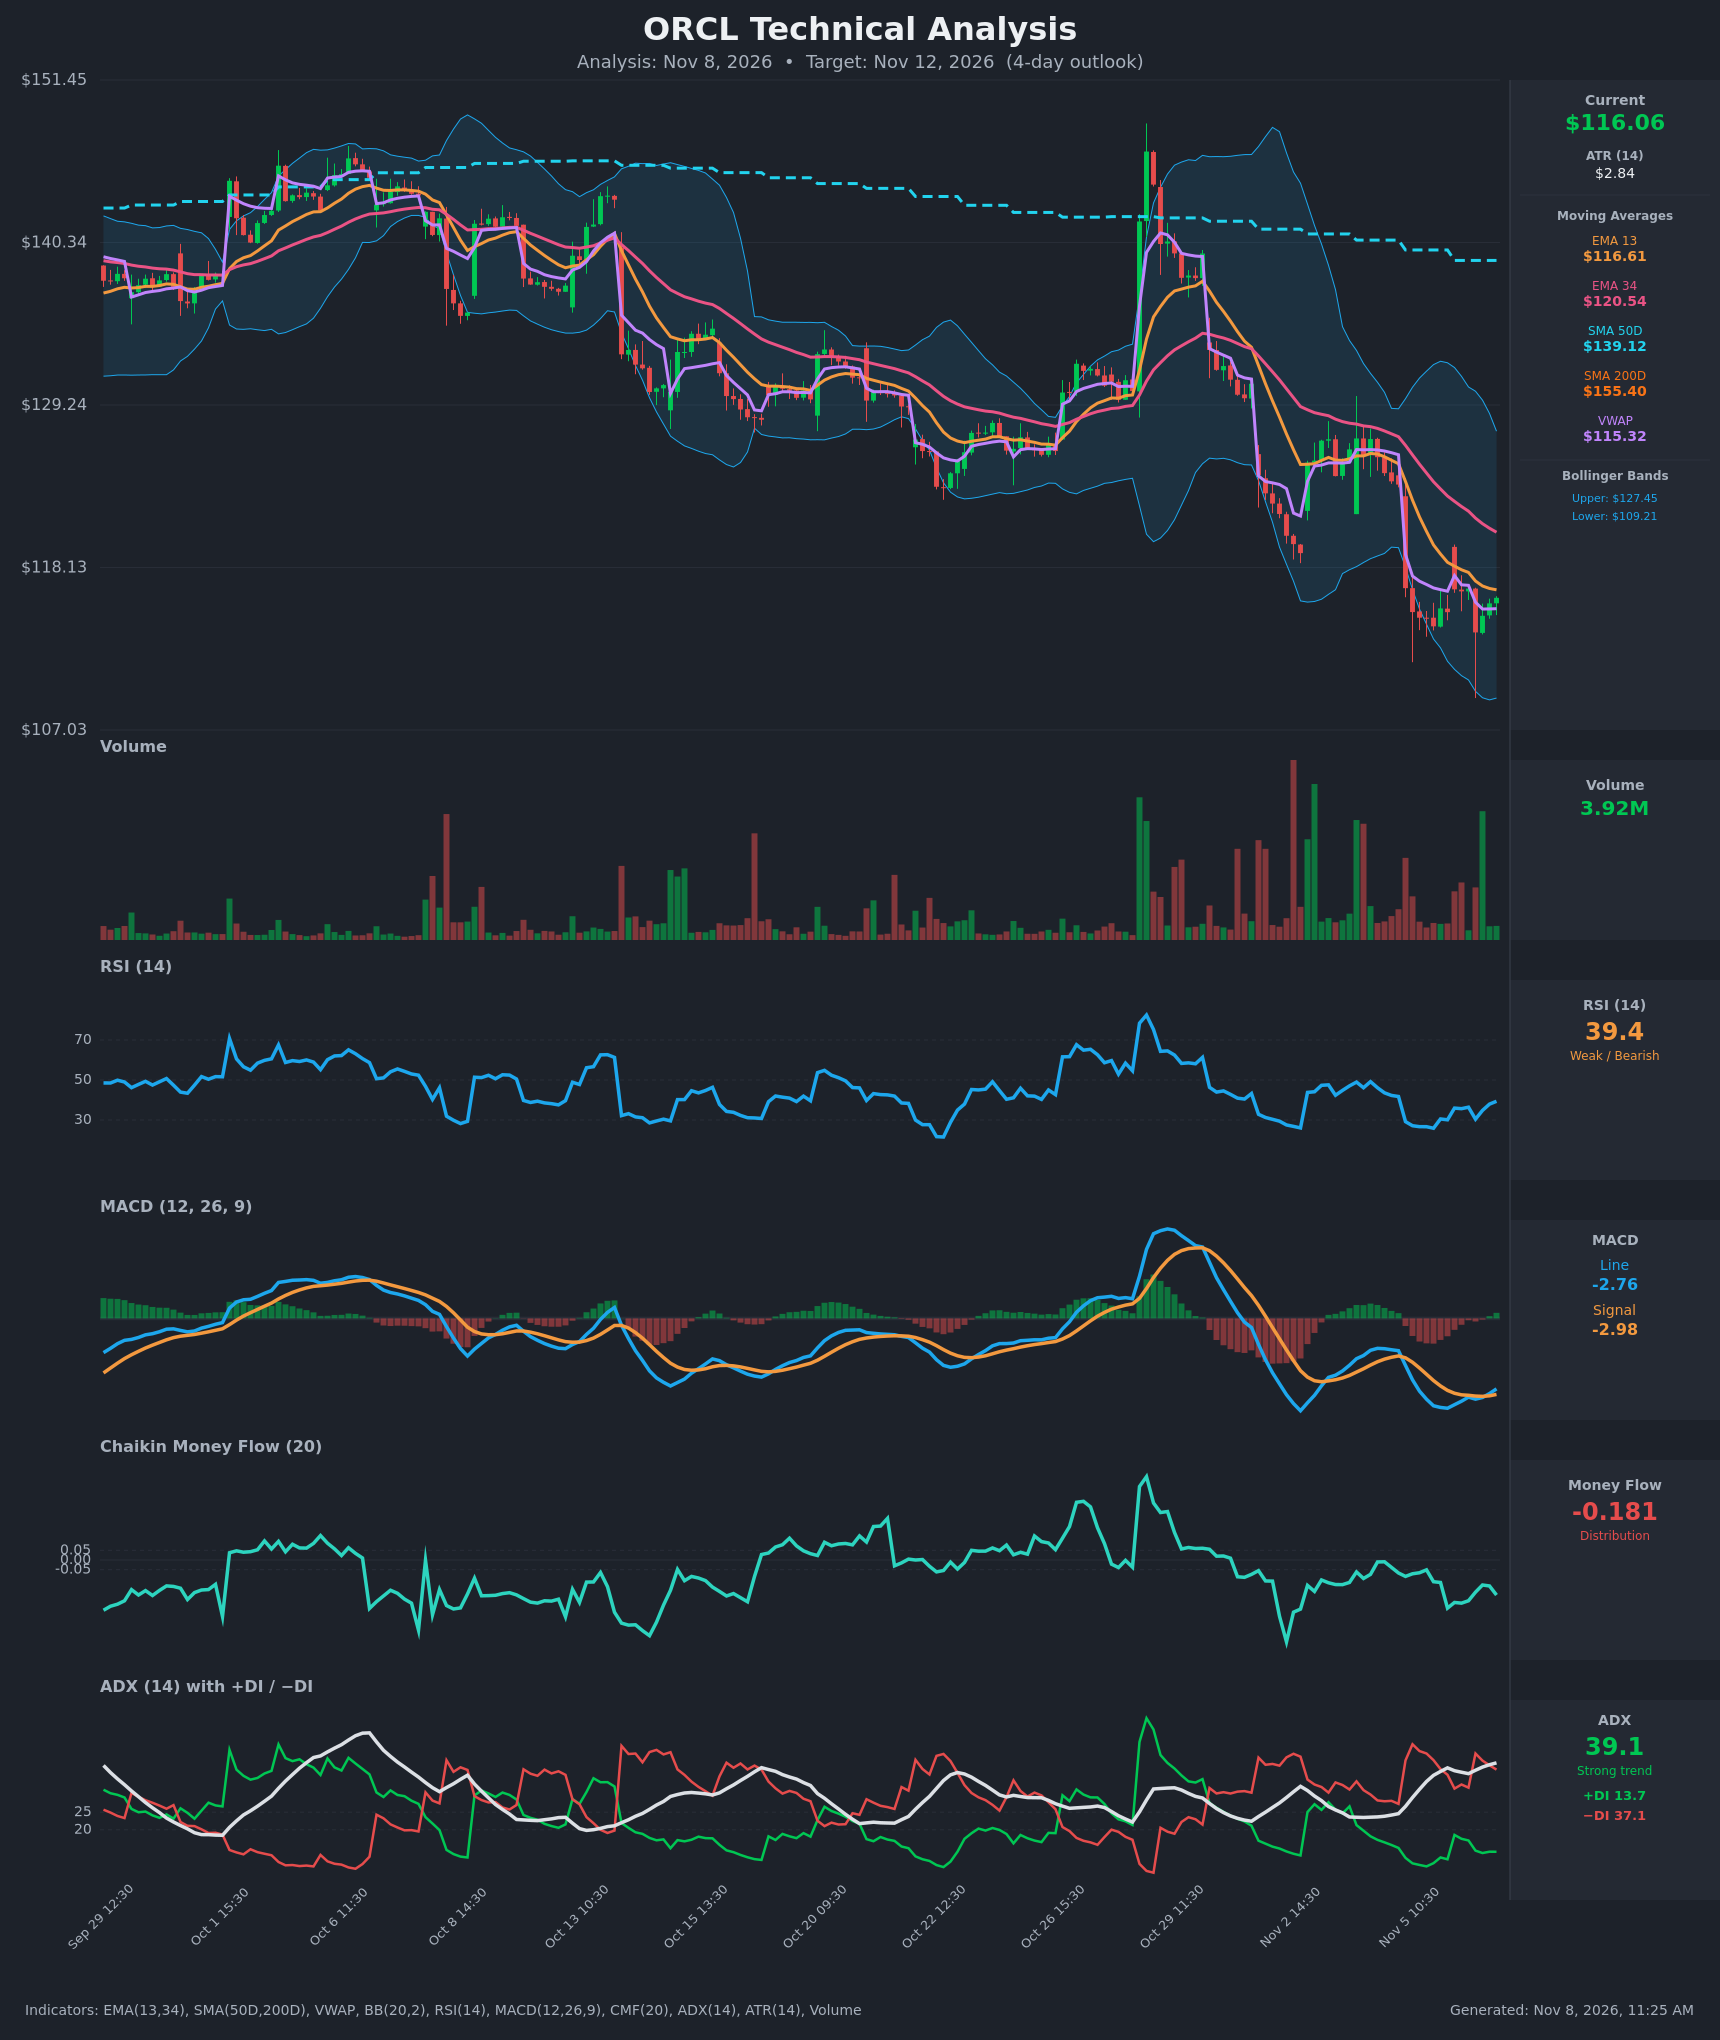
Full technical write-ups: 3-day report → · 5-day report →
4 · Three ways the next five sessions can go
If ORCL pushes toward the call wall ($125.00): A rally would first meet swing resistance at $122.76, then max pain at $124.00 and the stacked call and put open interest at $125.00. A move there would be a full expected-move rally against an aligned downtrend. In a negative-gamma regime, a squeeze can run fast, which is exactly the tail Friday's $120 call buyers are positioned for. A close above $122.76 is where this article's read stops working.
If ORCL drifts between $110 and $122.76: This is the base case positioning describes. Max pain at $124.00 sits above spot and can exert some upward pull into expiration as in-the-money puts lose value. Against that, skew and put volume show traders still paying for downside, and the technical flag points to a grind near $114. Expiring open interest at $110 and $125.00 frames the box.
If ORCL breaks below $114.50: This is the acceleration case. Below the swing support and the technical $113.69 floor, the next reference is the $110 put pile, then the 52-week low at $109.21. With no resolvable flip level and one rough estimate putting the whole chain in negative gamma, dealer hedging tends to add to selling rather than cushion it. Realized volatility already running near 80% shows how quickly ORCL has covered ground lately.
5 · Three defined-risk structures
Prices are end-of-day midpoints as of November 6, 2026. All structures are hypothetical. Verify live prices before trading; these will be stale by the open.
Because options are priced well below the movement ORCL has actually delivered, all three ideas are debit structures. You pay a defined amount up front rather than selling premium that hasn't been rich lately. The bearish structure leads because it matches the article's tilt.
If you lean bearish: Nov 13 put debit spread
- Trade: Buy the Nov 13 $115 put, sell the Nov 13 $110 put. You pay a debit and profit if ORCL falls toward or below $110 by expiration.
- Debit: $1.82 ($4.075 − $2.26) · Max profit: $3.18 ($318.50 per spread) · Max loss: $1.82 ($181.50 per spread) · Break-even: $113.19
- Why it fits: Skew is 9 points steeper than ORCL's norm, put volume is unusually heavy, and the trend reads are bearish across every horizon. The $110 short strike sits on the week's biggest put pile below spot and inside the 5-day technical range. Buying rather than selling premium suits a 4th-percentile volatility risk premium.
- Makes sense only if: ORCL fails to reclaim the $116.70–$118.30 technical resistance zone early in the week.
- Invalidated if: ORCL closes above $120.
- Managing it: Take profits around 50–60% of max value if $110 is tested early. Short-term weakness inside a falling trend argues for not overstaying. Exit by the close on November 12 to avoid expiration-day pin risk near $110.
- Liquidity note: The $115 puts traded 15¢ wide and the $110 puts 10¢ wide on Friday. Fills should be workable near the mid.
- Analyze this position →
If you expect the range to hold: Nov 13 put butterfly centered at $115
- Trade: Buy one Nov 13 $110 put, sell two Nov 13 $115 puts, buy one Nov 13 $120 put. This is a cheap debit bet that ORCL settles near $115.
- Debit: $0.89 ($2.26 + $6.775 − 2 × $4.075 = $0.885) · Max profit: $4.12 ($411.50 per butterfly, at $115 on expiration) · Max loss: $0.89 ($88.50 per butterfly) · Break-evens: $110.89 and $119.12
- Why it fits: Both technical targets ($114.40 and $114.00) cluster near the center strike. The butterfly also replaces the usual iron condor: with the volatility risk premium this negative, you'd be selling premium that hasn't been rich lately, while a butterfly risks only its small debit.
- Makes sense only if: The bear flag keeps consolidating rather than breaking hard in either direction.
- Invalidated if: ORCL closes below $110 or above $120.
- Managing it: Butterflies pay most in the final days. Consider closing at 2–3× the debit if ORCL sits near $115 on November 11 or 12 rather than holding into the close.
- Liquidity note: The $110 puts traded 10¢ wide, the $115s 15¢, and the $120s 25¢. Work the order as a single package near the mid.
- Analyze this position →
If you lean bullish: Nov 13 call debit spread
- Trade: Buy the Nov 13 $115 call, sell the Nov 13 $120 call. You pay a debit and profit if ORCL rebounds toward $120.
- Debit: $2.33 ($5.225 − $2.90 = $2.325) · Max profit: $2.68 ($267.50 per spread) · Max loss: $2.33 ($232.50 per spread) · Break-even: $117.33
- Why it fits: This is the contrarian case. Friday's heavy $120 call buying, call open interest building in the shortest-dated options, and max pain at $124.00 above spot all leave room for a relief bounce. The $120 cap sits at the whole chain's largest gamma strike.
- Makes sense only if: ORCL closes back above the $116.70 technical resistance early in the week.
- Invalidated if: ORCL closes below $113.69.
- Managing it: This trade fights an aligned downtrend, so keep it short-leashed. Take profits near $119–$120 and exit no later than November 12.
- Liquidity note: The $115 calls traded 15¢ wide and the $120 calls 12¢ wide, among the most active Nov 13 contracts.
- Analyze this position →
If none of these: no trade
Standing aside is a legitimate call this week. ORCL is moving at roughly 80% realized volatility, and one rough estimate puts dealers in a negative-gamma regime. Single sessions of 3–4% gaps have been routine, as Friday's 3.8% gap up from $115.16 shows. Short-dated debit spreads can be right on direction and still get whipsawed out before expiration.
Selling premium is no refuge either. Options are priced well below what the stock is actually delivering, so credit sellers are being paid less than recent movement would cost them. If you don't have a firm view on whether the $113.69–$116.70 flag resolves down or up, the cleanest position is none.
6 · Quick FAQ
What is ORCL's expected move this week? About ±$11.59 (±9.98%) into the November 13 expiration, a range of $104.51 to $127.69 based on straddle pricing as of November 6, 2026.
Is ORCL expected to go up or down over the next week? Options positioning as of November 6 leans slightly bearish, driven by steep put skew and unusually heavy put volume. That's a read of what traders have done, not a forecast. The actionable map is the $104.51–$127.69 range, with $114.50 support and $125.00 resistance.
Are ORCL options expensive right now? IV rank of 51.66/100 says option prices sit mid-range versus the past year. However, they're running about 16 vol points below the movement ORCL has actually delivered, thinner than 96% of this stock's own recent readings. That favors defined-risk buying over selling premium.
Where is ORCL's biggest options support and resistance? For November 13, both the call wall and the put wall sit at $125.00, above spot, with max pain at $124.00. Below spot, the practical levels are $114.50 swing support and the $110 put strike.
What invalidates this week's read? A close above $122.76.
Methodology & disclosures. Data: end-of-day options-chain snapshot for ORCL, 2026-11-06, generated 2026-11-08T11:25:21.592Z. Prices shown are midpoints and will differ from live markets. Momentum/positioning scores and volatility-premium comparisons are descriptive measurements of past option flow and past price movement — not investment advice, signals, forecasts, or guarantees. All trade structures are hypothetical. Every structure shown has a defined maximum loss; you can lose the entire max-loss amount. Options involve substantial risk and are not suitable for all investors.