ORCL Options Price an $11 Move Into September 18 — The Chart Model Points to $146.75
Oracle's options market is pricing a $139.13–$161.43 range into the September 18 expiration, with the heaviest put open interest at $140 and the heaviest call open interest at $165. Our positioning read is genuinely balanced; the technical models lean lower. Here's the map and three defined-risk ways to trade it.

The options market implies a $139.13–$161.43 range into the September 18 expiration; here's what's driving it, where the walls sit, and three defined-risk ways to trade it.
Published Sunday, September 13, 2026 · Data as of Friday, September 11 close
Explore the live ORCL options data in the Detailed Options Analyzer →
Quick answer
| Item | Answer |
|---|---|
| Market bias | Neutral |
| Options-implied range (into September 18) | $139.13 – $161.43 (±7.42%, about ±$11.15) |
| Major support | $140.00 — the September 18 put wall |
| Major resistance | $165.00 — the September 18 call wall |
| Max pain (September 18) | $150.00 |
| Dealer gamma regime (estimate) | Positive — hedging tends to dampen moves; flip level ≈ $185 |
| Volatility condition | Falling — IV rank 20/100 · premium thin: options priced about 0.7 vol points above delivered movement (earnings-distorted) |
| Next earnings | September 14, after the close — before the September 18 expiration |
| Technical check | Mixed (bearish on both the 2-day and 4-day models, targets inside the implied range) |
| Best-fitting strategy | Iron condor anchored to the $140 put wall and $165 call wall |
| Analysis invalidated if | ORCL closes below $140 |
1 · What matters today
Oracle closed Friday, September 11 at $150.28, and the options market is pricing roughly $11.15 up or down — a $139.13 to $161.43 band — into the September 18 expiration. That is the move the options market is pricing in, derived from what at-the-money straddles cost. Our read of positioning comes out genuinely balanced: put open interest built fast on Friday, but short-dated sentiment and the skew still lean call-side, and the two cancel out. The single most important number is max pain at $150.00 — the price where the most option value would expire worthless — sitting almost exactly at spot, with heavy open interest walls at $140 below and $165 above. With the September 14 earnings report inside this window, every September 18 structure carries gap risk. The chart models lean bearish but target prices well inside the implied band. A close below $140 kills this read.
2 · What the options market is pricing
What changed this week
Two things dominate. First, option prices collapsed: at-the-money implied volatility — the market's estimate of how much ORCL will move, baked into option prices — printed 49.59%, down 34.9% in a single session and 25.0% over five days, against a 30-day average of 68.3%. IV rank fell to 20/100, versus a 14-day average of about 61. Second, the money moved sides: call open interest fell by 76,557 contracts while put open interest rose by 70,255 in one day, pushing the put/call open-interest ratio from 1.06 to 1.14 over five sessions. For every call contract held open there are now 1.14 puts; the 7-day average was 1.01. Total option volume ran 4.6× its 20-day average — this was not a quiet tape. The underlying is down 2.44% over five sessions and 3.81% over twenty. Our short-, medium- and long-term trend reads agree on one thing: no trend at all, in either direction. (Into the September 11 expiration, the $140 puts added 8,532 contracts of open interest — settled history now, but it tells you where the fear was parked.)
Expected move
Into September 18, straddle pricing implies about ±$11.15 (±7.42%) around Friday's close — a $139.13 to $161.43 range.
| Expiration | Implied move | Range around $150.28 |
|---|---|---|
| September 18 (7 days) | ±7.42% | $139.13 – $161.43 |
| September 25 (14 days) | ±9.91% | $135.39 – $165.17 |
| October 2 (21 days) | ±12.03% | $132.20 – $168.36 |
| October 16 (35 days) | ±15.29% | $127.30 – $173.26 |
Note what the ladder does not do: the per-expiration at-the-money IV actually falls as you go further out — 53.6% at the September 18 rung versus 49.4% at the October 16 rung. Options expiring after a scheduled earnings report normally price in the extra jump risk of that report, and here that hump is already sitting inside the very first rung, because the report lands on September 14.
Volatility
At-the-money IV of 49.59% puts IV rank at 20/100 — option prices are cheaper than roughly 80% of the past year's readings. The direction is unambiguously down: −34.9% in one session, −25.0% over five days, −24.4% over thirty, and well below both the 30-day (68.3%) and 90-day (65.8%) averages. The front-month reading and term structure are unavailable today — Friday was an expiry day, so there is no tradeable near contract to interpolate from, which is a calendar artifact rather than missing data. Two "vs its own norm" observations stand out, meaning unusual for ORCL rather than versus the broader market: that one-day IV compression is far outside this stock's own recent range, and 20-day realized volatility of 48.9% is actually below its own norm — a reminder of how violent this name has been. Short-window movement is still accelerating: 5-day realized vol is running about 12% above the 20-day.
Premium rich or cheap? The volatility risk premium — the gap between how much movement options are priced for and how much ORCL has actually delivered — sits at roughly 0.7 vol points, richer than only about 28% of this stock's own recent readings. In plain terms: option sellers are being paid almost nothing above what realized movement has been costing them. That gap collapsed from about 27 vol points a session earlier, and the collapse is mechanical — Friday's IV reset plus a month of huge daily gaps sitting inside the realized-volatility window, not a trader signal. And the caveat that matters most: with the September 14 report one session away, some of what is left in that premium is the market pre-pricing a scheduled event, not free money. Neither "cheap" nor "rich" is an edge this week; IV rank alone says premium is historically low, which argues against selling it aggressively.
Earnings on the calendar
Oracle reports on September 14, after the close — one session after this article publishes and four days before the September 18 expiration this outlook is built around. That is why the front rung of the ladder carries the highest at-the-money IV of any expiration out to December, and why the September 18 chain is where all the volume went on Friday. Every structure anchored to that expiration spans the report and can gap through either strike overnight. On history, in dollar terms: the last three reports came in above the consensus estimate, and the one before that was a penny short. No consensus estimate is published in the data for this quarter.
Skew and sentiment
Skew — the fact that puts and calls the same distance from the stock price don't cost the same — is running the "wrong" way for a nervous tape. Twenty-five-delta calls are priced at 51.43% implied volatility against 48.97% for the equivalent puts, a 2.5-vol-point premium for calls versus a 60-day norm of about 1.3 points. Traders are paying up for upside, not for crash protection. That said, our read of flow shows the gap narrowing over the past five sessions as put buyers came back.
Put/call volume finished at 0.59 — slightly put-heavy versus the 7-day average of 0.48, right in line with the 14-day average of 0.59. Sentiment in short-dated options reads mildly bullish (the 0–7 day bucket) and more clearly bullish in the 7–30 day bucket, where call-side flow dominated; the overall regime label is "broadly bullish." Pulling the other way: put-side sweeps outnumbered call-side sweeps 10 to 7 among contracts clearing the peer-relative unusual bar, an unusually put-tilted showing for this name, and the one-day put open-interest build was one of the strongest this stock has produced recently. That contradiction is exactly why the bias lands at Neutral rather than picking a side.
The key levels map
| Level | Price | Why it matters |
|---|---|---|
| Gamma flip (estimate) | $185 | One rough estimate of where market-maker hedging changes character; far above spot |
| Swing resistance | $170.70 | Heuristic swing-pivot cluster from recent price structure |
| Call wall — September 18 | $165.00 | Heaviest call open interest for this expiration (22,210) — big call piles often act as a ceiling |
| Top of implied range | $161.43 | Upper rail of the ±7.42% move priced into September 18 |
| Whole-chain heaviest call strike | $160.00 | Across all expirations combined, $160 holds the most calls (59,218) — the aggregate and the September 18 row disagree, so treat $165 as this week's ceiling and $160 as the medium-term one |
| Swing resistance | $159.26 | Heuristic level from recent pivots |
| Second-heaviest September 18 call strike | $155.00 | 16,567 calls open; also one of the five largest gamma strikes chain-wide |
| Swing resistance | $153.99 | Nearest overhead pivot cluster |
| Spot | $150.28 | Friday's close |
| Max pain — September 18 | $150.00 | Where the most option value would expire worthless; also the single largest gamma strike in the chain |
| 20-day moving average | $149.38 | Price sits 0.6% above it |
| Swing support | $148.89 | Nearest pivot support underneath |
| 50-day moving average | $140.68 | Price sits 6.82% above it |
| Put wall — September 18 | $140.00 | Heaviest put open interest for this expiration (18,982), and the heaviest put strike chain-wide (59,681) — the aggregate and the week agree here |
| Bottom of implied range | $139.13 | Lower rail of the ±7.42% move |
| Swing support | $137.43 | Next pivot cluster below the wall |
| 52-week low | $114.50 | Price sits 31.25% above it; 54.6% below the 52-week high of $331 |
Positioning and unusual flow
For the September 18 expiration, one rough estimate of dealer positioning reads positive — in that regime, market makers' hedging of the options they've sold tends to dampen moves rather than amplify them, which fits the max-pain-at-$150 picture. Read it as an estimate, not observed inventory: the same block puts the flip level near $185, well above spot, and spot is sitting unusually far below that flip estimate by this stock's own standards. Positive-gamma pinning and a binary event inside the window are not natural partners.
Three non-expired flow items worth naming. The September 18 $160 calls traded 41,919 contracts against 20,718 open — about $6.5 million of premium changing hands, the busiest call line on the board. The September 18 $150 puts traded 15,703 contracts on 18,978 open for roughly $6.6 million, the single largest premium line in the chain — money parked right at max pain. Further out, the October 16 $200 calls added 5,462 contracts of open interest on 12,688 traded: cheap, far-out-of-the-money upside lottery tickets that someone is still buying.
3 · Technical check
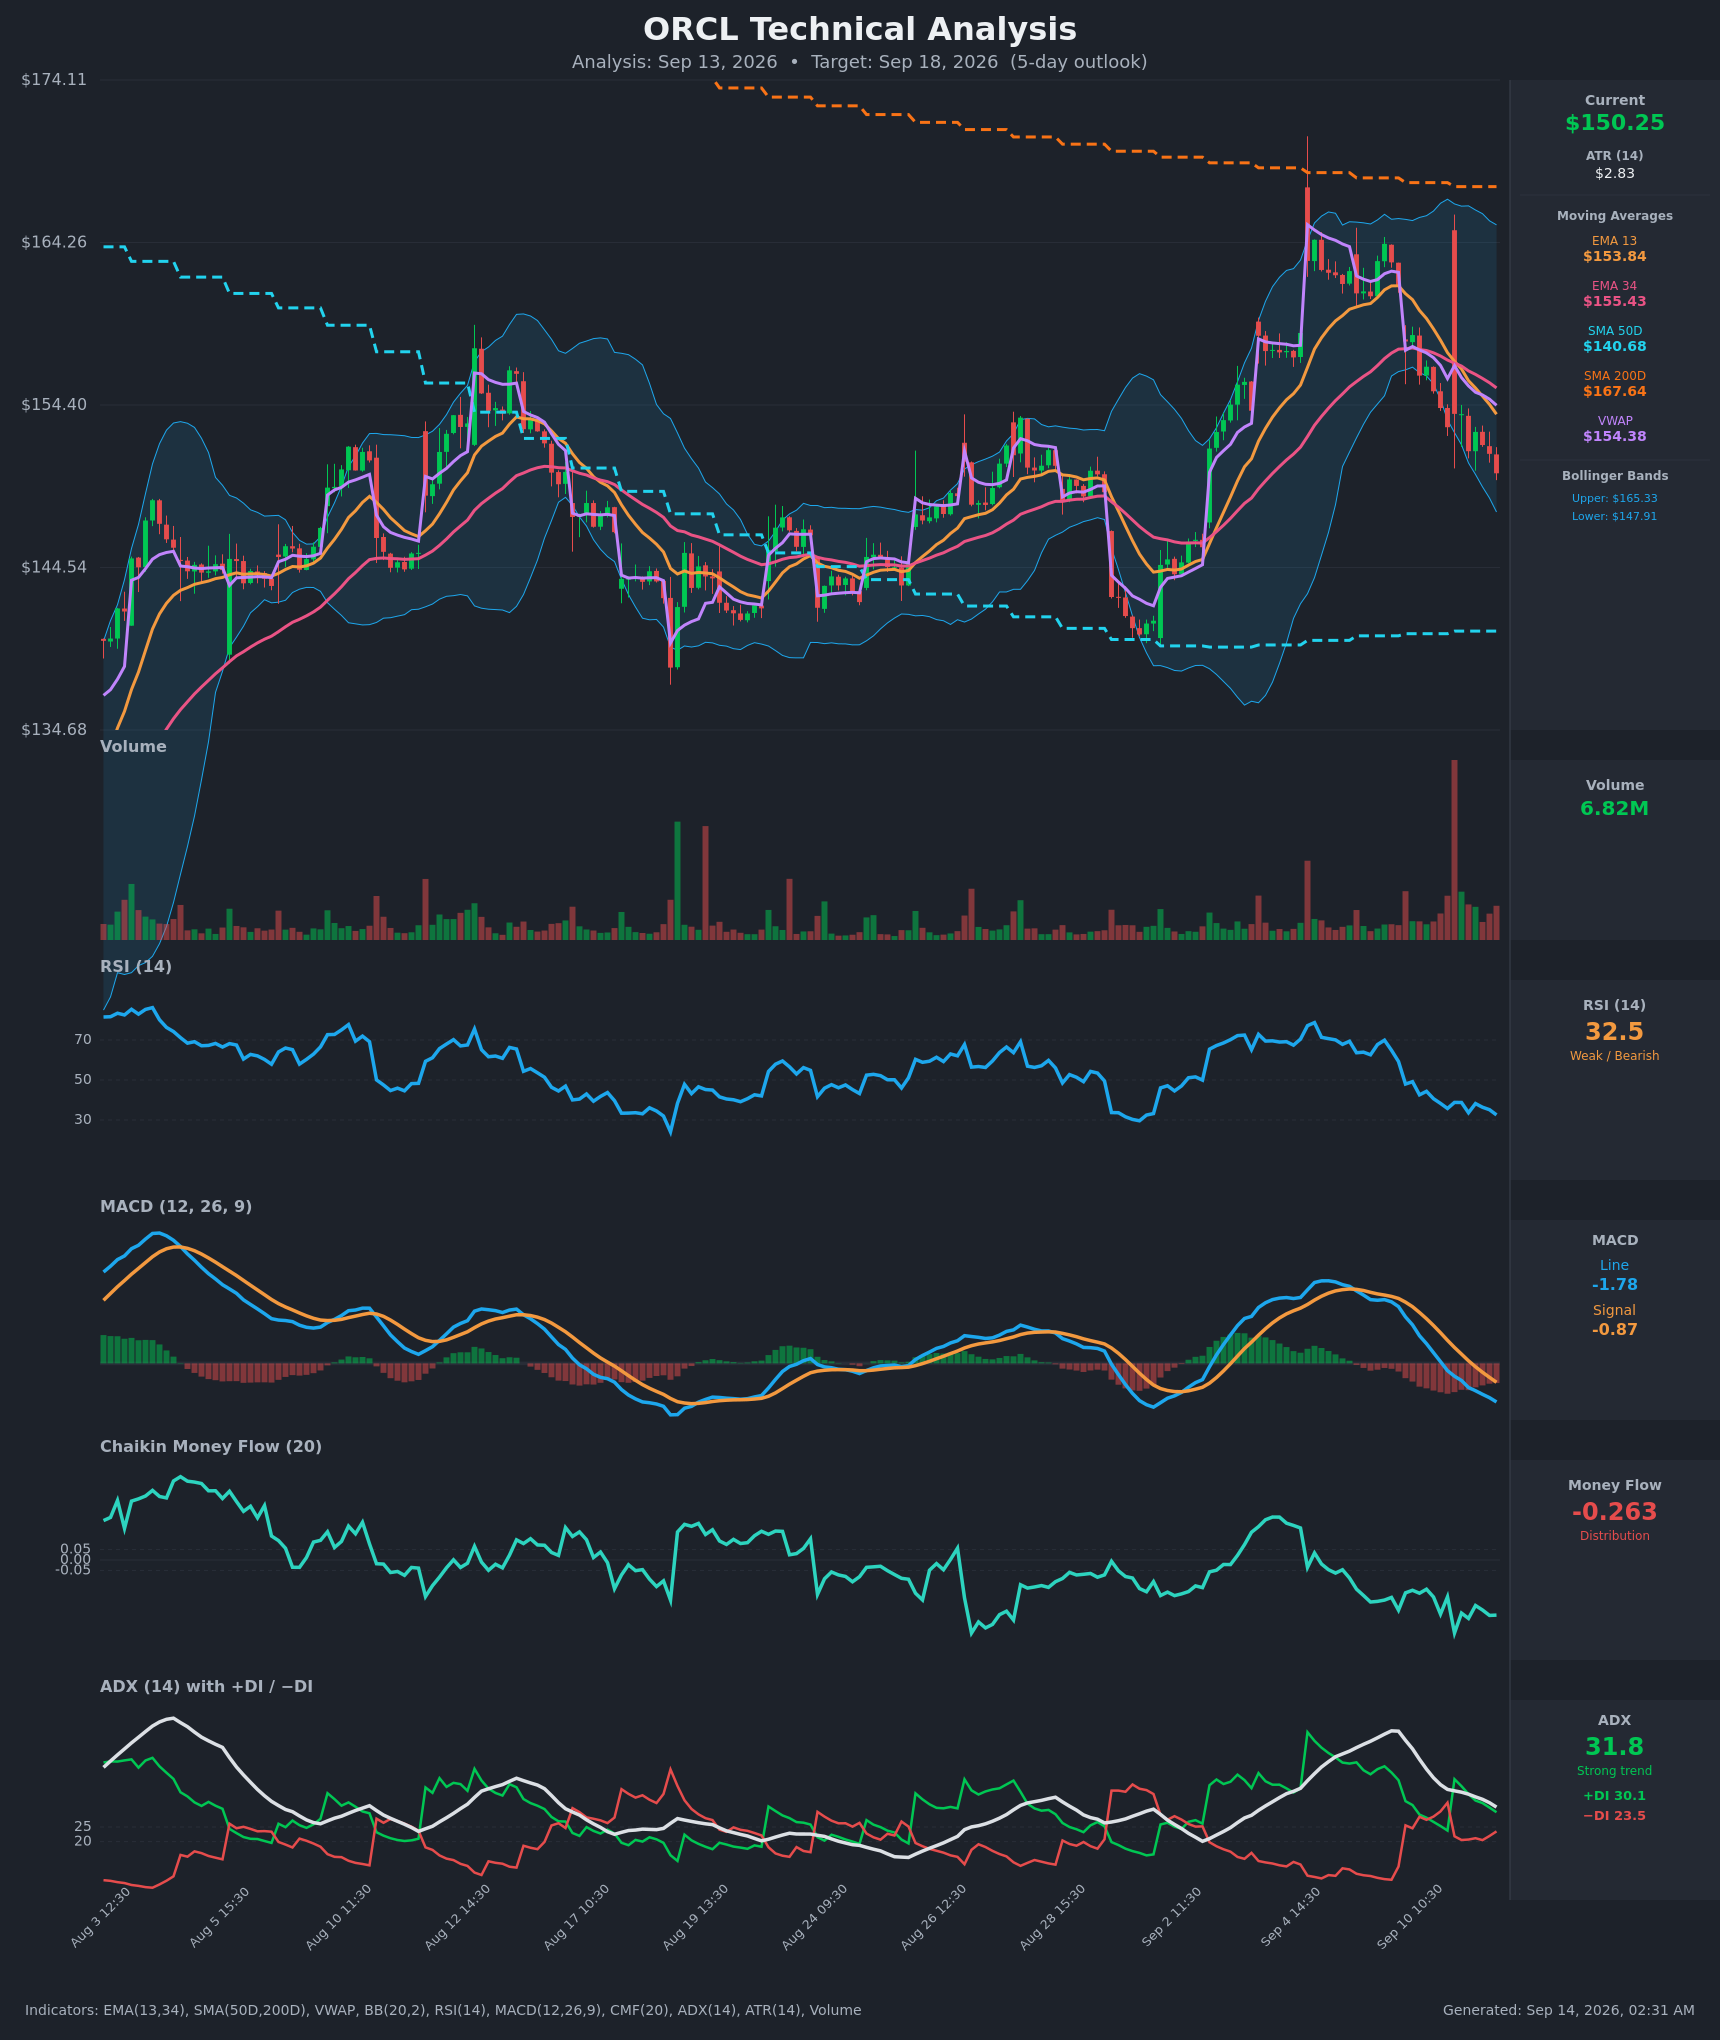
Both technical models lean bearish. The 2-day model targets $148.90 with a projected range of $147.30 to $152.20, citing RSI at 31.7, price below both short EMAs, and money flow at −0.135 confirming distribution — though ADX at 14.3 marks the downtrend as weak and decelerating. Its dominant scenario invalidates on a reclaim of $152.24.
The 4-day model, which lands on the September 18 expiration itself, targets $146.75 with a projected range of $143.50 to $153.50. It flags a fresh bearish EMA crossover, a widening negative MACD histogram, and sustained distribution, with its 50%-probability scenario looking for a break below $147.50 toward $143–$145 and invalidating on a reclaim and hold above $151.50. Classification: mixed. The direction contradicts our balanced options read, but both targets sit comfortably inside the options-implied band, so the disagreement is about lean, not magnitude.
Model vs. Market: The options market implies $139.13–$161.43 into September 18; the 4-day technical model targets $146.75 with a $143.50–$153.50 range. The chart model's entire projected range fits inside the middle third of what options are pricing — the chart sees a drift lower, while the options market is bracing for an event the chart cannot see.
Practical effect on strikes below: the bearish tilt in the chart work is why the bearish structure uses a nearer short strike than the bullish one, and why the condor's put wing is the side carrying the real risk.
Full technical write-ups: 2-day report → · 4-day report →
4 · Three ways the next four days can go
If ORCL pushes above the call wall ($165): that strike holds 22,210 calls for September 18 — the heaviest overhead pile, and the kind of level that tends to slow rallies as dealers hedge into it. A clean break through leaves comparatively thin positioning until the $167.50 and $175 lines, where open interest drops sharply. Note that the whole chain's heaviest call strike is $160, not $165, so the first friction on the way up arrives before the week's wall.
If ORCL drifts between the walls: this is the pin case, and it is the one the positioning map favors. Max pain for September 18 sits at $150.00, effectively on top of Friday's close, and $150 is simultaneously the largest gamma strike in the entire chain. With the estimated dealer gamma regime positive for this expiration, hedging flows and expiring open interest at $150, $145 and $155 tend to pull price toward the middle as the days burn off — assuming Monday's report doesn't reset the whole distribution first.
If ORCL breaks below the put wall ($140): 18,982 puts sit at that strike for September 18, and it doubles as the heaviest put strike across the chain. Below it, the map thins quickly toward the $137.43 swing cluster, and the 50-day moving average at $140.68 is already in the way. Worth flagging honestly: spot sits unusually far below the estimated flip level for this name, so the "hedging cushions the move" read is the weaker half of that estimate. A close below $140 is the level that invalidates this article's read.
5 · Three defined-risk structures
Prices are end-of-day midpoints as of 2026-09-11. All structures are hypothetical. Verify live prices before trading — these will be stale by the open, and Monday's earnings report will reprice every one of them.
If you expect the range to hold: iron condor at the walls
- Trade: Sell the September 18 $140/$135 put spread and the September 18 $165/$167.50 call spread. You collect premium up front and keep it if ORCL finishes between the short strikes.
- Credit: $0.735 ($73.50 per condor) · Max profit: $73.50 · Max loss: $426.50 (below $135; the call side risks $176.50) · Break-evens: $139.27 and $165.74
- Why it fits: The short strikes are the September 18 put wall ($140) and call wall ($165), and max pain sits at $150 — dead center. The wings are deliberately unequal: the put side is 5 points wide, the call side 2.5, which concentrates the maximum loss on the downside, the side both technical models favor.
- Makes sense only if: you believe the earnings reaction stays inside the ±7.42% the market is pricing. That is a bet on magnitude, not direction.
- Invalidated if: ORCL closes below $140 or above $165.
- Earnings exposure: spans the September 14 report — premium is elevated for that reason, and the position can gap straight through either short strike overnight.
- Managing it: $73.50 of credit against $426.50 of risk is a thin ratio by any standard; if you take it, size small, close at roughly 50% of max credit, and don't hold a tested side hoping for a reversion into Friday.
- Liquidity note: the $140 puts traded 5¢ wide on 8,388 contracts and the $165 calls 5¢ wide on 20,981 — tight in dollar terms, but on options priced under $1 a nickel is a real percentage. Expect to give up several cents of edge on a four-leg fill.
- Analyze this position →
If you lean bullish: $155/$165 call debit spread
- Trade: Buy the September 18 $155 call, sell the September 18 $165 call. You pay a debit and win if ORCL closes above your break-even.
- Debit: $1.87 ($187) · Max profit: $813 · Max loss: $187 · Break-even: $156.87
- Why it fits: With IV rank at 20/100 and the premium over delivered movement running thin, paying for optionality costs less than usual. The short strike is parked exactly at the September 18 call wall, where the heaviest call open interest already caps the realistic upside.
- Makes sense only if: you think a positive reaction carries price through the $155 call pile and up toward $160–$165 — a move of roughly 4.5% just to break even.
- Invalidated if: ORCL closes below $148.89, the nearest swing support; below that the spread's odds deteriorate fast with four days left.
- Earnings exposure: spans the September 14 report — the whole thesis resolves overnight, and the debit is the entire risk.
- Managing it: with the short- and long-horizon trend reads both flat and the chart models leaning the other way, take profits early rather than holding for the full width — a double on the debit is a good outcome here.
- Liquidity note: the $155 calls traded 7¢ wide on 19,230 contracts, the $165 calls 5¢ wide on 20,981. This is the most liquid corner of the chain; fills are easy.
- Analyze this position →
If you lean bearish: $148/$140 put debit spread
- Trade: Buy the September 18 $148 put, sell the September 18 $140 put.
- Debit: $2.395 ($239.50) · Max profit: $560.50 · Max loss: $239.50 · Break-even: $145.61
- Why it fits: This is the structure that aligns with both technical models — the 4-day target of $146.75 sits just below the break-even, and full value is reached at $140, the put wall where the market has parked the most downside open interest. Buying rather than selling premium respects the IV rank of 20/100.
- Makes sense only if: you think the put-side open-interest build and the distribution signature on the chart matter more than the call-tilted skew and bullish short-dated sentiment.
- Invalidated if: ORCL closes above $152.24 — the level the 2-day model names as its own kill switch.
- Earnings exposure: spans the September 14 report; a positive reaction can erase most of the debit in a single print.
- Managing it: with the medium- and long-term trend reads flat rather than confirming a downtrend, this is a short-fuse trade — take profit into any test of $140 rather than waiting for expiration.
- Liquidity note: the $148 puts traded 20¢ wide (about 6% of the $3.25 mid) on 1,896 contracts; the $140 puts are 5¢ wide on 8,388. Use limits on the long leg.
- Analyze this position →
If none of these: no trade
Standing aside is a legitimate answer this week, and arguably the strongest one. Every tradeable expiration in this window sits on the far side of a scheduled earnings report, so there is no way to express a four-day view in ORCL without owning overnight gap risk. Meanwhile IV rank at 20/100 and a premium over delivered movement in the 28th percentile mean sellers are not being paid much for taking that risk — the thin credit on the condor is a direct expression of it. Our positioning read is balanced, the technical models lean the other way, and the honest summary is that the options chain is pricing an event, not a direction. If you have no view on the report, waiting for the September 25 or October 16 expirations — where the event is behind you and the implied ranges widen to ±9.91% and ±15.29% — costs you nothing but patience.
6 · Quick FAQ
What is ORCL's expected move into September 18? About ±$11.15, or ±7.42%, from Friday's $150.28 close — a $139.13 to $161.43 range, per the options market's straddle pricing as of 2026-09-11.
Is ORCL expected to go up or down over the next four days? Options positioning as of September 11 reads neutral — heavy one-day put building on one side, call-tilted skew and bullish short-dated sentiment on the other — but that is a read of what traders have done, not a forecast. The actionable map is the $139.13–$161.43 range and the $140 / $165 levels, with max pain at $150.
Are ORCL options expensive right now? IV rank of 20/100 says option prices are lower than 80% of the past year's readings; on top of that, they are running only about 0.7 vol points above the movement ORCL has actually delivered — richer than roughly 28% of this stock's own recent readings. Cheap by both lenses, with the caveat that the September 14 report is distorting both sides of that comparison, so "cheap" is not an edge.
When is ORCL's next earnings report? September 14, after the close — before the September 18 expiration, which is why that expiration carries the highest at-the-money implied volatility (53.6%) of any rung out to December.
Where is ORCL's biggest options support and resistance? For September 18: put wall $140.00 (18,982 contracts), call wall $165.00 (22,210 contracts). Across the whole chain, the heaviest call strike is $160 instead.
What invalidates this read? A close below $140.
Methodology & disclosures. Data: end-of-day options-chain snapshot for ORCL, 2026-09-11, generated 2026-09-14T02:31:39.693Z. Prices shown are midpoints and will differ from live markets. Momentum/positioning scores and volatility-premium comparisons are descriptive measurements of past option flow and past price movement — not investment advice, signals, forecasts, or guarantees. Earnings dates and reported results are from the data provider's earnings feed as of 2026-09-14T02:31:39.693Z; report dates can change. All trade structures are hypothetical. Every structure shown has a defined maximum loss; you can lose the entire max-loss amount. Options involve substantial risk and are not suitable for all investors.