ORCL Options Are Pricing a ±$9.23 Move Into September 25 — Our Positioning Read and the Chart Model Disagree
Oracle's options market implies a $138.38–$156.84 range through the September 25 expiration, but the flow read leans slightly bearish while both technical models point higher. Here's the level map, the premium verdict, and three defined-risk ways to trade the gap.
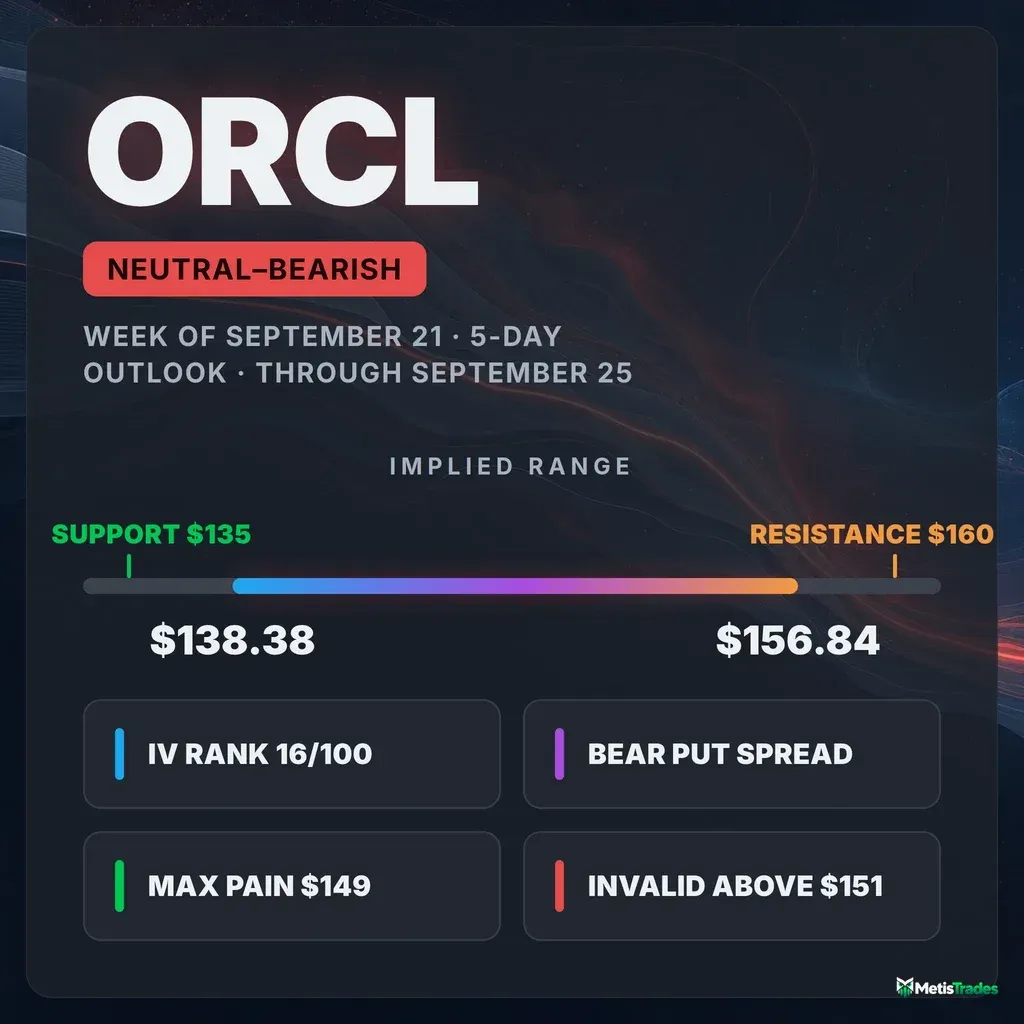
The options market implies a $138.38–$156.84 range into the September 25 expiration; here's what's driving it, where the levels sit, and three defined-risk ways to trade it.
Published Sunday, September 20, 2026 · Data as of Friday, September 18, 2026 close
Explore the live ORCL options data in the Detailed Options Analyzer →
Quick answer
| Item | Answer |
|---|---|
| Market bias | Slightly bearish |
| Options-implied range (into September 25) | $138.38 – $156.84 (±6.25%, or ±$9.23) |
| Major support | $135.00 (put wall, September 25 expiration) |
| Major resistance | $160.00 (call wall, September 25 expiration) |
| Max pain (September 25) | $149.00 |
| Dealer gamma regime (estimate) | Positive for the September 25 expiration — hedging tends to dampen moves; the whole-chain estimate is negative with a flip level ≈ $85 |
| Volatility condition | Falling — IV rank 16/100 · premium thin: options priced about 5 vol points below delivered movement |
| Technical check | Diverges (bullish, 3-day and 5-day models) |
| Best-fitting strategy | Bear put debit spread (September 25 $147/$143) |
| Analysis invalidated if | ORCL closes above $151.00 |
1 · What matters today
Oracle closed Friday, September 18 at $147.61, and the options market is pricing a move of about $9.23 in either direction — roughly 6.25% — through the September 25 expiration. That works out to a $138.38–$156.84 band. Our read of the options flow leans slightly bearish: puts have been building faster than calls, put-side sweeps dominated Friday's unusual activity, and the skew between puts and calls has steepened versus its own recent norm. The counterweight is that this expiration's max pain — the price where the most option value would expire worthless — sits at $149.00, just above spot, and both chart models we ran point modestly higher. That disagreement is the story. A close above $151.00 kills the bearish tilt outright.
2 · What the options market is pricing
What changed this week
The last five sessions took ORCL down 1.78%, which undersells how violent the path was: the daily feed shows gaps of +7.51%, −5.90% and +2.51% inside the past seven sessions, on the back of a spike to the mid-$160s and an equally fast round trip. Implied volatility — the market's estimate of how much ORCL will move, baked into option prices — has been bleeding out of the chain ever since: ATM IV fell 3.23% on the day, 3.98% over five sessions, and 26.09% over thirty, landing at 47.6% against a 30-day average of 65.5%.
New money moved to the put side. The ratio of put to call open interest — contracts currently held open — went from 1.14 to 1.21 over five sessions, against a 7-day average of 1.16 and a 14-day average of 1.10; for every call contract held open there are now roughly 1.21 puts. Friday's option volume ran 1.51× its 20-day average, and put/call volume was 0.53 (7-day average 0.57), so the day's trading was still call-tilted even as the standing inventory tilted the other way. The single biggest open-interest build in the chain was the October 16 $90 puts, up 6,386 contracts to 13,816 — deep, far-out-of-the-money crash insurance, not a directional bet on next week.
Into Friday's expiration, the settled $160 calls shed 2,486 contracts of open interest while the $152.5 calls added 1,659 on 13,990 contracts of volume — history now, but it tells you where the week's lottery tickets were.
One more piece of context on the trend reads: the near-term momentum turn is only about a week old (a downward crossover dated September 14), while the 20-day and 50-day price changes are still positive at +3.90% and +2.35%. Short-term flow and the bigger picture are not pointing the same way, which is an argument for keeping directional structures short-dated and taking profits early rather than pressing.
Expected move
The expected move is the move the options market is pricing in — derived from what straddles cost. Into September 25 it is ±$9.23, or ±6.25% of the $147.61 chain-snapshot price, giving a $138.38–$156.84 band.
| Expiration | Implied move | Range around $147.61 |
|---|---|---|
| September 25 (7 days) | ±6.25% | $138.38 – $156.84 |
| October 2 (14 days) | ±9.33% | $133.84 – $161.38 |
| October 9 (21 days) | ±11.63% | $130.44 – $164.78 |
| October 16 (28 days) | ±13.23% | $128.08 – $167.14 |
The ladder scales almost exactly the way calendar time alone would predict — the per-expiration ATM IV runs 45.2% at the September 25 rung and 47.8% at the October 16 rung, so there is no event bump anywhere in the next month. Nothing in the chain is bracing for a scheduled catalyst inside this window.
Volatility
ATM IV is 47.6% with an IV rank of 16/100 — today's IV sits cheaper than about 84% of the past year's readings — and an IV percentile of 13.5, meaning it has been below this level on only about one day in seven over the last twelve months. Both the 30-day (65.5%) and 90-day (65.2%) averages sit far above spot IV, so the direction of travel is clearly down. The front-month read is unavailable today: Friday was a weekly expiry, so the term-structure comparison across expiration dates can't be interpolated from a same-day-expiring contract.
Against ORCL's own recent history, the pace of that IV collapse is genuinely unusual — the compression reading is running well above this stock's norm. At the same time, actual delivered movement is accelerating: the 5-day realized volatility is running about 1.14× the 20-day figure, above this name's own typical ratio. Options are getting cheaper while the stock moves more.
Premium rich or cheap. The volatility risk premium is the gap between how much movement options are priced for and how much ORCL has actually delivered — when it is positive, option sellers have been collecting more than realized movement cost them. Right now it is negative: ATM IV sits about 5 vol points below the stock's 20-day realized volatility of 52.4%. The percentile reading is 19/100, meaning today's premium is thinner than roughly four-fifths of this stock's own recent readings. Combine that with an IV rank of 16 and the verdict is unambiguous: this is a week to own premium, not to sell it. The path there was abrupt — the gap was worth about +27 vol points at the end of August and about +18 on September 10 before collapsing through zero on September 17. That flip is mechanical, not a signal: the early-September gap moves rolled into the 20-day realized window at the same time implied volatility deflated off its spike.
Skew and sentiment
Skew measures whether puts and calls the same distance from the stock price cost the same; when puts are pricier, traders are paying up for crash protection. ORCL's 25-delta skew is +0.1 vol points (puts a hair over calls) against a 60-day median of −1.3 vol points — for this name the normal state is calls being slightly richer, so the current reading is about 1.4 points steeper than its own baseline, and it has steepened by roughly 2.6 points over the past five sessions. That is a real, if modest, bid for downside protection rather than a panic.
The peer-relative flow tells the same story more loudly: 5 call contracts versus 9 put contracts cleared the unusual-volume bar on Friday, a put-side tilt that is well outside this stock's own recent norm. Sentiment in short-dated options is genuinely split — the 0–7 day bucket scores −6 while the 8–30 day bucket scores +13 and the 60–120 day bucket +22, which the model summarizes as a Mixed regime. Translation: the nearest expirations carry mild hedging pressure, while positioning further out the curve still leans constructive.
The key levels map
Prices are ordered high to low. The walls and max pain below are computed for the September 25 expiration specifically; where the whole-chain aggregate disagrees, it is flagged.
| Level | Price | Why it matters |
|---|---|---|
| 200-day moving average | $166.25 | Price sits 11.2% below it — the long-term structure is still corrective |
| 100-day moving average | $162.29 | 9.0% overhead; no realistic touch inside this window |
| Call wall (September 25) | $160.00 | Heaviest call open interest for this expiration (6,594 contracts) and 10,413 traded Friday — the ceiling that matters |
| Swing resistance | $159.26 | Heuristic pivot cluster from recent price action |
| Upper rail of implied range | $156.84 | 1σ ceiling the options are pricing for September 25 |
| Swing resistance | $153.99 | The level a real trend change would have to clear |
| Chart-model resistance / invalidation | $151.00 | Both technical reports name it; a close above kills the bearish tilt |
| Largest gamma strike (whole chain) | $150.00 | By far the biggest gamma·OI concentration in the book — a magnet strike |
| 20-day moving average | $149.41 | Price is 1.21% below it |
| Max pain (September 25) | $149.00 | Where the most option value would expire worthless — expirations sometimes gravitate toward it |
| Spot | $147.61 | Friday's close |
| Chart-model support | $145.00 | Named by both technical reports as the shelf that has been holding |
| 50-day moving average | $141.00 | Price is 4.69% above it — the last line of the medium-term uptrend |
| Heaviest downside OI cluster (all expirations) | $140.00 | 68,668 puts open across the chain; a gravity strike on any flush |
| Swing support | $139.72 | Recent pivot low cluster |
| Lower rail of implied range | $138.38 | 1σ floor the options are pricing for September 25 |
| Put wall (September 25) | $135.00 | Heaviest put open interest for this expiration (2,637, up 1,249 Friday) — the downside shelf |
| Gamma flip estimate (rough) | ≈$85.00 | One rough estimate of where hedging would start amplifying selling — nowhere near spot |
Note the disagreement worth knowing: across all expirations combined, the heaviest call strike is $200 (87,091 contracts) and the heaviest put strike is $120 (72,315). Those are long-dated positions and are not this week's rails — for the September 25 window, use $160 and $135.
Positioning and unusual flow
Market makers hedge the options they've sold, and the direction of that hedging depends on their net gamma. For the September 25 expiration the estimate is positive — in that regime hedging tends to dampen moves and pull price toward the heavy strikes. The whole-chain estimate is negative, driven by long-dated inventory, so the two disagree; for a one-week thesis the per-expiration read is the relevant one. Both are labelled estimates built on an assumed dealer sign convention, not observed inventory.
Three non-expired flow items stood out:
- October 30 $115 puts: 11,366 contracts traded against just 501 held open — nearly 23× turnover, about $995,000 of premium. That is someone buying far-out-of-the-money insurance six weeks out, not trading next week's direction.
- October 16 $90 puts: open interest jumped 6,386 contracts to 13,816, the largest single OI build anywhere in the chain. Same theme, deeper tail.
- September 25 $160 calls: 10,413 traded, open interest up 1,214 to 6,594, with another 7,866 contracts through the $155 strike. The upside buying in the target week is concentrated 5–8% above spot — cheap lottery tickets that also reinforce the call wall.
The shape of that flow is the tell: the size money is buying October downside, while next week's call activity sits at strikes the implied move barely reaches.
3 · Technical check
Both chart models run against Friday's close come back bullish, and both classify as a divergence from the options read: they contradict the slightly bearish positioning tilt, even though their targets land comfortably inside the options-implied range. The 3-day model (checkpoint September 23) projects $149.60 with a predicted range of $144.60–$150.90. The 5-day model (target September 25, the same date this article's thesis is scored against) projects $149.80 with a predicted range of $144.00–$152.50.
The case is built on a fresh MACD crossover from below, the 13-period EMA reclaiming the 34-period EMA, and a Chaikin Money Flow reading of +0.145 that has been rising since the September 16 low — accumulation persisting through a sideways week. The honest caveat inside the reports themselves is ADX at 15.6, below the 20 threshold that marks a real trend, which is why the targets are modest rather than aggressive. Both reports name $145.00 support and $151.00 resistance, and the 5-day report's dominant bullish scenario invalidates on a close back below $146.00.
Model vs. Market: The options market implies $138.38–$156.84 into September 25; the 5-day technical model targets $149.80. The two aren't arithmetically incompatible — $149.80 sits near the middle of the implied band — but they lean opposite ways around spot, and the resolution is the $151.00 shelf: a close above it means the chart is right and the positioning tilt is noise.
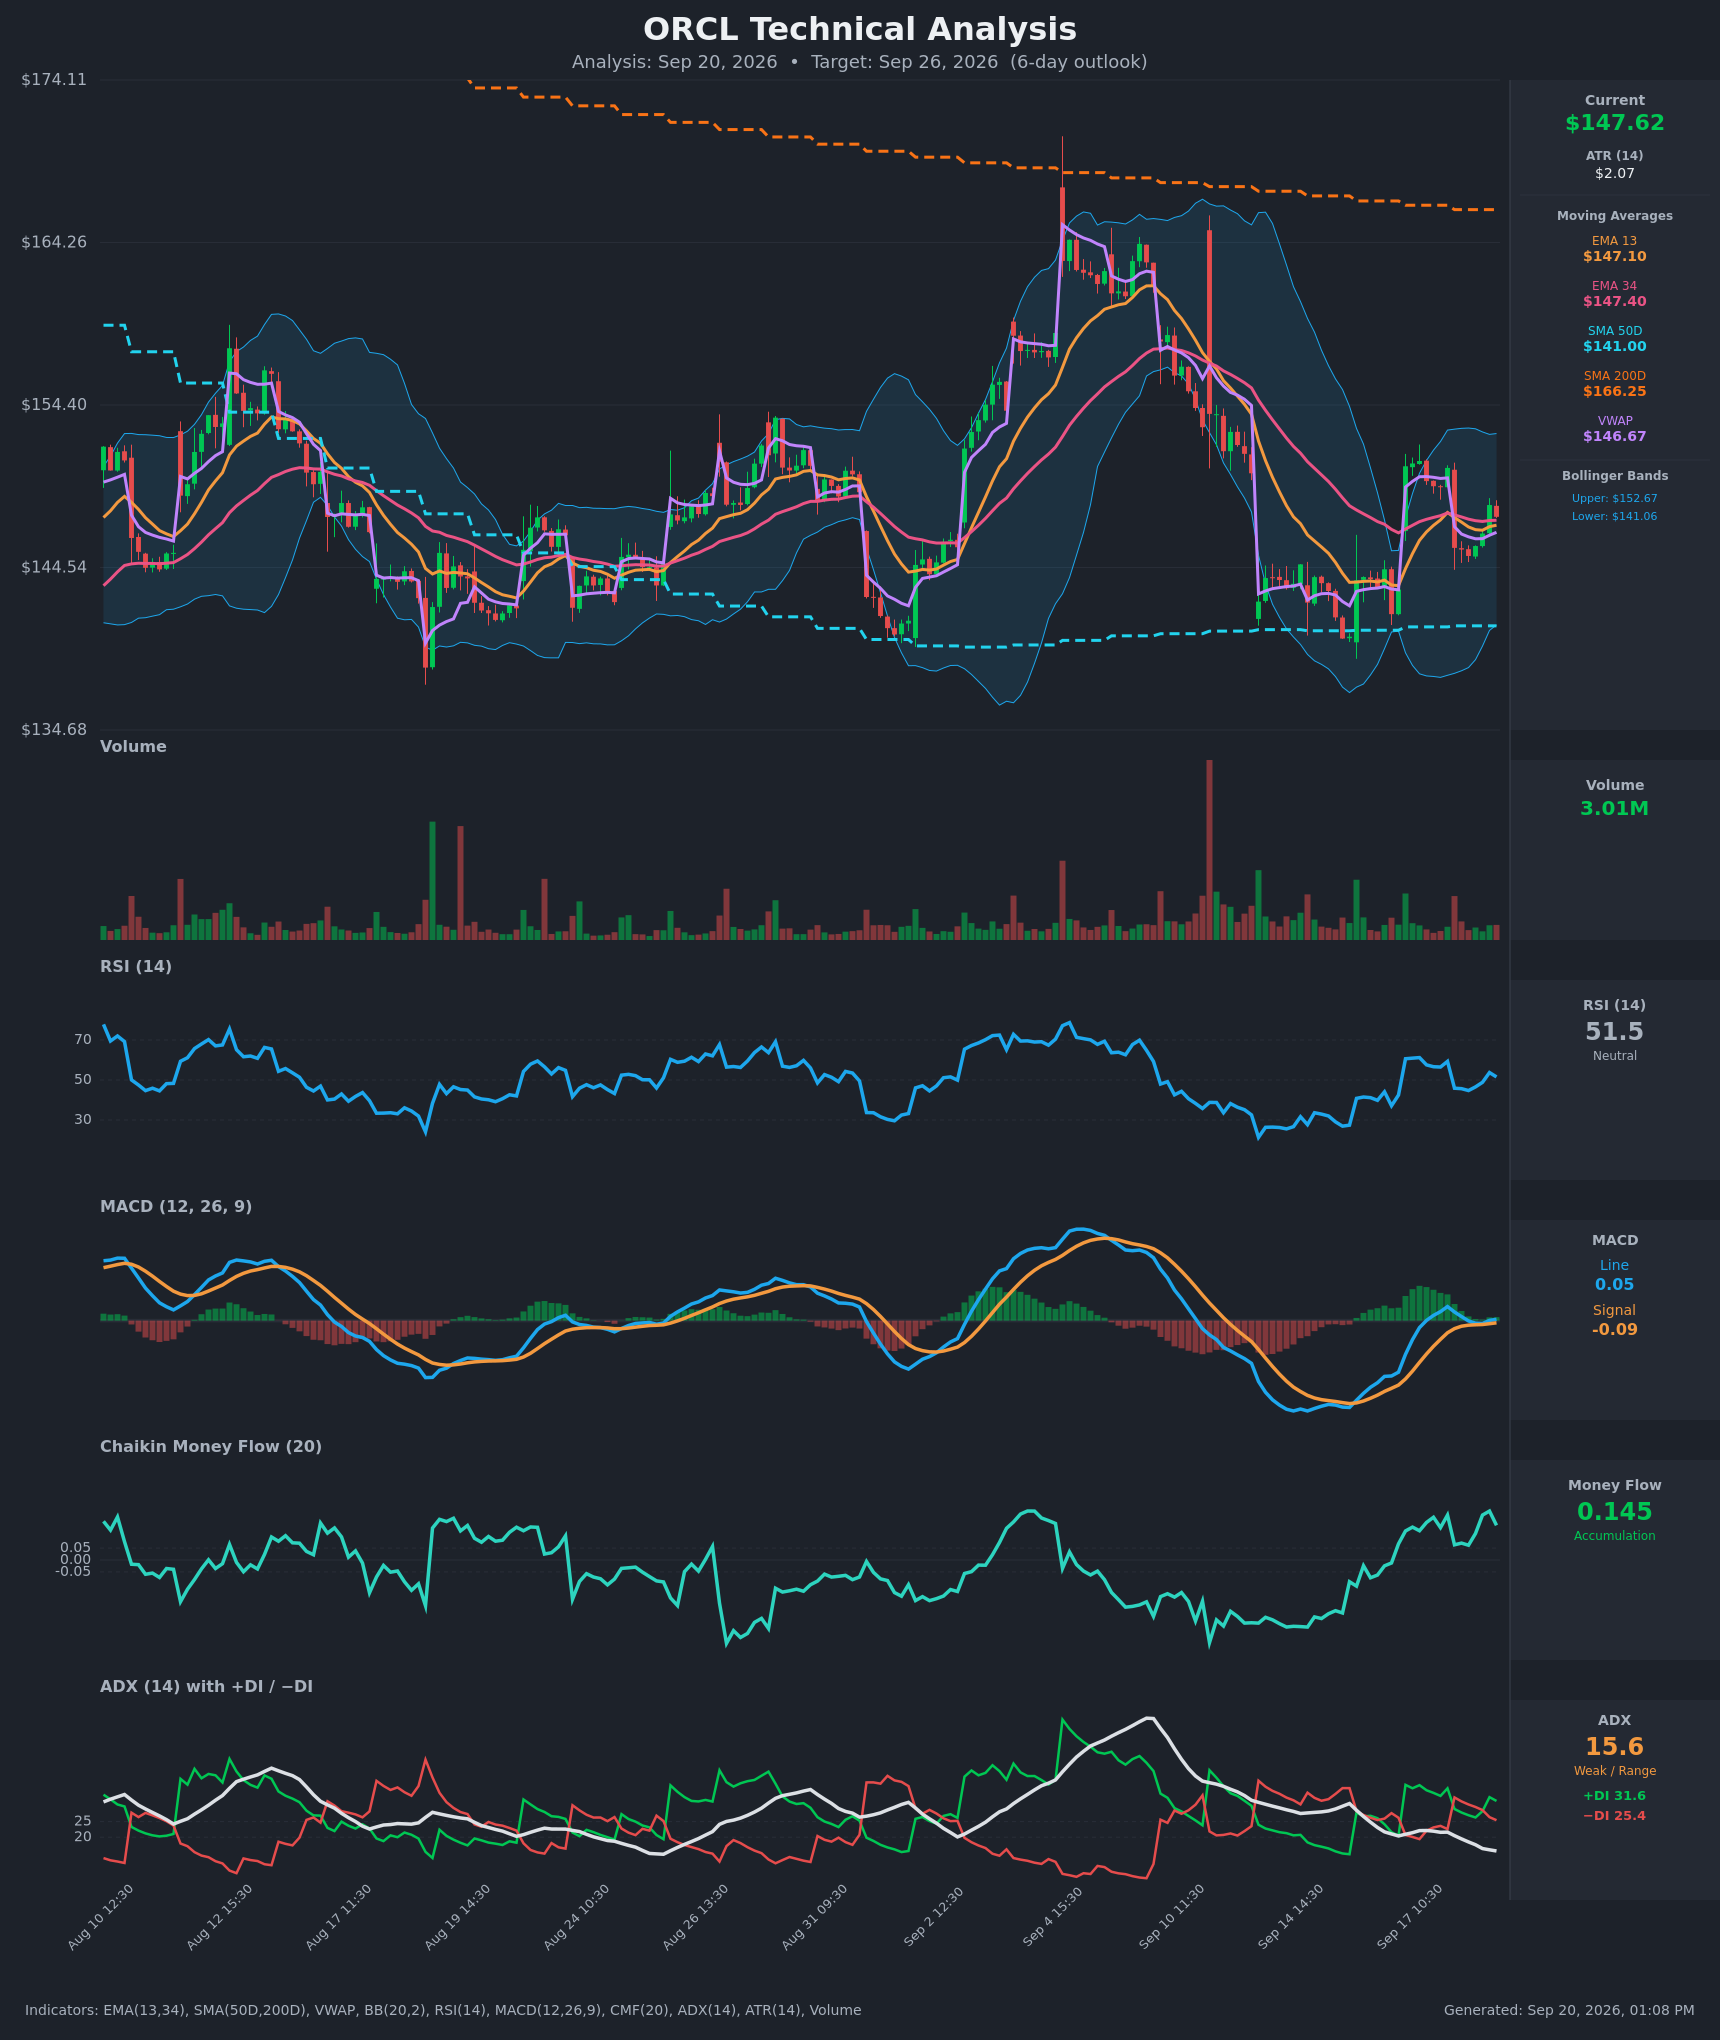
How the technicals shaped the strikes below: because the chart read is constructive and the bearish edge is a lean rather than a conviction call, the bearish structure is built with a short strike at $143 — under both the chart's $145 shelf and the 50-day average — rather than reaching for the put wall.
Full technical write-ups: 3-day report → · 5-day report →
4 · Three ways the next five days can go
If ORCL pushes above the call wall ($160.00): this sits outside the implied range, so it would take a 8.4% move in five sessions. The heaviest call open interest for the expiration is parked there, and strikes with that much overhead inventory tend to slow rallies as dealers hedge into them. Above it, positioning thins quickly until the 100-day average at $162.29.
If ORCL drifts between the walls: this is the base case the data supports. Max pain sits at $149.00 and the biggest gamma concentration in the entire book sits at $150.00, with the expiration's own dealer-gamma estimate in the positive regime where hedging tends to cushion rather than amplify. That combination argues for chop in the $145–$151 pocket the chart models also describe, with time decay doing most of the work.
If ORCL breaks below the put wall ($135.00): also outside the implied range, and by the rough gamma-flip estimate the fragile regime is nowhere near — spot sits far above the ~$85 flip level, an unusually wide cushion by this stock's own history. The real acceleration risk isn't dealer mechanics, it's the gap behavior already on the tape: three gaps of 2.5% or more in the past seven sessions and 5-day realized volatility running above its own monthly pace. A move through $140 would put the heaviest downside OI cluster in play fast.
5 · Three defined-risk structures
Prices are end-of-day midpoints as of 2026-09-18. All structures are hypothetical. Verify live prices before trading — these will be stale by the open.
Because premium is thin rather than rich this week, the debit structures lead and the credit structure comes last with a warning attached.
If you lean bearish: September 25 $147/$143 put debit spread
- Trade: Buy the September 25 $147 put, sell the September 25 $143 put. A debit spread means you pay up front and you're betting the stock moves your way; your loss is capped at what you paid.
- Debit: $1.61 ($161 per spread) · Max profit: $239 · Max loss: $161 · Break-even: $145.39
- Why it fits: It's the directional expression of the slightly bearish positioning read, and it's a long-premium structure at a moment when options are priced about 5 vol points below what ORCL has actually delivered — with IV rank at 16/100, you're paying near the bottom of the year's range for optionality in a name that just gapped 5–7% three times in a week.
- Makes sense only if: you think the put-side building and steepening skew lead price rather than just hedge it.
- Invalidated if: ORCL closes above $151.00.
- Managing it: take profits at roughly 60–70% of max value rather than holding for the full $239 — with the 20-day and 50-day trend still pointing up against a one-week-old momentum turn, this is a short-leash trade. Exit by September 24 regardless; the last day of a 4-point spread is mostly gamma coin-flip.
- Liquidity note: the $147 puts quote 15¢ wide (about 4.5% of mid) and the $143 puts 6¢ wide (about 3.5%); both traded over a thousand contracts Friday. Fills should be straightforward on a limit at the package mid.
- Analyze this position →
If you lean bullish: September 25 $146/$152.50 call debit spread
- Trade: Buy the September 25 $146 call, sell the September 25 $152.50 call.
- Debit: $2.70 ($270 per spread) · Max profit: $380 · Max loss: $270 · Break-even: $148.70
- Why it fits: This is the trade that sides with the chart instead of the flow. Both technical models target just under $150 with resistance at $151, so the short strike at $152.50 sits above their projected path while the break-even sits below it. Like the bearish spread, it's long premium into a 19th-percentile volatility premium.
- Makes sense only if: you read the put building as hedging inside an intact bounce rather than conviction — and you want the structure that pays if the $151 shelf breaks.
- Invalidated if: ORCL closes below $145.00.
- Managing it: close at roughly 60% of max value or on any tag of $152; the short-term flow is fighting you, so don't let a winner round-trip.
- Liquidity note: the $146 calls quote 15¢ wide (about 3.3% of mid) on 2,953 contracts; the $152.50 calls 7¢ wide (about 3.7%) on 3,601 contracts. Both are among the busiest strikes in the expiration.
- Analyze this position →
If you expect the range to hold: September 25 $133/$138/$155/$160 iron condor
- Trade: Sell the $138 put, buy the $133 put, sell the $155 call, buy the $160 call — all September 25. A credit structure pays you up front and wins if price stays between the short strikes.
- Credit: $1.12 ($112 per condor) · Max profit: $112 · Max loss: $388 · Break-evens: $136.88 and $156.12
- Why it fits: The short strikes bracket the implied range with a downward shade — $155 sits below the $156.84 upper rail while $138 sits just under the $138.38 lower rail — which lines up with the slightly bearish tilt, max pain at $149 and the positive dealer-gamma estimate for this expiration. The long call wing sits exactly at the $160 call wall.
- Health warning: you're selling premium that hasn't been rich lately. With IV rank at 16/100 and the premium over delivered movement in the 19th percentile of this stock's own readings, you're collecting $112 to risk $388 in a name that has produced three multi-percent gaps in seven sessions. That is the worst combination for a short-premium trade.
- Makes sense only if: you specifically believe the post-spike consolidation continues and you size it small.
- Invalidated if: ORCL closes above $151.00 (the upside wing is the one under pressure first).
- Managing it: close at roughly 50% of max credit — which here is $56, so this is a trade you take off quickly. Exit by September 23 if price is pressing either short strike rather than defending into expiration.
- Liquidity note: the $138 puts quote 2¢ wide and the $155 calls 5¢ wide (about 3.9% of mid, on $1.0m of premium traded). The long wings are the problem: the $133 puts quote 5¢ wide on a 21½¢ mid — pennies in dollars, but a quarter of the contract's value, so enter as a package on a limit, never leg in.
- Analyze this position →
If none of these: no trade
There is a clean case for standing aside. The directional edge here is a lean, not a conviction — the composite that drives our bias sits close to the neutral boundary, the term-sentiment buckets openly disagree with each other, and both chart models point the opposite way from the flow. Meanwhile the one thing the volatility data says clearly is don't sell premium, which removes the income trade that would normally pay you for being undecided. If you don't have a view on whether the $151 shelf breaks, the honest answer is that a $138–$157 implied range around a $147.61 stock with near-year-low implied volatility is a setup to watch, not a setup to fund.
6 · Quick FAQ
What is ORCL's expected move this week? ±$9.23, or ±6.25%, into the September 25 expiration — a $138.38–$156.84 range, per the options market's straddle pricing as of the September 18 close.
Is ORCL expected to go up or down over the next five days? Options positioning as of September 18 leans slightly bearish — puts building faster than calls, put-side sweeps dominating unusual flow, and skew steepening versus its own norm — but that's a read of what traders have done, not a forecast. Both chart models disagree and point to roughly $149.60–$149.80. The actionable map is the $138.38–$156.84 range and the $135.00 / $160.00 wall levels.
Are ORCL options expensive right now? No. IV rank of 16/100 says option prices are lower than about 84% of the past year's readings, and on top of that they're running roughly 5 vol points below the movement ORCL has actually delivered over the past 20 sessions — thinner than about four-fifths of this stock's own recent readings. That combination favors owning premium rather than collecting it.
Where is ORCL's biggest options support and resistance? For the September 25 expiration, the put wall is $135.00 and the call wall is $160.00. Across the whole chain those aggregate to $120 and $200, but those are long-dated positions, not this week's rails.
What invalidates this week's read? A close above $151.00.
Methodology & disclosures. Data: end-of-day options-chain snapshot for ORCL, 2026-09-18, generated 2026-09-20T13:08:48.913Z. Prices shown are midpoints and will differ from live markets. Momentum/positioning scores and volatility-premium comparisons are descriptive measurements of past option flow and past price movement — not investment advice, signals, forecasts, or guarantees. All trade structures are hypothetical. Every structure shown has a defined maximum loss; you can lose the entire max-loss amount. Options involve substantial risk and are not suitable for all investors.