PFE Options Cap the Week at $28 — The Chart Model Wants $28.05
Pfizer's options market implies a $26.93–$28.51 range into the September 18 expiration, with the heaviest call open interest sitting right at $28.00 — a dollar above Friday's close. Here's what the positioning shows and three defined-risk ways to trade the next four days.

The options market implies a $26.93–$28.51 range into the September 18 expiration; here's what's driving it and three defined-risk ways to trade the next four days.
Published Monday, September 14, 2026 · Data as of Friday, September 11 close
Explore the live PFE options data in the Detailed Options Analyzer →
Quick answer
| Item | Answer |
|---|---|
| Market bias | Slightly bullish |
| Options-implied range (into Sep 18) | $26.93 – $28.51 (±2.86%, or about ±$0.79) |
| Major support | $27.00 (put wall, Sep 18 expiration) |
| Major resistance | $28.00 (call wall, Sep 18 expiration) |
| Max pain (Sep 18) | $27.00 |
| Dealer gamma regime (estimate) | Positive — hedging tends to dampen moves; flip level ≈ $28.00 |
| Volatility condition | Falling — IV rank 23/100 · premium thin: options are priced about 1.1 vol points below the movement PFE has actually delivered |
| Technical check | Confirms (bullish, 2-day and 4-day horizons) |
| Best-fitting strategy | Long call debit spread into the $28 wall |
| Analysis invalidated if | PFE closes below $27.00 |
1 · What matters today
Pfizer closed Friday at $27.72 after a rough five sessions — down 3.8% over that stretch — but the options chain tells a different story than the tape. Call-side flow dominated Friday, and the strikes above the money are the expensive ones: 25-delta calls cost about 10.1 volatility points more than 25-delta puts, when the normal gap for this name is closer to 2.6. That is traders paying up for upside, not for crash protection.
The map for the next four days is narrow. The options market is pricing roughly $0.79 of movement in either direction into the September 18 expiration — a $26.93 to $28.51 range. The single strike that matters is $28.00: it holds the heaviest call open interest of that expiration and sits just 1% overhead. Below, $27.00 is where both the put wall and max pain sit. Two short-horizon chart models also lean bullish, targeting $28.05. A close below $27.00 kills the read.
2 · What the options market is pricing
What changed this week
The past week was a pullback in price and a rotation in positioning. PFE fell 3.8% over five sessions while still holding a 3.5% gain over twenty and a 16.0% gain over fifty — and that split matters. Our short-term and long-term trend reads are openly divergent right now: the last week's slide runs against a stock that is still comfortably above its 50-day ($26.27) and 200-day ($26.22) moving averages. Near-term flow and the bigger trend are pointing in different directions, which argues for short-dated structures and quick profit-taking rather than anything that needs weeks to work.
Underneath, option buyers turned decisively call-side on Friday. Put volume ran at just 0.26 contracts for every call — against a 7-day average of 0.63 and a 14-day average of 0.90. In plain terms: a week ago there were nine puts trading for every ten calls; Friday there were barely three. Open interest is drifting the same way, with the put/call open-interest ratio at 0.68 versus a 14-day average of 0.72. The biggest genuine build among still-live contracts was the September 18 $28 calls, which added 1,263 contracts of open interest to reach 66,982 — traders adding to the exact strike that caps the week. Implied volatility — the market's estimate of how much PFE will move, baked into option prices — slipped 5.6% on the day to 21.4%, sitting dead on its 30-day average and below its 90-day average of 22.5%.
Expected move
Into September 18, the options market is pricing a move of about ±2.86%, or ±$0.79 around the $27.72 close — a range of $26.93 to $28.51. That number is derived from what at-the-money straddles cost: it's the market's own one-standard-deviation guess at the size of the move, not its direction.
| Expiration | Implied move | Range around $27.72 |
|---|---|---|
| Sep 18 (7 days) | ±2.86% | $26.93 – $28.51 |
| Sep 25 (14 days) | ±4.16% | $26.57 – $28.87 |
| Oct 9 (28 days) | ±5.76% | $26.12 – $29.32 |
The ladder scales smoothly — roughly with the square root of time, which is what a calm chain looks like. There is no step-up, no hump, no single date the chain is bracing for inside the next month.
Volatility
At-the-money implied volatility is 21.4%, with an IV rank of 23/100 — meaning today's reading is cheaper than about 77% of the past year's. Direction is soft: down 5.6% on the day, up 4.7% over five sessions, and down 11.2% over thirty. The front-month read is unavailable today because Friday was an expiration day and the nearest contract had zero days left, so the short-versus-long comparison across expiration dates can't be computed — that returns on the next session and isn't a data gap.
One "vs its own norm" observation: the stock's actual delivered movement has been decelerating. Its five-day realized volatility is running at just 0.74 times its twenty-day rate, an unusually quiet reading for this name. Twenty-day realized volatility itself, at 22.5%, is about typical.
Premium rich or cheap. The volatility risk premium — the gap between how much movement options are priced for and how much PFE has actually delivered — is currently negative by about 1.1 vol points. Option sellers have been collecting less than realized movement cost them. And that gap sits in the 14th percentile of this stock's own recent readings: cheaper than roughly 86% of them. The path over the past two weeks has been consistently negative, drifting between about −2.5 and +0.3 vol points with no sign flip worth narrating. Combined with an IV rank of 23, the verdict is unambiguous: this is a week that favors owning premium, not selling it. Any credit structure here is being paid below the going rate for the risk it takes.
Skew and sentiment
Skew measures the fact that puts and calls the same distance from the stock price don't cost the same. Normally, for a name like this, puts are the pricier side — traders paying up for downside protection. Right now the opposite is true, and dramatically so: 25-delta calls are priced at 30.1% implied volatility against 20.0% for 25-delta puts, a 10.1-point gap in favor of calls, against a 60-day median gap of 2.6 points. Traders are paying a premium for upside. That reading is well above this stock's own recent norm, and the skew has flattened by roughly 8 vol points in just five sessions — put demand bleeding off fast.
Short-dated sentiment agrees. Our read of the chain by expiration bucket scores the 0–7 day bucket at +33 and the 7–30 day bucket at +16, with the 30–60 day bucket at +29 — every bucket leaning the same way, a regime our model labels broadly bullish, and stronger than the 14-day baseline where the front bucket averaged roughly flat. The put/call volume ratio at 0.26 is itself an unusually call-tilted reading versus this symbol's own history. The one dissenting input is price itself: the underlying's five-day momentum is an unusually weak reading for PFE, which is exactly the tension this article is built around.
The key levels map
| Level | Price | Why it matters |
|---|---|---|
| 52-week high | $29.21 | 5.1% above Friday's close; the ceiling of the past year |
| Next call shelf (Sep 18) | $29.00 | 36,064 calls open — thinner than $28 but the next overhead pile |
| Top of implied range | $28.51 | One-sigma ceiling for Sep 18; also the nearest swing resistance in the price data |
| Call wall (Sep 18) | $28.00 | 66,982 calls open — the heaviest strike of this expiration and the cap on the week |
| Gamma flip estimate | ≈$28.00 | One rough estimate puts the hedging pivot here — the same strike as the wall |
| 20-day moving average | $28.00 | Friday's close sits 1.0% below it |
| Spot | $27.72 | Friday's close |
| Nearest swing support | $27.64 | Most recent pivot-low cluster in the daily data |
| Put wall & max pain (Sep 18) | $27.00 | 51,090 puts open; also the strike where the most option value expires worthless |
| Bottom of implied range | $26.93 | One-sigma floor for Sep 18 |
| Swing support | $26.52 | Next pivot cluster below |
| 50-day moving average | $26.27 | Close sits 5.5% above — the intermediate uptrend is intact |
| Whole-chain put wall | $25.00 | 98,003 puts across all expirations — a long-dated floor, not this week's |
Worth flagging the disagreement: the whole chain's heaviest call strike and the September 18 expiration's own call wall agree at $28.00, but their put walls do not. Across all expirations combined, the biggest put pile is at $25.00; for the four-day expiration that actually matters here, it's $27.00. Use $27.00 for this week.
Positioning and unusual flow
Market makers hedge the options they've sold, and the direction of that hedging changes with price. One rough estimate of the current setup labels the regime positive — meaning dealer hedging tends to dampen moves rather than amplify them — with the pivot around $28.00. That is an estimate built on an assumed dealer sign convention, not observed inventory, and it's worth noting that spot sits about 1% below that pivot. The September 18 expiration's own gamma read is positive as well, consistent with the aggregate.
Three live items stood out in Friday's flow. The September 18 $28 calls traded 3,443 contracts against 66,982 open — about $62,000 of premium, and open interest grew, so this was new positioning stacked onto the wall. The September 18 $27.50 calls traded 1,648 contracts against just 840 open, with open interest nearly doubling on the day: about $69,000 of fresh premium bought a half-dollar out of the money. On the other side, the September 18 $26.50 puts traded 1,582 contracts against only 388 open — a 4.1x turnover — the clearest downside hedge of the day, and priced well below the put wall.
Overall option volume ran at just 0.74 times its 20-day average, so this was not a frantic session. It was a quiet one that leaned decisively one way.
3 · Technical check
Both chart models lean bullish, and both target the same price. The 2-day report (through September 16) sees a completed breakout: price above its short-term averages, a fresh MACD crossover, a Chaikin Money Flow reading of 0.217 that it calls the strongest accumulation in its sample, and an ADX of 30.9 with buyers clearly dominant. It targets $28.05 with a projected range of $27.40 to $28.25. The 4-day report (through September 18) reads the same chart more cautiously — RSI recovering from oversold rather than pushing toward overbought — but lands in the same place: a $28.05 target with a projected range of $27.05 to $28.35, and an explicit invalidation on a close back below $27.32.
Both confirm the options read. Direction matches the slightly bullish positioning lean, and the $28.05 target sits comfortably inside the options-implied $26.93–$28.51 corridor. The interesting wrinkle is that $28.05 is just above the call wall — the models want price through the exact strike where the heaviest option open interest sits. That is the most useful sentence in this article: the chart wants $28.05, and the options chain has 66,982 contracts of reason to make $28.00 sticky.
Model vs. Market: The options market implies $26.93–$28.51 into September 18; the 4-day technical model targets $28.05. Those agree on direction and disagree on nothing — but the technical target sits five cents past the call wall, which is precisely where positioning tends to resist.
The practical effect on strike selection below: the bullish structure sells its upper leg at $28.00 rather than reaching past it, because the chain says that's where the payout stops being cheap to buy.
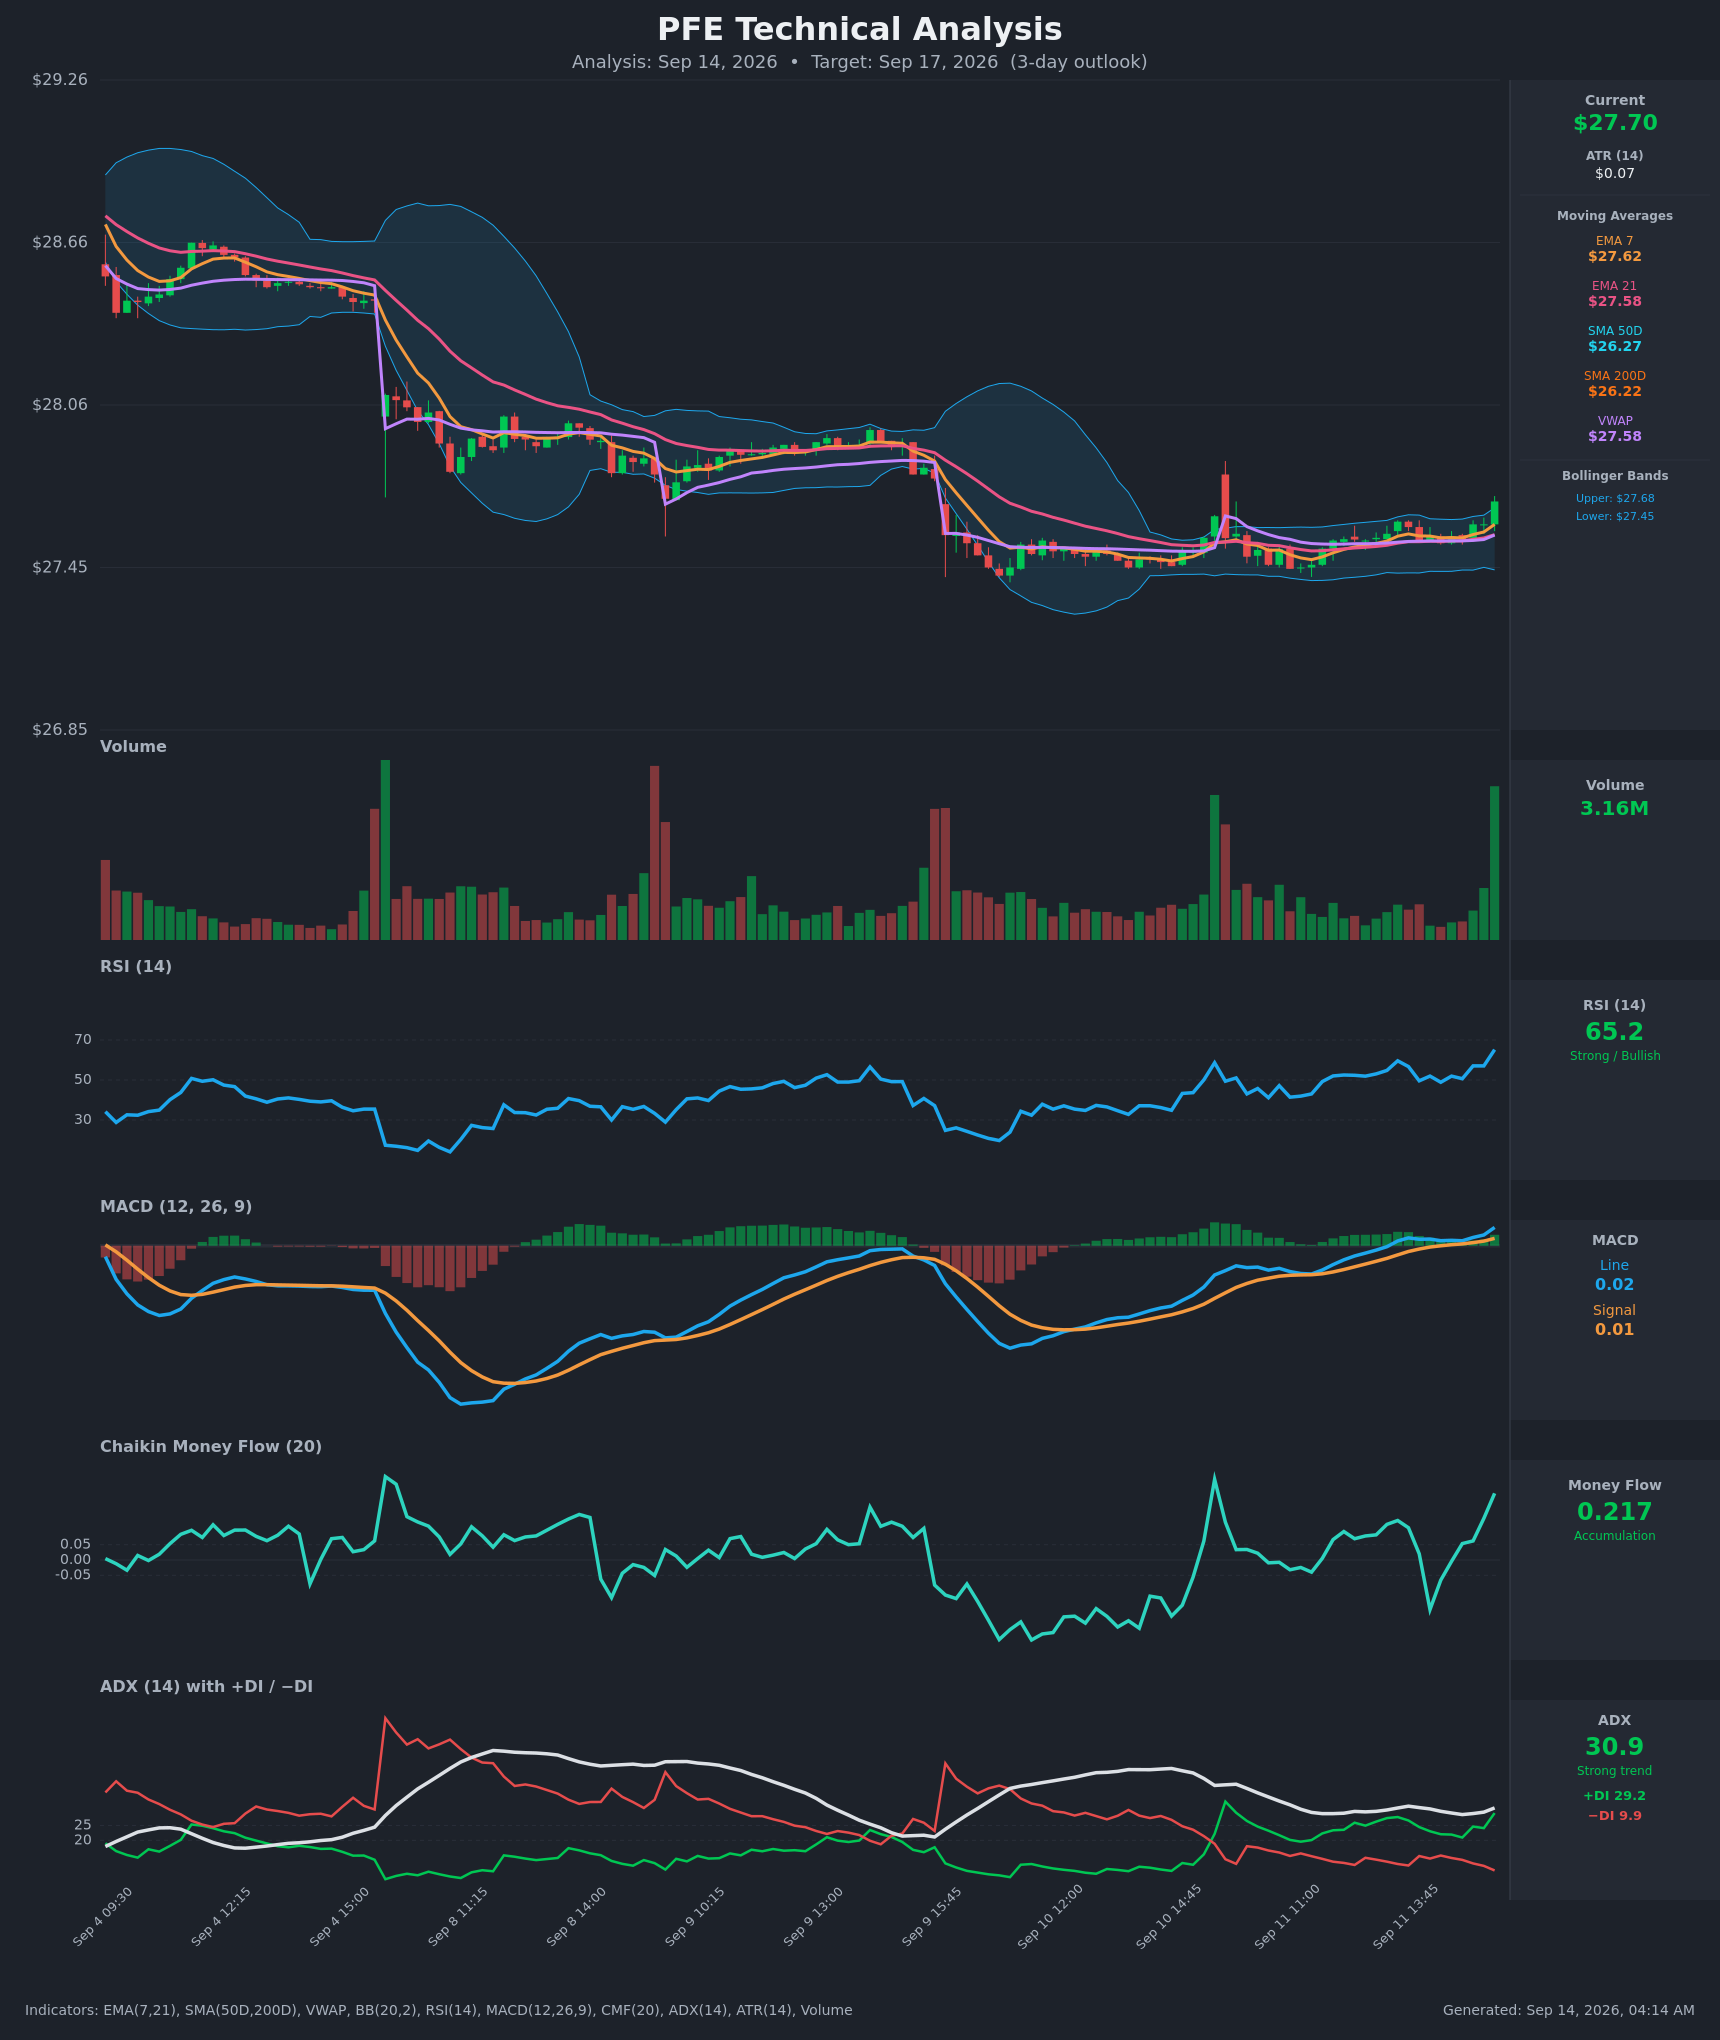
Full technical write-ups: 2-day report → · 4-day report →
4 · Three ways the next four days can go
If PFE pushes above the call wall ($28.00): The heaviest call open interest of the expiration sits right there, and strikes with that much open interest tend to slow rallies as hedging flows lean against the move. A clean close through it leaves noticeably thinner positioning overhead until $29.00, with the top of the implied range at $28.51 and the 52-week high at $29.21 as the next markers. Note that the $28 strike is also the 20-day moving average and the estimated gamma pivot — three different reasons for the same level to matter.
If PFE drifts between the walls: This is the base case the chain is built around. Max pain for September 18 sits at $27.00, meaning that's where the most option value would expire worthless, and expirations sometimes gravitate that way. With the estimated dealer-hedging regime positive — hedging dampening rather than amplifying — a chop between $27.00 and $28.00 into Friday is the outcome positioning is most comfortable with, even though the directional lean points to the upper half of it.
If PFE breaks below the put wall ($27.00): 51,090 puts sit open at that strike, and a close beneath it removes the week's clearest floor. Spot is already sitting about 1% below the estimated gamma flip level of roughly $28.00, which is the fragile side of that rough estimate — below the pivot, market-maker hedging tends to accelerate moves rather than cushion them. The next markers are the bottom of the implied range at $26.93 and swing support at $26.52. This is the branch that invalidates everything above.
5 · Three defined-risk structures
Prices are end-of-day midpoints as of September 11. All structures are hypothetical. Verify live prices before trading — these will be stale by the open.
If you lean bullish: September 18 $27.50/$28.00 call debit spread
- Trade: Buy the Sep 18 $27.50 call, sell the Sep 18 $28.00 call
- Debit: $0.24 · Max profit: $26 per spread · Max loss: $24 per spread · Break-even: $27.74
- Why it fits: With the premium gap negative and in the 14th percentile of its own recent history, buying defined premium is the structurally sound side this week. A debit spread pays you for a move to the call wall and stops paying exactly where positioning says the move should stall — you aren't buying the part of the distribution the chain is fighting. It also expires inside the four-day window, which suits a short-term direction that is currently running against the last week of price action.
- Makes sense only if: you expect PFE to reclaim $28.00 by Friday — roughly the level both chart models point at.
- Invalidated if: PFE closes below $27.00.
- Managing it: Take profit at roughly 70% of maximum value rather than waiting for a pin at the wall; close Thursday regardless if the spread hasn't moved, because the last day of a $0.50-wide spread is mostly noise.
- Liquidity note: The $27.50 calls quoted 12¢ wide ($0.36/$0.48) and the $28.00 calls 4¢ wide ($0.16/$0.20). The long leg is the slippage risk here — work the order as a spread and don't pay the offer.
- Analyze this position →
If you expect the range to hold: September 18 iron condor, $26.50/$27.00/$28.50/$29.00
- Trade: Sell the Sep 18 $27.00 put, buy the Sep 18 $26.50 put, sell the Sep 18 $28.50 call, buy the Sep 18 $29.00 call. (A credit structure: you collect premium up front and keep it if price stays between the short strikes.)
- Credit: $0.10 · Max profit: $10 per condor · Max loss: $40 per condor · Break-evens: $26.90 and $28.60
- Why it fits: The short strikes sit at the put wall below and just past the call wall above, with break-evens that essentially trace the edges of the implied range. Positioning, max pain and the estimated dampening hedging regime all favor a contained week.
- Health warning: you're selling premium that hasn't been rich lately. With implied volatility running about 1.1 vol points below delivered movement and an IV rank of 23, $10 of credit against $40 of risk is the market telling you this side is underpaid. If you take it, take it small.
- Makes sense only if: you specifically expect a quiet drift toward $27.00–$28.00 into Friday and are sizing accordingly.
- Invalidated if: PFE closes outside $27.00–$28.50.
- Managing it: Close at roughly 50% of the credit; exit Thursday regardless. If either short strike is breached on a closing basis, close the tested side rather than hoping for a reversion — the reward here is too thin to defend.
- Liquidity note: All four legs are penny-market contracts ($26.50 put $0.03/$0.05; $29.00 call $0.02/$0.03). In absolute terms the spreads are tiny, but as a share of a $0.10 credit they are enormous — a bad fill eliminates the entire edge.
- Analyze this position →
If you lean bearish: September 18 $27.50/$27.00 put debit spread
- Trade: Buy the Sep 18 $27.50 put, sell the Sep 18 $27.00 put
- Debit: $0.12 · Max profit: $38 per spread · Max loss: $12 per spread · Break-even: $27.39
- Why it fits: This is the structure that pays if the past week's price weakness keeps winning over the bullish flow — and the payoff target is the max-pain strike of $27.00, which is also the put wall. Puts are the cheap side of the skew right now (20.0% implied for 25-delta puts versus 30.1% for calls), so downside exposure is being bought at a discount to upside exposure.
- Makes sense only if: you read the call-side flow as chasing and expect the expiration to gravitate to $27.00.
- Invalidated if: PFE closes above $28.00.
- Managing it: Take profit at roughly 70% of maximum value; the $27.00 strike is a magnet, not a floor to lean on, so don't wait for a full pin.
- Liquidity note: The $27.50 puts quoted 4¢ wide ($0.20/$0.24) and the $27.00 puts 3¢ wide ($0.09/$0.12), with 3,986 contracts traded at the $27 strike on Friday — the most liquid put on the board for this expiration.
- Analyze this position →
If none of these: no trade
Standing aside is defensible here, and for a specific reason: everything about this week is small. The implied move is ±$0.79, the two walls are a dollar apart, and every contract in the corridor is quoted in pennies with bid-ask spreads that eat a meaningful fraction of any edge. The premium-selling side is genuinely underpaid — implied volatility is below delivered movement at the 14th percentile of this stock's own readings — so the usual "collect income in a range" answer doesn't apply. And the directional lean, while real, comes from flow that has been fighting the price tape for a week. If the setup you actually want is a move through $28.00 with conviction behind it, waiting for that close and trading the next leg costs you nothing but four days.
6 · Quick FAQ
What is PFE's expected move into September 18? About ±$0.79, or ±2.86% — a $26.93 to $28.51 range around the $27.72 close, per the options market's straddle pricing as of September 11.
Is PFE expected to go up or down over the next four days? Options positioning as of September 11 leans slightly bullish — call-heavy volume, calls priced about 10 vol points above equivalent puts, and a broadly bullish read across expiration buckets — but that's a description of what traders have done, not a forecast. The actionable map is the $26.93–$28.51 range and the $27.00 / $28.00 levels.
Are PFE options expensive right now? No. An IV rank of 23/100 means option prices are lower than about 77% of the past year's readings, and on top of that they're running roughly 1.1 vol points below the movement PFE has actually delivered — thinner than about 86% of this stock's own recent readings. That combination favors buying defined premium over selling it this week.
Where is PFE's biggest options support and resistance? For the September 18 expiration, the put wall is $27.00 (51,090 contracts open) and the call wall is $28.00 (66,982 contracts open).
What invalidates this read? A close below $27.00.
Methodology & disclosures. Data: end-of-day options-chain snapshot for PFE, 2026-09-11, generated 2026-09-14T04:14:28.599Z. Prices shown are midpoints and will differ from live markets. Momentum/positioning scores and volatility-premium comparisons are descriptive measurements of past option flow and past price movement — not investment advice, signals, forecasts, or guarantees. All trade structures are hypothetical. Every structure shown has a defined maximum loss; you can lose the entire max-loss amount. Options involve substantial risk and are not suitable for all investors.