PFE Options Are Pricing a $0.97 Move — Our Chart Model Sees a Drift to $28.60
Options imply a $27.92–$29.86 range for Pfizer into the November 20 expiration, with max pain at $29.00 and heavy open interest at $29 and $30. Here is what is driving that pin-friendly setup, where the chart model disagrees, and three defined-risk ways to trade it.
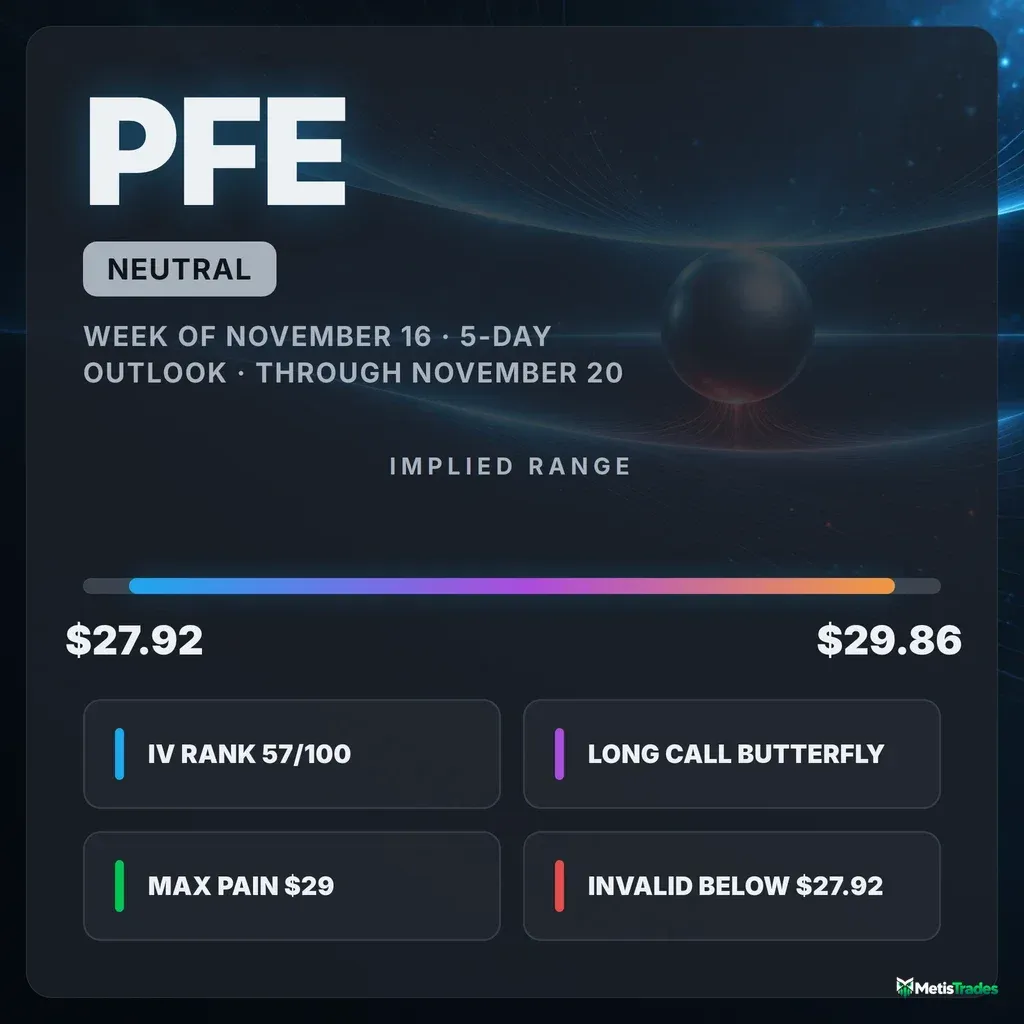
The options market implies a $27.92–$29.86 range into the November 20 expiration. Here's what is driving it and three defined-risk ways to trade it.
Published Sunday, November 15, 2026 · Data as of Friday, November 13, 2026 close
Explore the live PFE options data in the Detailed Options Analyzer →
Quick answer
| Item | Answer |
|---|---|
| Market bias | Neutral |
| Options-implied range (into November 20) | $27.92 – $29.86 (±3.37%, ±$0.97) |
| Major support | $25.00 (November 20 put wall). Nearer swing support sits at $28.44. |
| Major resistance | $30.00 (November 20 call wall) |
| Max pain (November 20) | $29.00 |
| Dealer gamma regime (estimate) | Positive: hedging tends to dampen moves. Flip level ≈ $30, above spot. |
| Volatility condition | Falling. IV rank 56.55/100 · premium thin: options are priced about 0.9 vol points below delivered movement. |
| Technical check | Diverges mildly. The chart model is bearish on both horizons: 3-day target $28.72, 5-day target $28.60. |
| Best-fitting strategy | Long call butterfly centered at $29 (November 20), if you want a pin-around-max-pain trade |
| Analysis invalidated if | PFE closes below $27.92 |
1 · What matters today
Our read of PFE's options market is neutral for the next five days.
The main reason is where open interest (contracts currently held open) sits for the November 20 expiration. It is stacked at the $29 and $30 strikes. Max pain is $29.00, just 11 cents above Friday's $28.89 close. Max pain is the price where the most option value would expire worthless, and expirations sometimes gravitate toward it.
Options are pricing a move of about $0.97 either way. That is the move the options market is pricing in, derived from what straddles cost. It gives a range of $27.92 to $29.86.
The one level that changes the picture is $27.92. A close below it would mean last week's selling has outrun what the market priced, and the pin case is off.
Both chart-model reports lean bearish, with a five-day target of $28.60. That target is still comfortably inside the options range.
2 · What the options market is pricing
What changed this week
PFE finished Friday at $28.89. That is down 1.70% over five sessions and 2.33% over twenty, after failing to hold the early-November push above $30.
Implied volatility (IV) is the market's estimate of how much PFE will move, baked into option prices. It eased 5.0% over the past five sessions. IV rank slipped to 56.55, against a 7-day average of 61.5 and a 14-day average of 66.9, so the post-selloff premium is bleeding out.
Positioning moved the other way. The put/call open-interest ratio is now 0.95, meaning 0.95 put contracts are held open for every call. Its 14-day average is 0.87, and it ran near 0.80 in late October. Traders added protection after the November 5–6 drop and have not unwound it.
The single biggest open-interest change was in the November 27 $29.50 calls. Open interest jumped by 5,000 contracts, from 166 to 5,166, a fresh bet on a recovery back above $29.50 over the next two weeks.
The short- and long-term trend reads broadly agree. The past week is down, while the picture over the past two months is essentially flat (+0.3%). The flow side has been mending: our read of options flow sits at −5 on a ±100 scale, against −12 over the past week and −18 over two weeks. A short-term momentum crossover flipped from bearish to bullish on November 11.
For the record, into Friday's expiration the November 13 $30.50 calls traded nearly 17,000 contracts and settled worthless. That is now history, not a live level.
Expected move
For the November 20 expiration (seven days from Friday's snapshot), at-the-money IV of about 24.4% implies a one-standard-deviation move of ±3.37%. In dollar terms that is ±$0.97 around $28.89, or $27.92 to $29.86.
| Expiration | Implied move | Range around $28.89 |
|---|---|---|
| November 20 | ±3.37% | $27.92 – $29.86 |
| November 27 | ±4.40% | $27.62 – $30.16 |
| December 11 (~1 month) | ±6.54% | $27.00 – $30.78 |
| December 18 (monthly) | ±8.01% | $26.58 – $31.20 |
The rungs scale roughly with time. The one notable bump is the December 18 monthly, where IV is about 2 points richer than the December 11 weekly. That is consistent with the heavy open interest concentrated in that monthly series.
Volatility
At-the-money IV is 24.41%. IV rank is 56.55/100, which tells you where today's IV sits versus the past year: it is above roughly 57% of the year's readings and cheaper than the other 43%. The IV percentile is a similar 55.
The direction is lower:
- IV fell about 1% on Friday and 5% over five sessions.
- It sits below its 30-day average of 27.0%.
- It is roughly in line with its 90-day average of 24.0%.
The front-month term-structure read is unavailable today because Friday was an expiry day. Term structure means comparing option prices across different expiration dates. The expiration ladder itself is fairly flat, running about 22–26% from late November through mid-January.
Compared against this stock's own recent history, two observations stand out:
- Twenty-day realized volatility of 25.3% is running well above PFE's recent norm. The early-November swings are still in the window.
- The past five sessions have actually been calmer than the month as a whole. The heavy movement is aging out.
Premium is thin, not rich. The volatility risk premium is the gap between how much movement options are priced for and how much PFE has actually delivered. When it's positive, option sellers have been collecting more than realized movement cost them.
Right now the gap is slightly negative. Options are priced about 0.9 vol points below what PFE has delivered over the past 20 days, and that gap is unusually thin for this name. Its percentile is 18/100, meaning today's gap is richer than only 18% of this stock's own recent readings.
The path matters. The gap was about +9 points on November 2. It flipped negative by November 6, as the sharp early-November moves entered the realized window and IV fell back. There is no earnings report anywhere nearby to blame, so this is a genuine thin-premium reading.
Combined with an IV rank near the middle of its range, that favors owning premium over collecting it this week.
Skew and sentiment
Skew describes the fact that puts and calls the same distance from the stock price don't cost the same. When puts are pricier, traders are paying up for crash protection.
On PFE, 25-delta puts are currently priced at about 24.0% IV versus 25.0% for calls. Puts are running about 1.1 vol points cheaper than calls, against a 60-day norm of about 1.0. That is essentially normal.
What matters is the change. On November 6, calls were 6.5 points richer than puts, so put demand has rebuilt from an unusually depressed level over the past week. Traders are restoring downside protection, but not paying up for it.
The put/call ratio measures how much put activity there is relative to calls; above 1 means puts dominate. Friday's put/call volume ratio was 0.52, against a 7-day average of 0.49, a 14-day average of 0.55, and a 60-day median of 0.47. Puts were slightly busier than usual, but calls still did roughly twice the volume. Total option volume ran 1.07× its 20-day average, so there was no stampede.
Sentiment in short-dated options is split:
- 0–7 day expirations: +19. Calls are building.
- 8–30 day expirations: −11. Puts are building and put-side flow dominates.
- Longest-dated (60–120 day) options: strongly positive.
The overall regime reads as a "Bullish Recovery": positioning is building further out, while the near curve stays mixed. Over the past week both near buckets averaged about +3, which is effectively flat.
The key levels map
| Level | Price | Why it matters |
|---|---|---|
| 52-week high / swing resistance | $31.44 | The early-November peak; the top of the year's range |
| Swing resistance | $30.44 | Recent pivot cluster that capped the late-October rally |
| Call wall (Nov 20 and whole chain) · largest gamma strike · gamma flip estimate | $30.00 | 24,143 calls open for November 20 and 140,579 across the chain. This is the heaviest overhead barrier. The flip estimate also sits here (an estimate). |
| Implied range upper rail (Nov 20) | $29.86 | The +1σ edge of what options price into November 20 |
| Unfilled gap-down zone | $29.07 – $29.88 | The November 6 gap from $29.88 to $29.07 has not been filled |
| 20-day moving average | $29.79 | Price sits 3.0% below it; short-term trend overhead |
| Swing resistance | $29.13 | Nearest heuristic resistance above spot |
| Max pain (Nov 20) · second-largest gamma strike | $29.00 | The pin magnet for the target expiration, 11 cents above spot |
| Spot (Friday close) | $28.89 | Reference price |
| 50-day moving average | $28.80 | Price is just 0.3% above it; the first layer of support |
| Swing support | $28.44 | Nearest heuristic support below spot |
| Gamma strike | $28.00 | Third-largest gamma concentration; also heavy put open interest |
| Implied range lower rail (Nov 20) | $27.92 | The −1σ edge; a close below it invalidates the neutral read |
| Swing support | $27.64 | Next pivot cluster below |
| 100-day moving average | $27.34 | Intermediate trend support |
| Swing support · gamma strike | $27.19 / $27.00 | Lower support band with large open interest at $27 |
| 200-day moving average | $26.98 | The long-term trend is still up while price holds above it |
| Put wall (Nov 20 and whole chain) | $25.00 | 43,062 puts open for November 20 and 145,495 chain-wide. This is far below and well outside the week's range. |
| 52-week low | $23.62 | The bottom of the year's range |
Positioning and unusual flow
Market makers hedge the options they've sold. One rough estimate puts the November 20 expiration, and the chain as a whole, in a positive dealer-gamma regime, where that hedging tends to dampen moves rather than amplify them.
The same estimate places the gamma flip level near $30. That is the price below which market-maker hedging tends to accelerate selling rather than cushion it, and spot sits about 4% under it, a bit further below than is typical for PFE lately. Both figures are assumption-based estimates, not observed dealer inventory.
The practical takeaway is that gamma is concentrated at $29 and $30, right on top of the price. That supports the pin case more than the acceleration case.
Notable live flow:
- December 18 $29 calls and puts. The calls traded 4,916 contracts, about $452,000 in premium and Friday's largest dollar trade, adding 3,150 to open interest. The matching $29 puts traded 3,689 contracts (about $341,000) and added 3,852. Size building on both sides of the same strike looks like a volatility position rather than a directional one. Someone wants exposure to a move, either way, into mid-December.
- November 20 $28.50 and $29 puts. Open interest rose by 2,670 and 2,394 contracts respectively. That is fresh near-the-money protection layered right under spot for the target expiration.
- November 20 $30.50 calls. These traded 17,018 contracts at roughly 2.5 cents each, against just 3,471 open. Open interest barely moved (+85), so this was mostly cheap lottery-ticket churn, not a durable position.
3 · Technical check
The 3-day technical report (checkpoint November 18) is bearish. It has a target of $28.72 and a projected range of $28.30–$29.30. The core of its case:
- ADX of 31.5 with sellers' directional strength (−DI 31.0) about double buyers' (+DI 15.1). That is a strong, established short-term downtrend.
- A bounce on light volume.
Its key levels are support at $28.56 (lower Bollinger Band) and resistance at $29.16 (34-period EMA). A close above $29.16 invalidates its bearish scenario.
The 5-day report (target date November 20) is also bearish. It has a target of $28.60 and a projected range of $27.95–$29.75, built on the same trend readings and mild money-flow distribution. It also flags a modest bullish momentum divergence that limits conviction.
Both targets sit inside the options-implied range. The disagreement is about direction, not magnitude, so we classify the technicals as a mild divergence from our neutral options read.
Model vs. Market: The options market implies $27.92–$29.86 into November 20; the 5-day technical model targets $28.60. The model leans lower, but by less than a third of the move options are already pricing. A close below $28.56 would hand the argument to the chart, while holding the $28.80 50-day average keeps the max-pain pin in play.
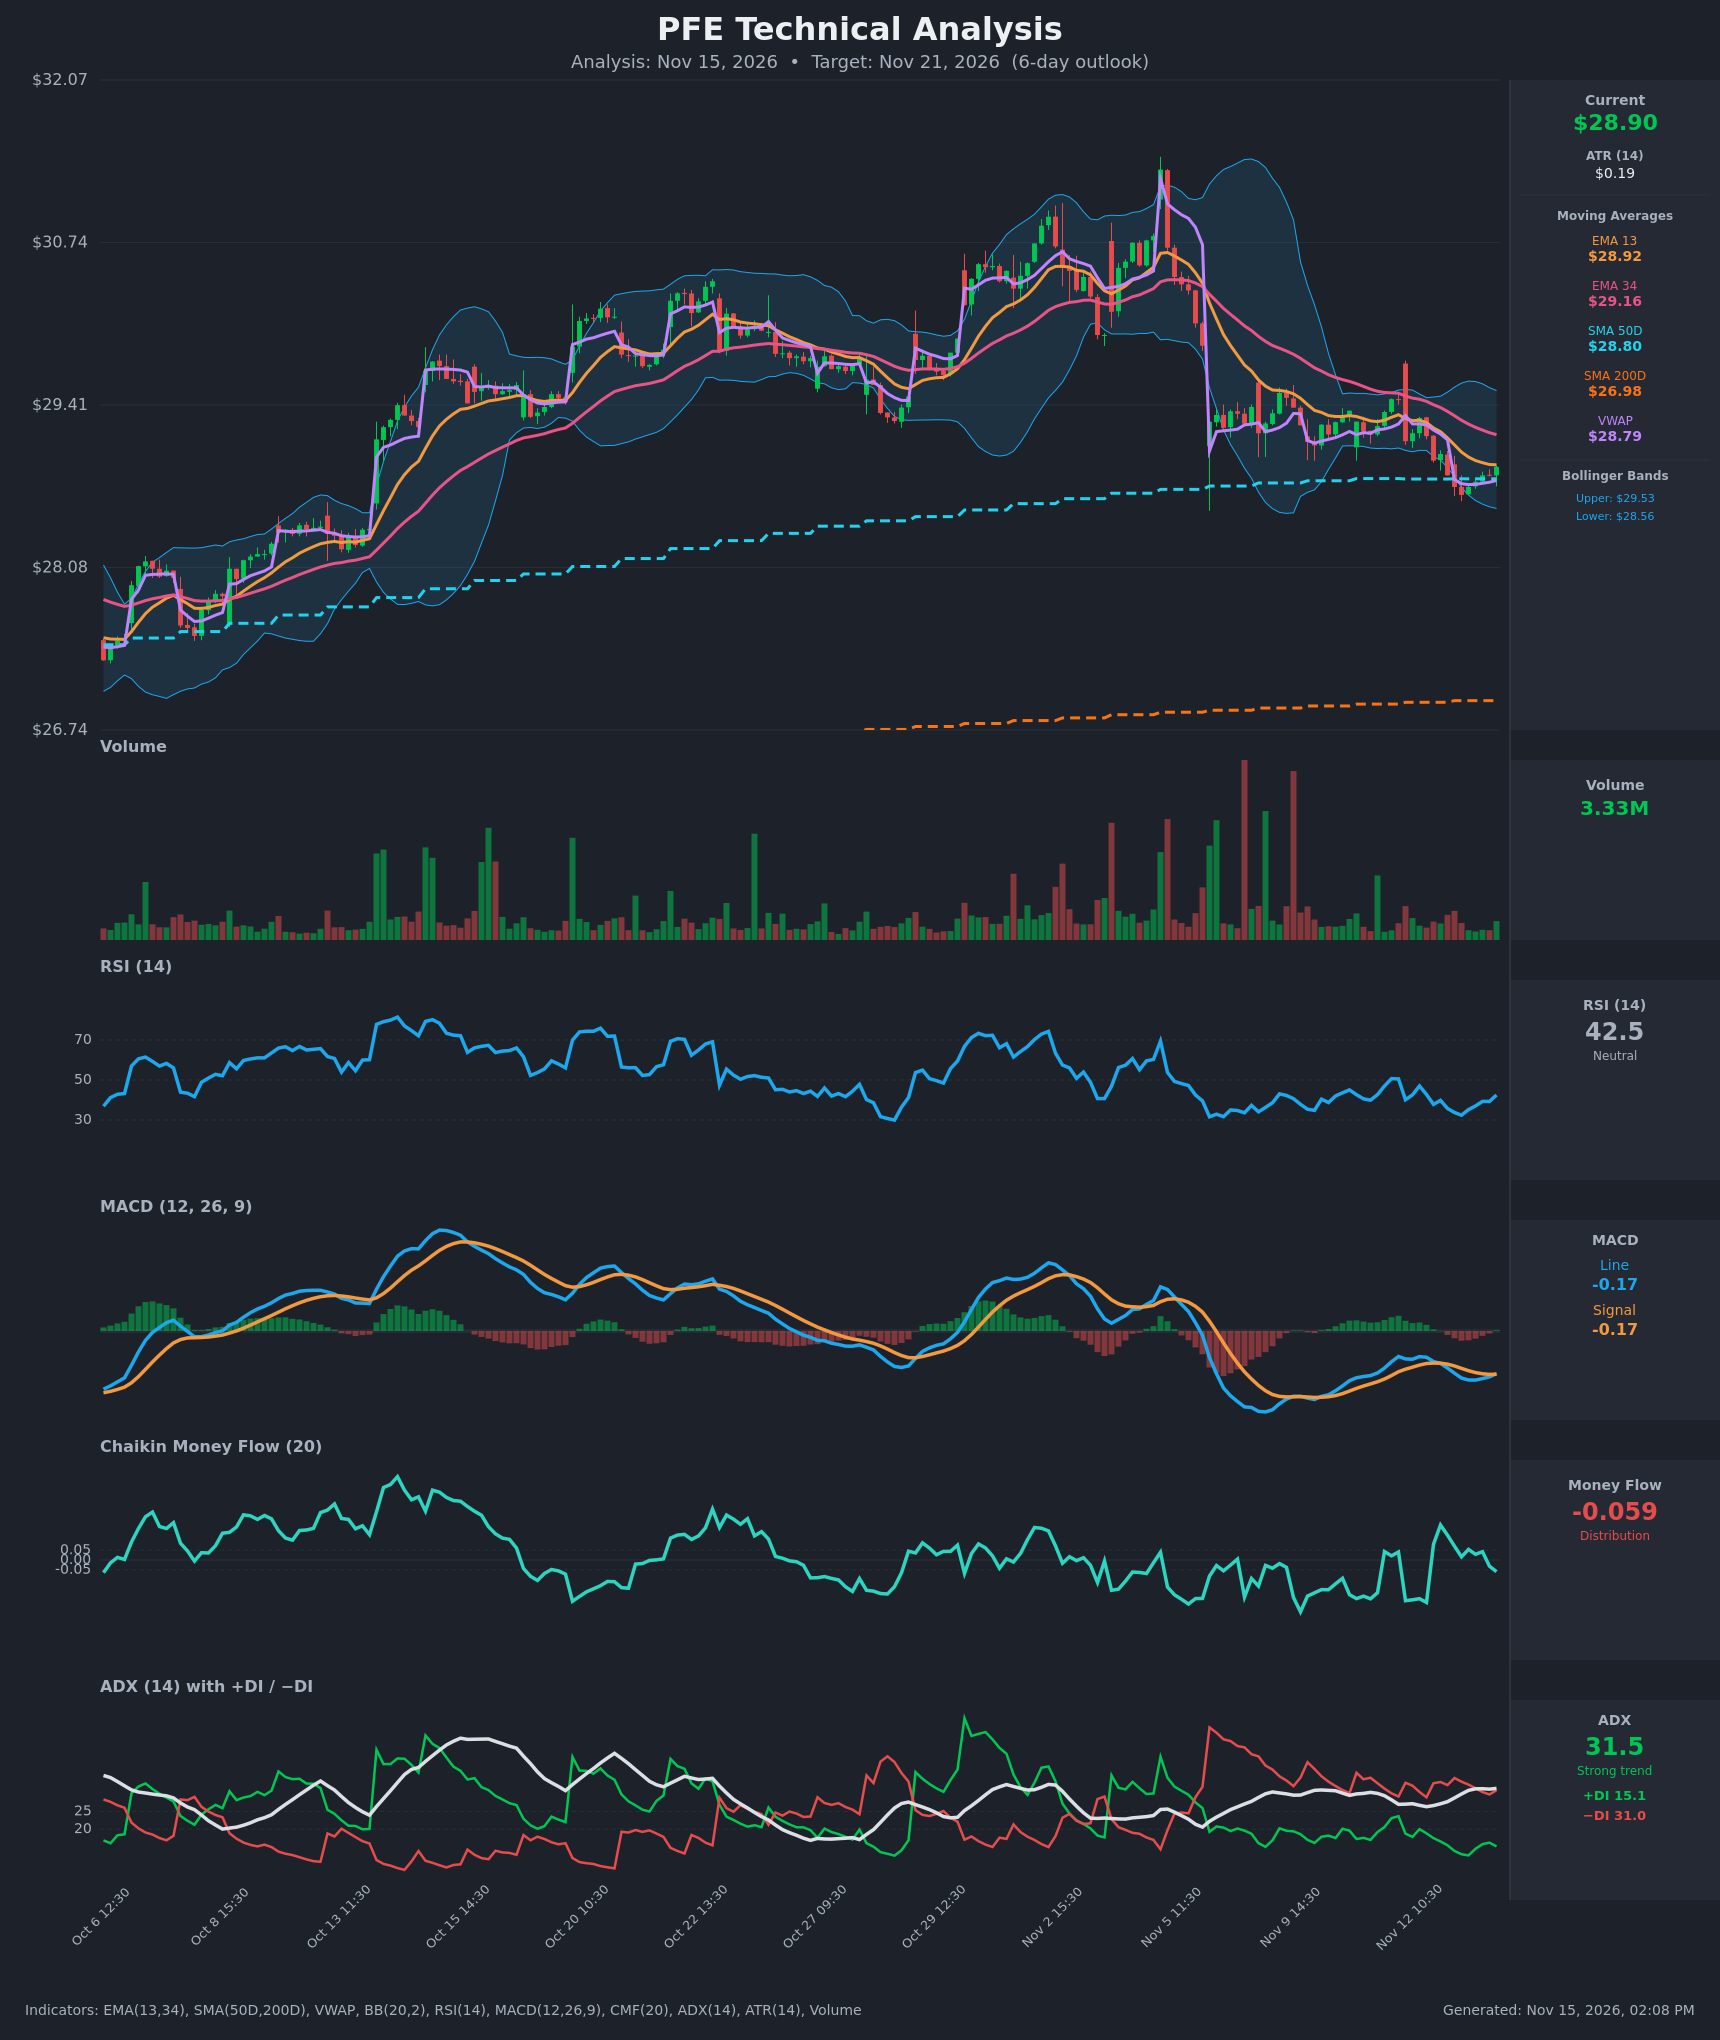
The technicals shaped the bearish structure below: its short strike targets the $28 area that both chart targets point toward. They did not move the butterfly's center away from max pain.
Full technical write-ups: 3-day report → · 5-day report →
4 · Three ways the next five days can go
If PFE pushes above the call wall ($30.00): This is the heaviest call open interest in the chain, and the largest gamma concentration sits there too. Positioning like that tends to slow rallies as hedging leans against them. A clean close through $30 would also reclaim the gap zone up to $29.88. Above it, positioning thins out until the $30.44 swing level. This is the least likely branch given the 8–30 day put building.
If PFE drifts between $28.44 and $29.86: This is the pin case. Max pain sits at $29.00, gamma is concentrated at $29 and $30, and the estimated regime is dampening. Together, those positioning forces tend to pull price toward the $29 strike into November 20, especially in the final two sessions. Falling IV and a calmer recent tape fit this branch.
If PFE breaks below swing support ($28.44) toward the lower rail ($27.92): This is where the chart model's bearish trend would take over. The put wall is far away at $25.00, so there is little options-driven support until the $28 and $27 strikes. Spot is already sitting below the rough $30 flip estimate, where hedging is estimated to add to selling rather than cushion it. A close under $27.92 ends the neutral read.
5 · Three defined-risk structures
Prices are end-of-day midpoints as of November 13, 2026. All structures are hypothetical unless flagged as an entered position. Verify live prices before trading; these will be stale by the open.
Because premium is thin (options are priced below delivered movement), all three structures are debit trades: you pay a defined amount, and that is your maximum loss. They are listed with the best-fitting, range-hold idea first.
If you expect the range to hold: long call butterfly at $29
- Trade: Buy 1 November 20 $28.50 call, sell 2 November 20 $29 calls, buy 1 November 20 $29.50 call.
- Debit: $0.105 ($10.50 per butterfly) · Max profit: $39.50 if PFE closes exactly at $29 on November 20 · Max loss: $10.50 · Break-evens: $28.605 and $29.395
- Why it fits: Max pain is $29.00, the second-largest gamma strike is $29, and the dealer-gamma estimate is dampening. A butterfly is a cheap, defined-risk bet on exactly that pin. You're paying a small debit for a payoff that peaks at the center strike, which suits thin premium better than selling an iron condor would.
- Makes sense only if: PFE holds above the 50-day average ($28.80) through the November 18 checkpoint.
- Invalidated if: PFE closes below $28.44 or above $29.86.
- Managing it: Butterflies earn most of their value in the last two days. Consider taking profits if the position is worth $0.25 or more. Exit by the November 19 close if PFE is outside the break-evens, rather than hoping for a final-day snap back.
- Liquidity note: The $28.50 calls traded 6¢ wide (0.61/0.67), the $29 calls 6¢ wide (0.31/0.37), and the $29.50 calls 1¢ wide (0.14/0.15). With a $0.105 debit, a few cents of slippage is a large share of the trade, so work the order at or near mid.
- Analyze this position →
If you lean bullish: $29/$30 call debit spread
- Trade: Buy the November 20 $29 call, sell the November 20 $30 call. You pay a debit and are betting PFE finishes above $29 by expiration, with gains capped at the call wall.
- Debit: $0.275 ($27.50) · Max profit: $72.50 at or above $30 · Max loss: $27.50 · Break-even: $29.275
- Why it fits: The bearish pressure in options flow has faded for two weeks. Short-dated calls are building, and fresh call open interest just landed at $29.50 for November 27. Capping the spread at the $30 call wall means you don't pay for upside beyond the heaviest barrier.
- Makes sense only if: PFE reclaims $29.16, the level where the chart model's bearish scenario fails.
- Invalidated if: PFE closes below $28.44.
- Managing it: The past week's direction is still down while the two-month trend is flat, which argues for quick profit-taking. Close at around $0.55–$0.60, and exit by the November 19 close regardless.
- Liquidity note: The $29 calls traded 6¢ wide (0.31/0.37) and the $30 calls 1¢ wide (0.06/0.07). Fills near mid are reasonable, but the long leg's spread is wide relative to its price.
- Analyze this position →
If you lean bearish: $29/$28 put debit spread
- Trade: Buy the November 20 $29 put, sell the November 20 $28 put. You pay a debit and are betting PFE finishes below $29, with the payoff capped at $28.
- Debit: $0.335 ($33.50) · Max profit: $66.50 at or below $28 · Max loss: $33.50 · Break-even: $28.665
- Why it fits: Both chart-model targets ($28.72 and $28.60) sit inside this spread's profit zone. The 8–30 day bucket shows puts building, and fresh November 20 put open interest stacked at $28.50 and $29. The $28 short strike sits on a major gamma strike.
- Makes sense only if: PFE closes below the $28.80 50-day average early in the window.
- Invalidated if: PFE closes above $29.16.
- Managing it: Take profits if the spread reaches about $0.60, and exit by the November 19 close. The max-pain pull toward $29 works against this trade in the final sessions.
- Liquidity note: The $29 puts traded 9¢ wide (0.40/0.49) and the $28 puts 2¢ wide (0.10/0.12). The long leg is the costly one to fill, so expect some slippage.
- Analyze this position →
If none of these: no trade
Standing aside is a legitimate call here. Premium is thin, so selling it gives you nothing to lean on, and none of the structures above sells premium for that reason. Buying it is not a free lunch either.
The November 20 contracts trade with bid-ask spreads of 10–20% of their price on several near-the-money strikes. A five-day window doesn't leave much time to overcome that friction. The options read is neutral and the chart read is bearish, so there is no strong directional edge.
If you can't get fills near the midpoint, or the November 18 checkpoint arrives with PFE still parked near $28.90 and no clear break, doing nothing costs you nothing.
6 · Quick FAQ
What is PFE's expected move this week? About ±$0.97 (±3.37%) into the November 20 expiration, a range of $27.92 to $29.86. That is based on the options market's straddle pricing as of the November 13 close.
Is PFE expected to go up or down over the next week? Options positioning as of November 13 reads neutral. Open interest and max pain cluster at $29, and flow pressure has faded, but that is a read of what traders have done, not a forecast. The actionable map is the $27.92–$29.86 range, with $25.00 as put-wall support and $30.00 as call-wall resistance.
Are PFE options expensive right now? IV rank of 56.55/100 says option prices are higher than about 57% of the past year's readings, so they sit mid-range. On top of that, they're running about 0.9 vol points below the movement PFE has actually delivered, richer than only 18% of this stock's own recent readings. That combination favors buying premium over selling it.
Where is PFE's biggest options support and resistance? For November 20, the put wall is $25.00 and the call wall is $30.00, with max pain at $29.00. Nearer structural levels are $28.44 support and $29.13 resistance.
What invalidates this week's read? A close below $27.92, the lower edge of the options-implied range.
Methodology & disclosures. Data: end-of-day options-chain snapshot for PFE, 2026-11-13, generated 2026-11-15T14:08:45.597Z. Prices shown are midpoints and will differ from live markets. Momentum/positioning scores and volatility-premium comparisons are descriptive measurements of past option flow and past price movement — not investment advice, signals, forecasts, or guarantees. All trade structures are hypothetical. Every structure shown has a defined maximum loss; you can lose the entire max-loss amount. Options involve substantial risk and are not suitable for all investors.