PLTR Options Outlook: Can $170 Cap the Bounce Into September 18?
The options market is pricing PLTR between $157.26 and $177.20 into the September 18 expiration, with the week's heaviest call and put open interest stacked on the same $170 strike. Here's what the flow is saying, where the levels sit, and three defined-risk ways to trade it.

The options market implies a $157.26–$177.20 range into the September 18 expiration; here's what's driving it and three defined-risk ways to trade it.
Published Sunday, September 13, 2026 · Data as of Friday, September 11 close
Explore the live PLTR options data in the Detailed Options Analyzer →
Quick answer
| Item | Answer |
|---|---|
| Market bias | Slightly bearish |
| Options-implied range (into September 18) | $157.26 – $177.20 (±5.96%, about ±$9.97 around the $167.23 close) |
| Major support | $170.00 — the September 18 put wall, which unusually sits above Friday's close; the heaviest downside shelf is $160.00 |
| Major resistance | $170.00 — the September 18 call wall (the whole chain's heaviest call strike is $175.00) |
| Max pain (September 18) | $160.00 |
| Dealer gamma regime (estimate) | Positive for the September 18 expiration — hedging tends to dampen moves; flip level ≈ $180.00 |
| Volatility condition | Falling — IV rank 14/100 · premium thin: options priced about 5.5 vol points below delivered movement |
| Technical check | Confirms (bearish, 3-day and 5-day models) |
| Best-fitting strategy | Bear put debit spread (September 18, $167.50/$160.00) |
| Analysis invalidated if | PLTR closes above $170.00 |
1 · What matters today
PLTR closed Friday, September 11 at $167.23 after an 8.4% slide over five sessions. Our read of options flow leans slightly bearish into the September 18 expiration: put open interest has been building faster than call open interest, the unusual-volume sweeps that cleared the bar on Friday were six-to-two put-side, and the price trend over the past week and month is pointing down. Options price a $157.26 to $177.20 range over the next five days — the move the options market is pricing in, derived from what straddles cost — which is about $9.97 either side of the close.
The one level that changes the picture is $170. That single strike holds both the heaviest call open interest and the heaviest put open interest for the September 18 expiration, and it is the biggest gamma cluster in the entire chain. Below it, the market's gravity points toward $160. Both technical models we checked also read bearish, targeting $163.50–$164.75. A close above $170 kills this thesis.
2 · What the options market is pricing
What changed this week
The underlying did the heavy lifting: PLTR fell 8.38% over the trailing five sessions and 6.49% over twenty. Options positioning followed. The put/call open-interest ratio — how many puts are held open for every call — went from 0.74 to 0.89 over five days, a 20% jump; for every 100 call contracts open, there are now 89 puts, against a 14-day average of 0.78. Put/call volume came in at 0.76, roughly in line with its 14-day average of 0.73 but 38% above this name's own 60-day median of 0.55 — heavier hedging than normal for PLTR, even though calls still out-traded puts outright.
Implied volatility kept deflating: at-the-money IV finished at 45.5%, down 4.3% on the day and 3.9% on the week, and down 32.7% over thirty days — now below both its 30-day average (49.3%) and its 90-day average (52.8%). The single biggest change in open interest among still-live contracts was the September 18 $157.50 put, which added 9,067 contracts to 11,473 on 3,200 lots of volume — a fresh downside-protection build near the bottom of the implied range. Close behind, the September 18 $170 call added 8,394 contracts to 20,305 and traded $2.78 million of premium, the largest dollar-premium contract in the chain. Into Friday's expiration itself, flow was frantic and is now settled history: the expiring $167.50 calls turned over 37,011 contracts and the $165 puts 27,957.
One tension worth naming: the short- and long-term trend reads disagree. The past week and the past month both read bearish, but the ~50-day read is still firmly positive on a stock that is up 34% over that stretch. The near-term flow and the bigger trend are pointing in different directions, which argues for short-dated directional exposure and quick profit-taking rather than anything you have to hold for weeks.
Expected move
Into September 18, the options market is pricing a move of about ±5.96%, or ±$9.97 — a $157.26 to $177.20 range around Friday's $167.23 close. That figure comes straight from what at-the-money straddles cost at that expiration (ATM IV there is 43.0%, a touch below the 45.5% chain-wide reading).
| Expiration | Implied move | Range around $167.23 |
|---|---|---|
| September 18 (7 days) | ±5.96% | $157.26 – $177.20 |
| September 25 (14 days) | ±8.57% | $152.90 – $181.56 |
| October 9 (28 days) | ±12.56% | $146.23 – $188.23 |
The ladder rises smoothly with time — no kink, no hump, no event bulge anywhere in the next month. That matters: it means nothing in the chain is pricing a dated catalyst inside this window; the premium you pay is pure time and trend risk.
Volatility
At-the-money implied volatility sits at 45.5% with an IV rank of 14/100 — that is, option prices are cheaper than roughly 86% of the past year's readings, and the IV percentile of 7.5 says PLTR has spent only about 7% of the last year at lower implied vol. The direction is down on every window: −4.3% in a day, −3.9% in a week, −32.7% in a month. The front-month read is unavailable today because Friday was a weekly expiry day, so the comparison across expiration dates can't be computed from this snapshot.
Underneath the surface, movement is decelerating. Twenty-day realized volatility — how much the stock has actually been moving — is 51.0%, which is below this stock's own recent norm, and the five-day-versus-twenty-day realized ratio of 0.64 is also depressed: the last week has been calmer than the month behind it, even with an 8% drawdown inside it.
Premium: thin, not rich. The volatility risk premium — the gap between how much movement options are priced for and how much PLTR has actually delivered — is running at about −5.5 vol points. Option sellers have been collecting less than realized movement has cost them. The percentile reading of 56/100 says today's gap is nonetheless richer than about 56% of this stock's own recent readings, which tells you how brutally negative that gap has been all summer. One caveat on the path: the series jumped from roughly −58 vol points to −6 on September 1. That was the August 4 earnings gap rolling out of the 20-day realized-volatility window — mechanical arithmetic, not a change in trader behaviour. Net of all that: IV rank 14 plus a negative premium over delivered movement favors owning premium this week, not collecting it.
Skew and sentiment
Skew — the fact that puts and calls the same distance from the stock price don't cost the same — is remarkably flat here. The 25-delta put is at 46.5% implied vol against the 25-delta call at 45.7%, a gap of 0.8 vol points, versus a 60-day median of 0.7 for this name and a 14-day average of 1.6. Traders are paying only a token premium for crash protection, and less of one than they were two weeks ago — which is unusual after an 8% slide.
Sentiment across expiration dates is genuinely mixed. The nearest bucket (0–7 days) reads mildly negative at −16, driven by puts building while call open interest bled off; the 7–30 day bucket reads +23 on call-side flow, and the longest bucket reads +26. In other words, the short-dated crowd is defensive and the longer-dated crowd is not. The most extreme reading in the whole snapshot is the peer-relative sweep count: two call contracts versus six puts cleared the unusual-volume bar on Friday, which is deeply unusual for PLTR versus its own recent history — that comparison is against this stock's own norm, not the broader market.
One honest counterweight: our leading positioning read sits mildly negative at −19 while price has dropped 11.5% over the divergence window, and that combination registers as an early bullish divergence — conditions that have historically preceded a turn, not a confirmed turn. It's the strongest argument against the bearish lean, and it's why the structures below are defined-risk rather than naked.
The key levels map
| Level | Price | Why it matters |
|---|---|---|
| Swing resistance | $181.31 | Prior pivot cluster from the late-August breakdown |
| Gamma flip estimate | $180.00 | One rough estimate of where dealer hedging changes character; spot sits well below it |
| Top of implied range | $177.20 | Upper rail of the September 18 expected move |
| 20-day moving average | $175.55 | Price is 4.74% below it — the average is still declining |
| Whole-chain heaviest call strike | $175.00 | 95,580 calls open across all expirations — the aggregate call wall, well above the week's own |
| September 18 call wall AND put wall | $170.00 | 20,305 calls and 13,735 puts open at one strike; also the largest gamma strike in the chain. Caps rallies and pins |
| Swing resistance | $169.34 | Nearest overhead pivot from price structure |
| Friday's close | $167.23 | Reference for every figure above and below |
| Swing support | $164.71 | Nearest pivot shelf below the market |
| September 18 max pain | $160.00 | Where the most option value would expire worthless; 10,772 puts open there |
| Biggest fresh put build | $157.50 | +9,067 contracts on Friday to 11,473 open — new downside hedging |
| Bottom of implied range | $157.26 | Lower rail of the September 18 expected move |
| Heaviest put strike below spot | $155.00 | 11,856 puts open for September 18 — the next real shelf under $160 |
| 50-day moving average | $153.93 | Price is still 8.64% above it — the medium-term uptrend is intact down to here |
Note the collision at $170: the September 18 expiration's own call wall and put wall are the same strike, which is not how these usually line up. The whole-chain aggregate puts its heaviest call open interest at $175 and its heaviest put open interest at $140 — a much wider corridor. For this week, $170 is the level that matters, and because both sides are stacked there, it behaves more like a magnet and a lid than like a floor.
Positioning and unusual flow
The dealer-gamma reading is an estimate built on an assumed hedging convention, so treat it as one. For the September 18 expiration alone, it reads positive — the regime in which market makers' hedging tends to dampen moves rather than amplify them, which supports a pin near $170 into Friday. The same rough model puts its flip marker up near $180, about 7.6% above Friday's close, and spot sits below that marker. Take the pin story as the weaker half of an estimate, not a promise.
Three non-expired flow items stand out. First, the September 18 $157.50 put: 3,200 contracts traded and open interest up 9,067 — someone built real protection just under the bottom rail of the implied move. Second, the September 18 $170 call: 9,796 contracts on $2.78 million of premium, open interest up 8,394 to 20,305 — that is what built the wall, and it sits right at the pivot. Third, a cluster of deep out-of-the-money September 18 puts at $144, $146, $147 and $148 traded 400–550 contracts each against almost no prior open interest — small-dollar, high-turnover crash hedges. None of them is a forecast; together they describe a book that is paying up for tail cover while simultaneously selling upside at $170.
3 · Technical check
Both chart models agree with the options read. The 3-day model (checkpoint September 16) is bearish, targeting $164.75 with a projected range of $162.80 to $171.20. The 5-day model (target September 18, the same date our options thesis resolves) is also bearish, targeting $163.50 with a projected range of $160.50 to $170.00. Both targets sit comfortably inside the options-implied $157.26–$177.20 band, so this is a clean Confirms — same direction, smaller magnitude than the options market is bracketing for.
The two most decisive indicator reads: ADX at 36.4 with the negative directional line (26.5) clearly above the positive one (17.4), which says the downtrend is strong and still in bearish control rather than noise; and Chaikin Money Flow at −0.140, well into distribution territory, indicating persistent selling pressure over the past twenty sessions. Working the other way, RSI has bounced off an oversold 27 to 38.6 and the MACD gap has been narrowing — downside momentum is decelerating even as the trend stays down.
The 5-day model's own invalidation is a sustained close above $169.95, its 34-period EMA. That lands within a nickel of the September 18 call wall at $170 — chart structure and options structure naming the same ceiling is the most useful thing in this section, and it's why the strike selection below is anchored to $170 rather than shaded higher.
Model vs. Market: The options market implies $157.26–$177.20 into September 18; the 5-day technical model targets $163.50 inside a $160.50–$170.00 band. The chart model is making a tighter, directional bet inside the options market's wider two-sided one — which is exactly the shape that favors a debit spread over an outright long put.
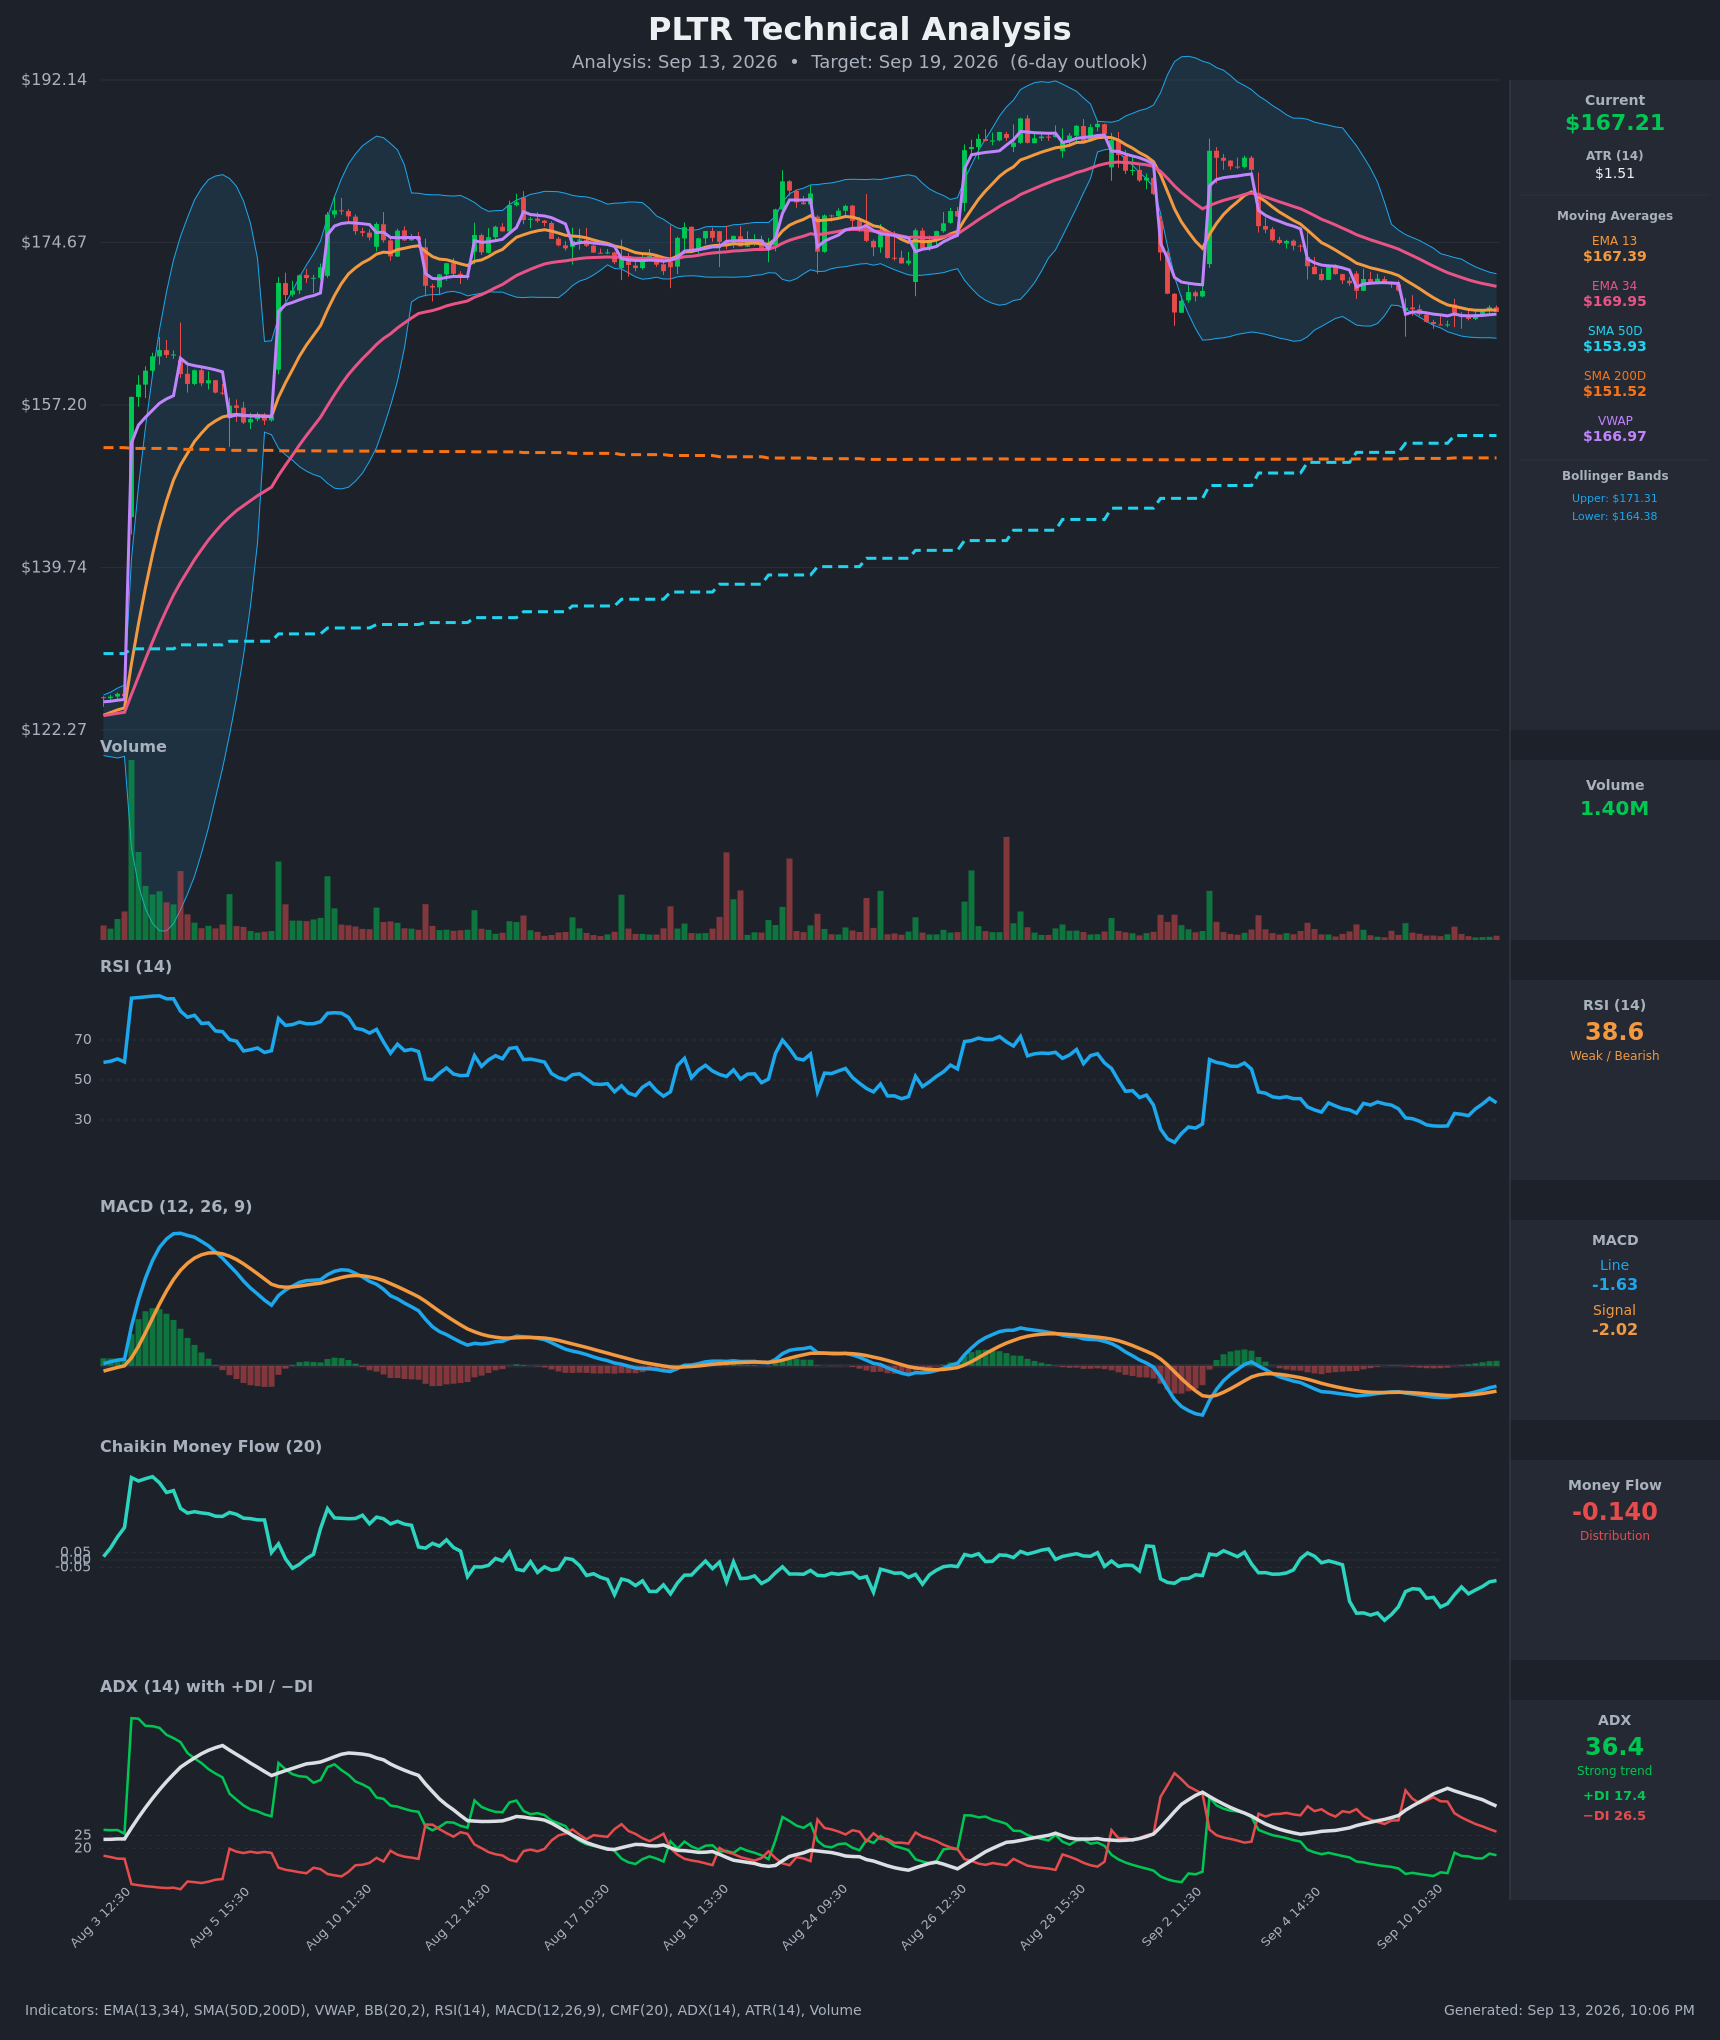
Full technical write-ups: 3-day report → · 5-day report →
4 · Three ways the next five days can go
If PLTR pushes above the call wall ($170): That strike carries 20,305 open calls for Friday and is the chain's single biggest gamma cluster, so rallies into it tend to slow as hedging flows lean against the move. A clean break through leaves thinner positioning overhead until the 20-day average at $175.55 and the chain's heaviest call strike at $175. A close above $170 is also where this article's thesis stops being valid.
If PLTR drifts between $164.71 and $170: This is the pin case, and it's the one the estimated positive-gamma regime for the September 18 expiration supports. Max pain sits at $160, well below the market, so the pull from expiring open interest is downward within that drift rather than neutral — the path of least resistance is a grind toward the lower half of the implied range rather than a violent move.
If PLTR breaks below $164.71: Below the nearest swing shelf, the next magnets are $160 (max pain, 10,772 open puts), then the fresh $157.50 build and the bottom of the implied range at $157.26, then the $155 put shelf. Spot sits about 7.6% below the estimated gamma flip level near $180, which under that rough model is the side where hedging amplifies moves rather than cushioning them — one more reason to treat a break lower as capable of running further than the daily averages suggest.
5 · Three defined-risk structures
Prices are end-of-day midpoints as of September 11, 2026. All structures are hypothetical. Verify live prices before trading — these will be stale by the open.
Leading structure — if you lean bearish: bear put debit spread
- Trade: Buy the September 18 $167.50 put, sell the September 18 $160.00 put
- Debit: $2.66 ($4.05 − $1.395) · Max profit: $484.50 · Max loss: $265.50 · Break-even: $164.85
- Why it fits: With IV rank at 14/100 and options priced about 5.5 vol points below what PLTR has actually delivered, you want to be buying premium, not selling it. The short leg sits exactly at max pain ($160), which caps the trade where the expiring-open-interest gravity is strongest, and the long leg sits just above Friday's close, matching both chart models' bearish targets ($163.50 and $164.75) inside the structure's profit zone.
- Makes sense only if: You want the down-move without paying for the full tail — this gives up everything below $160 in exchange for a 35%-of-width entry cost.
- Invalidated if: PLTR closes above $170.00.
- Managing it: Take profit at roughly 60–70% of max value rather than holding for the last dollar — the near-term bearish read is fighting a long-term trend that is still up 34% over fifty days, so this is a short-leash trade. Exit by Wednesday, September 16 if PLTR is still above $167.50; gamma works against a long debit spread fast in the final two sessions.
- Liquidity note: The $167.50 puts quoted 10¢ wide (about 2.5% of mid) and the $160 puts 3¢ wide on 4,182 contracts of volume — both fill easily.
- Analyze this position →
If you expect the range to hold: iron condor
- Trade: Sell the September 18 $157.50 put / buy the $152.50 put, and sell the September 18 $177.50 call / buy the $182.50 call
- Credit: $0.985 ($98.50) · Max profit: $98.50 · Max loss: $401.50 · Break-evens: $156.52 and $178.49
- Why it fits: Both short strikes sit essentially on the implied-move rails ($157.26 and $177.20), so you're collecting for the market staying inside the range it has already priced. A credit spread means you take the money up front and keep it if price stays between the short strikes.
- Health warning: you're selling premium that hasn't been rich lately — IV rank is 14/100 and the gap between implied and delivered movement is negative. This is the structure the data likes least this week.
- Makes sense only if: You think the past week's calm-down in realized movement continues and the $170 magnet holds price mid-range into Friday.
- Invalidated if: PLTR closes outside $157.50–$177.50 at any point before Friday — manage the threatened side rather than hoping.
- Managing it: Close at ~50% of max credit; with only $98.50 of maximum reward against $401.50 of risk, do not let a tested side run.
- Liquidity note: All four legs quoted 2–3¢ wide; the $157.50 puts traded 3,200 contracts and the $177.50 calls 3,015.
- Analyze this position →
If you lean bullish: put credit spread
- Trade: Sell the September 18 $160.00 put, buy the September 18 $152.50 put
- Credit: $0.975 ($97.50) · Max profit: $97.50 · Max loss: $652.50 · Break-even: $159.03
- Why it fits: If you read the early bullish divergence in the positioning data — price falling while the leading read firms — as the signal that matters, this pays you for PLTR simply staying above $160, roughly 4.3% below Friday's close and right at max pain. You keep the credit if the stock never gets there.
- Health warning: same as the condor — this sells premium at an IV rank of 14 with a negative premium over delivered movement, and it fights both the slightly bearish options read and two bearish chart models. The risk/reward is $652.50 at stake for $97.50.
- Makes sense only if: You are explicitly taking the other side of this article's lean and want defined risk while doing it.
- Invalidated if: PLTR closes below $160.00.
- Managing it: Close at 50% of max credit or on any close below $164.71 (the nearest swing shelf) — do not wait for the short strike to be breached.
- Liquidity note: The $160 puts quoted 3¢ wide on 4,182 contracts; the $152.50 puts 2¢ wide on 2,863.
- Analyze this position →
If none of these: no trade
There is a real case for standing aside. The bearish lean here is mild, not emphatic — the short-term flow is defensive while the 7–30 day expiration bucket leans the other way and the fifty-day trend is still strongly positive. Selling premium is the wrong side of a market where options have been priced below delivered movement for months, and buying premium into a 14/100 IV rank only works if the move actually shows up inside five sessions. If you don't have a view on whether $170 caps this bounce, the honest answer is that this is a $10-wide range with a magnet in the middle of it, and that isn't an edge worth paying commissions for.
6 · Quick FAQ
What is PLTR's expected move this week? About ±$9.97, or ±5.96%, into the September 18 expiration — a $157.26 to $177.20 range around the $167.23 close, per the options market's straddle pricing as of September 11.
Is PLTR expected to go up or down over the next five days? Options positioning as of September 11 leans slightly bearish — puts built 20% faster than calls over five days, unusual sweeps ran six-to-two put-side, and price fell 8.4% on the week — but that's a read of what traders have done, not a forecast. The actionable map is the $157.26–$177.20 range with $170 overhead and $160 as the downside magnet.
Are PLTR options expensive right now? No. IV rank of 14/100 says option prices are lower than about 86% of the past year's readings, and on top of that they're running roughly 5.5 vol points below the movement PLTR has actually delivered over the past month — a gap that is nonetheless richer than about 56% of this stock's own recent readings, because the summer was extreme. The verdict: this is a week to own premium rather than sell it.
Where is PLTR's biggest options support and resistance? For the September 18 expiration, both the call wall and the put wall sit at $170.00 — 20,305 calls and 13,735 puts open at one strike. Below the market, the meaningful shelves are $160.00 (max pain, 10,772 puts) and $155.00 (11,856 puts).
What invalidates this week's read? A close above $170.00. That's the September 18 call wall and, within a nickel, the 5-day chart model's own invalidation level.
Methodology & disclosures. Data: end-of-day options-chain snapshot for PLTR, 2026-09-11, generated 2026-09-13T22:06:46.441Z. Prices shown are midpoints and will differ from live markets. Momentum/positioning scores and volatility-premium comparisons are descriptive measurements of past option flow and past price movement — not investment advice, signals, forecasts, or guarantees. All trade structures are hypothetical. Every structure shown has a defined maximum loss; you can lose the entire max-loss amount. Options involve substantial risk and are not suitable for all investors.