PLTR Options Are Pricing a $10.75 Move — The Chart Model Sees $181.50
The options market implies a $166.89–$188.39 range for Palantir into the September 25 expiration, with the heaviest call open interest at $190 and the heaviest put open interest at $170. Here's what the flow shows, where the levels sit, and three defined-risk ways to trade it.
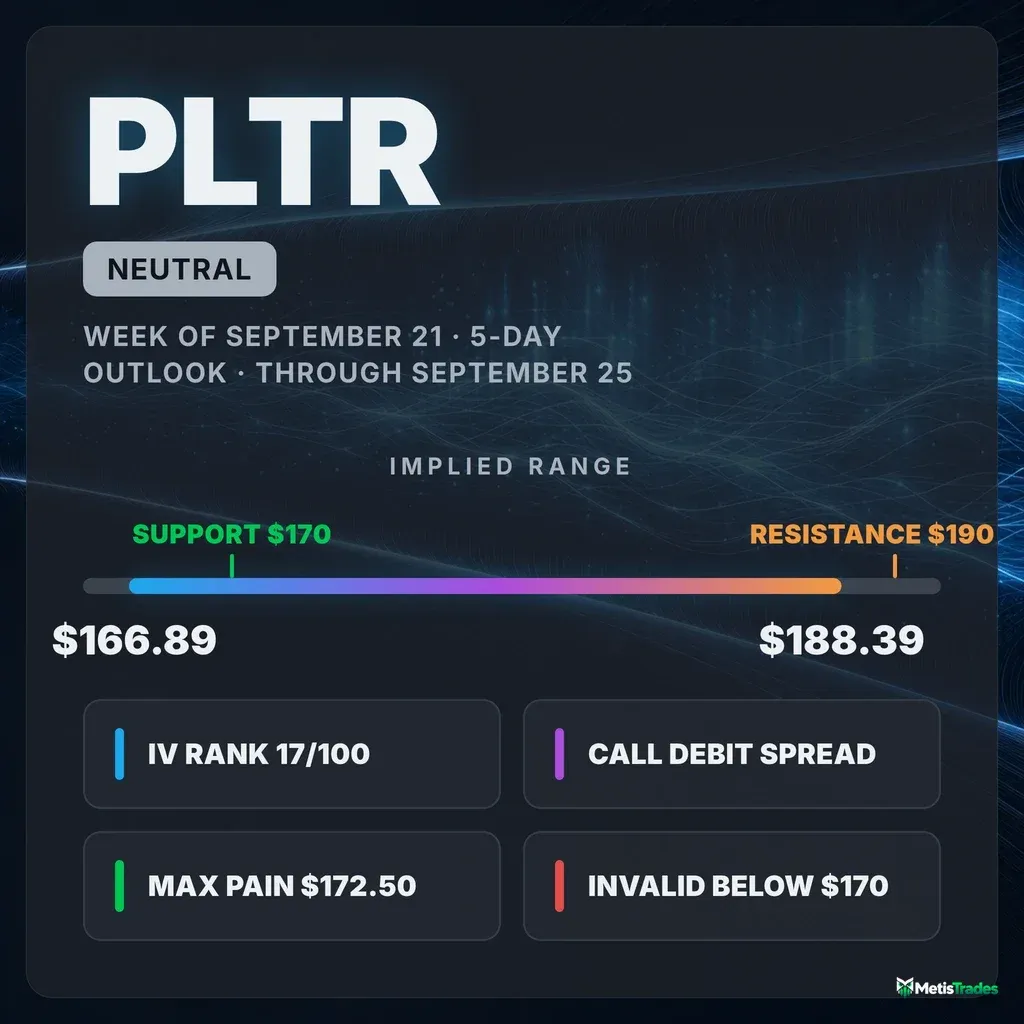
The options market implies a $166.89–$188.39 range into the September 25 expiration; here's what's driving it, where the walls sit, and three defined-risk ways to trade the next five days.
Published Sunday, September 20, 2026 · Data as of Friday, September 18 close
Explore the live PLTR options data in the Detailed Options Analyzer →
Quick answer
| Item | Answer |
|---|---|
| Market bias | Neutral |
| Options-implied range (into September 25) | $166.89 – $188.39 (±6.05%, or ±$10.75) |
| Major support | $170.00 (put wall, September 25) |
| Major resistance | $190.00 (call wall, September 25) |
| Max pain (September 25) | $172.50 |
| Dealer gamma regime (estimate) | Positive — hedging tends to dampen moves; flip level ≈ $55 |
| Volatility condition | Neutral-to-falling — IV rank 16.6/100 · premium thin: options priced about 5 vol points below delivered movement |
| Technical check | Mixed (bullish, 3-day and 5-day models) |
| Best-fitting strategy | Long call debit spread, if you want directional exposure — cheap options argue for owning premium rather than selling it |
| Analysis invalidated if | PLTR closes below $170.00 |
1 · What matters today
Palantir closed Friday, September 18 at $177.64 after a 6.2% run over five sessions, and the options market is pricing a move of roughly ±$10.75 — about 6% — over the next five days, which maps to a $166.89 to $188.39 band into the September 25 expiration. Our read of the options data lands squarely neutral: call-side volume has taken over the tape, but traders are simultaneously paying up for downside puts, and the two cancel out. The levels that matter are concrete. The heaviest pile of open call contracts for that expiration sits at $190 and tends to slow rallies; the heaviest put pile sits at $170 and tends to cushion dips. Both chart models lean bullish with targets inside that band, which supports the range read rather than overturning it. A close below $170 breaks the picture.
2 · What the options market is pricing
What changed this week
The story of the past five sessions is a sentiment flip in the flow, not in the volatility. Put/call volume — how much put activity there is relative to calls, where above 1 means puts dominate — printed 0.49 on Friday against a 7-day average of 0.61 and a 14-day average of 0.71. In plain terms, for every 100 call contracts traded there were 49 puts, versus 71 two weeks ago: the tape has swung call-heavy in a hurry. Open interest tells the same story more slowly, with the put/call open-interest ratio at 0.82 versus 0.84 over the past fortnight. Our flow composite, which had been sitting at roughly −12 over 14 days and −2 over 7, turned positive over the last three sessions, and the underlying is up 6.2% over five days against only +2.1% over 20.
The single biggest change in contracts held open (excluding contracts that settled at Friday's expiry) was the October 16 $100 put, which added 6,959 contracts — deep-out-of-the-money tail insurance, not a directional bet. Closer to the money, the September 25 $150 put added 3,150 contracts and the $165 put 1,812. Into Friday's expiration, settled history shows the $172.50 puts trading nearly 26,000 contracts and the $175 puts 32,500 — that was pin-hunting, and it is now gone. The short-, medium- and long-term trend reads agree directionally (up over the past week, up over the past two months, flat in between), and our momentum read flipped from bearish to bullish on September 17 — a fresh turn that is worth respecting but is only two sessions old.
Expected move
Into September 25, options are pricing a move of about ±6.05%, or ±$10.75 around the $177.64 close — that's the move the options market is pricing in, derived from what at-the-money straddles cost. The ladder:
| Expiration | Implied move | Range around $177.64 |
|---|---|---|
| September 25 (7 days) | ±6.05% | $166.89 – $188.39 |
| October 2 (14 days) | ±8.92% | $161.79 – $193.49 |
| October 16 (28 days) | ±12.80% | $154.90 – $200.38 |
The rungs step up smoothly with the square root of time — no kinks, no humps — which is what a calendar with nothing unusual scheduled inside it looks like from the options side.
Volatility
At-the-money implied volatility across the chain sits at 46.4% — the market's estimate of how much PLTR will move, baked into option prices. The September 25 rung itself prices a slightly lower 43.7%. IV rank is 16.6/100, meaning today's implied volatility is cheaper than roughly 83% of the past year's readings. It is a shade below its own 30-day average of 46.9% and well under the 90-day average of 52.4%, down 5.4% over the past month and essentially flat on the week (+2.0% over five sessions, −1.5% on Friday). The front-month read is unavailable today because Friday was an expiry day, so the comparison of option prices across different expiration dates can't be computed from this snapshot.
Two readings versus this stock's own recent history are worth flagging — "unusual" here means unusual for PLTR, not versus the broader market. Actual delivered movement has been decelerating sharply: the 5-day-versus-20-day realized-volatility ratio is running well below its own norm, with 10-day realized vol at 36.4% against 20-day at 51.5%. And call-tilted volume is running about a standard deviation above its norm — Friday's flow was genuinely call-heavy for this name, not just mildly so.
Premium rich or cheap. The gap between how much movement options are priced for and how much PLTR has actually delivered — the volatility risk premium — is currently negative at about 5 vol points: implied volatility of 46.4% sits below 20-day realized volatility of 51.5%. When that gap is positive, option sellers have been collecting more than realized movement cost them; here they have not been. That said, today's reading sits richer than about 58% of this stock's own recent readings, because the gap has been negative for weeks — the early-September whipsaw (a spike toward $184, a slide to the $168 area) is still inside the 20-day realized window and keeps that leg elevated. The path over the past week widened slightly more negative, from about −2 vol points on September 15 to −5 on Friday, with no sign flip. Put it together with an IV rank of 16.6/100 and the verdict is straightforward: PLTR options are cheap both against their own year and against delivered movement, which favors owning premium over collecting it this week.
Skew and sentiment
Puts and calls the same distance from the stock price don't cost the same. The 25-delta put is marked at 48.3% implied volatility against 46.0% for the 25-delta call — a 2.25 vol-point gap, against a 60-day median of 0.86 points for this name and a 7-day average of about 1.07. Traders are paying roughly 1.4 vol points more than usual for crash protection, and that skew has been steepening steadily over the past five sessions. That is the one clearly bearish ingredient in an otherwise call-tilted picture, and it is the reason the bias comes out flat rather than up.
Sentiment in short-dated options is the definition of unremarkable: every expiration bucket scores inside ±10, which the regime read summarizes simply as "calm." Contracts expiring within a week score +7 (mildly call-side), the 7-to-30-day bucket −6 (mildly put-side). Against three-day averages that were broadly bullish, that's a cooling, not a turn. Total call volume ran 354,889 contracts against 173,896 puts, with overall chain volume 1.31× its 20-day average.
The key levels map
| Level | Price | Why it matters |
|---|---|---|
| 52-week high | $207.52 | 14.4% above the close; the stock sits at the 70th percentile of its yearly range |
| Top of 28-day implied range | $200.38 | What options price as a one-standard-deviation move by October 16 |
| Call wall (September 25) | $190.00 | Heaviest call open interest for the target expiration (5,952 contracts) — the level that tends to cap upside |
| Top of 5-day implied range | $188.39 | Upper rail of what the market is pricing into September 25 |
| Swing resistance | $188.37 | Heuristic swing-pivot cluster from recent price structure (an estimate) |
| Swing resistance | $181.31 | Nearest heuristic resistance shelf above spot |
| Heaviest traded call strike | $180.00 | September 25 $180 calls took $9.25M of premium Friday — the biggest single cluster of new call money |
| Spot / Friday close | $177.64 | Reference for every figure above and below |
| 20-day moving average | $175.90 | Price is 0.99% above it — the near-term trend line the bounce reclaimed |
| Whole-chain heaviest call strike | $175.00 | 97,818 calls open across all expirations combined — note this differs from the September 25 wall at $190 |
| Max pain (September 25) | $172.50 | Where the most option value would expire worthless; expirations sometimes gravitate toward it |
| Put wall (September 25) | $170.00 | Heaviest put open interest for the target expiration (5,618 contracts) — the level that tends to support downside |
| Swing support | $169.34 | Nearest heuristic support cluster below spot (an estimate) |
| Bottom of 5-day implied range | $166.89 | Lower rail of what the market is pricing into September 25 |
| Swing support | $164.65 | Second heuristic support shelf |
| 50-day moving average | $158.26 | Price is 12.25% above it — the bigger uptrend is intact well below here |
| Whole-chain heaviest put strike | $140.00 | 62,903 puts open across all expirations combined — long-dated insurance, not a weekly level |
The disagreement between the September 25 walls ($190 call / $170 put) and the whole-chain aggregates ($175 call / $140 put) is real and worth naming: the aggregate is dominated by far-dated December and January open interest. For the next five days, use the September 25 row.
Positioning and unusual flow
Market makers hedge the options they've sold, and one rough estimate of that hedging suggests PLTR sits in a positive-gamma regime for the September 25 expiration, where dealer hedging tends to dampen moves rather than amplify them. The estimated gamma flip level — below which hedging would start accelerating selling instead of cushioning it — is placed at roughly $55, which is far below spot; on a vs-its-own-norm basis, spot is sitting unusually far above that estimate for this name. Read that as "the estimate flags no fragility this week," not as a guarantee of calm.
Three live flow items stood out on Friday, and all three are call-side:
- September 25 $180 calls — 28,470 contracts traded against 4,391 open, roughly 6.5× turnover, and about $9.25M of premium changed hands. The single biggest money bet of the day, positioned just above spot.
- September 25 $185 calls — 29,094 contracts against 4,917 open, roughly $4.60M of premium, and open interest grew by 1,042. Somebody is paying for a run at the upper half of the implied range.
- October 9 $177.50 calls — 2,953 contracts against just 348 open, an 8.5× turnover ratio on a quiet strike. Small in dollars, but that kind of volume-to-open-interest print is how fresh positioning starts.
Against that, the put side added open interest quietly rather than loudly: the September 25 $165 puts grew by 1,812 contracts on 6,498 volume and the $150 puts by 3,150. Cheap downside hedges being restocked underneath a call-chasing tape — which is exactly the tension the flat bias reflects.
3 · Technical check
Both chart models lean bullish, and both put their targets comfortably inside the options-implied band. The 3-day model targets $179.50 with a projected range of $173.50 to $181.50; the 5-day model, whose horizon matches the September 25 expiration, targets $181.50 with a projected range of $172.50 to $182.80. Their reference price of $177.52 is within a rounding error of the options snapshot's $177.64.
The reasoning behind both is the same cluster of reads: price above its short-term moving averages, a fresh MACD crossover holding, and money-flow turning firmly to accumulation. The important caveat is the one both write-ups make themselves — trend-strength (ADX at 12) is weak enough that this reads as a mean-reverting bounce inside a wide range rather than a new trend. That is a technical way of saying the same thing the options data says, and it is why the overall read stays Mixed rather than Confirms: the direction leans up, but the magnitude sits well inside what options already price, and the options bias itself is flat.
Model vs. Market: The options market implies $166.89 – $188.39 into September 25; the 5-day technical model targets $181.50 with a $172.50 – $182.80 projected range. The chart model is calling for a drift into the upper-middle of the options band — not a breakout. That's an argument for structures that profit from a grind higher inside the range, not for buying the tails.
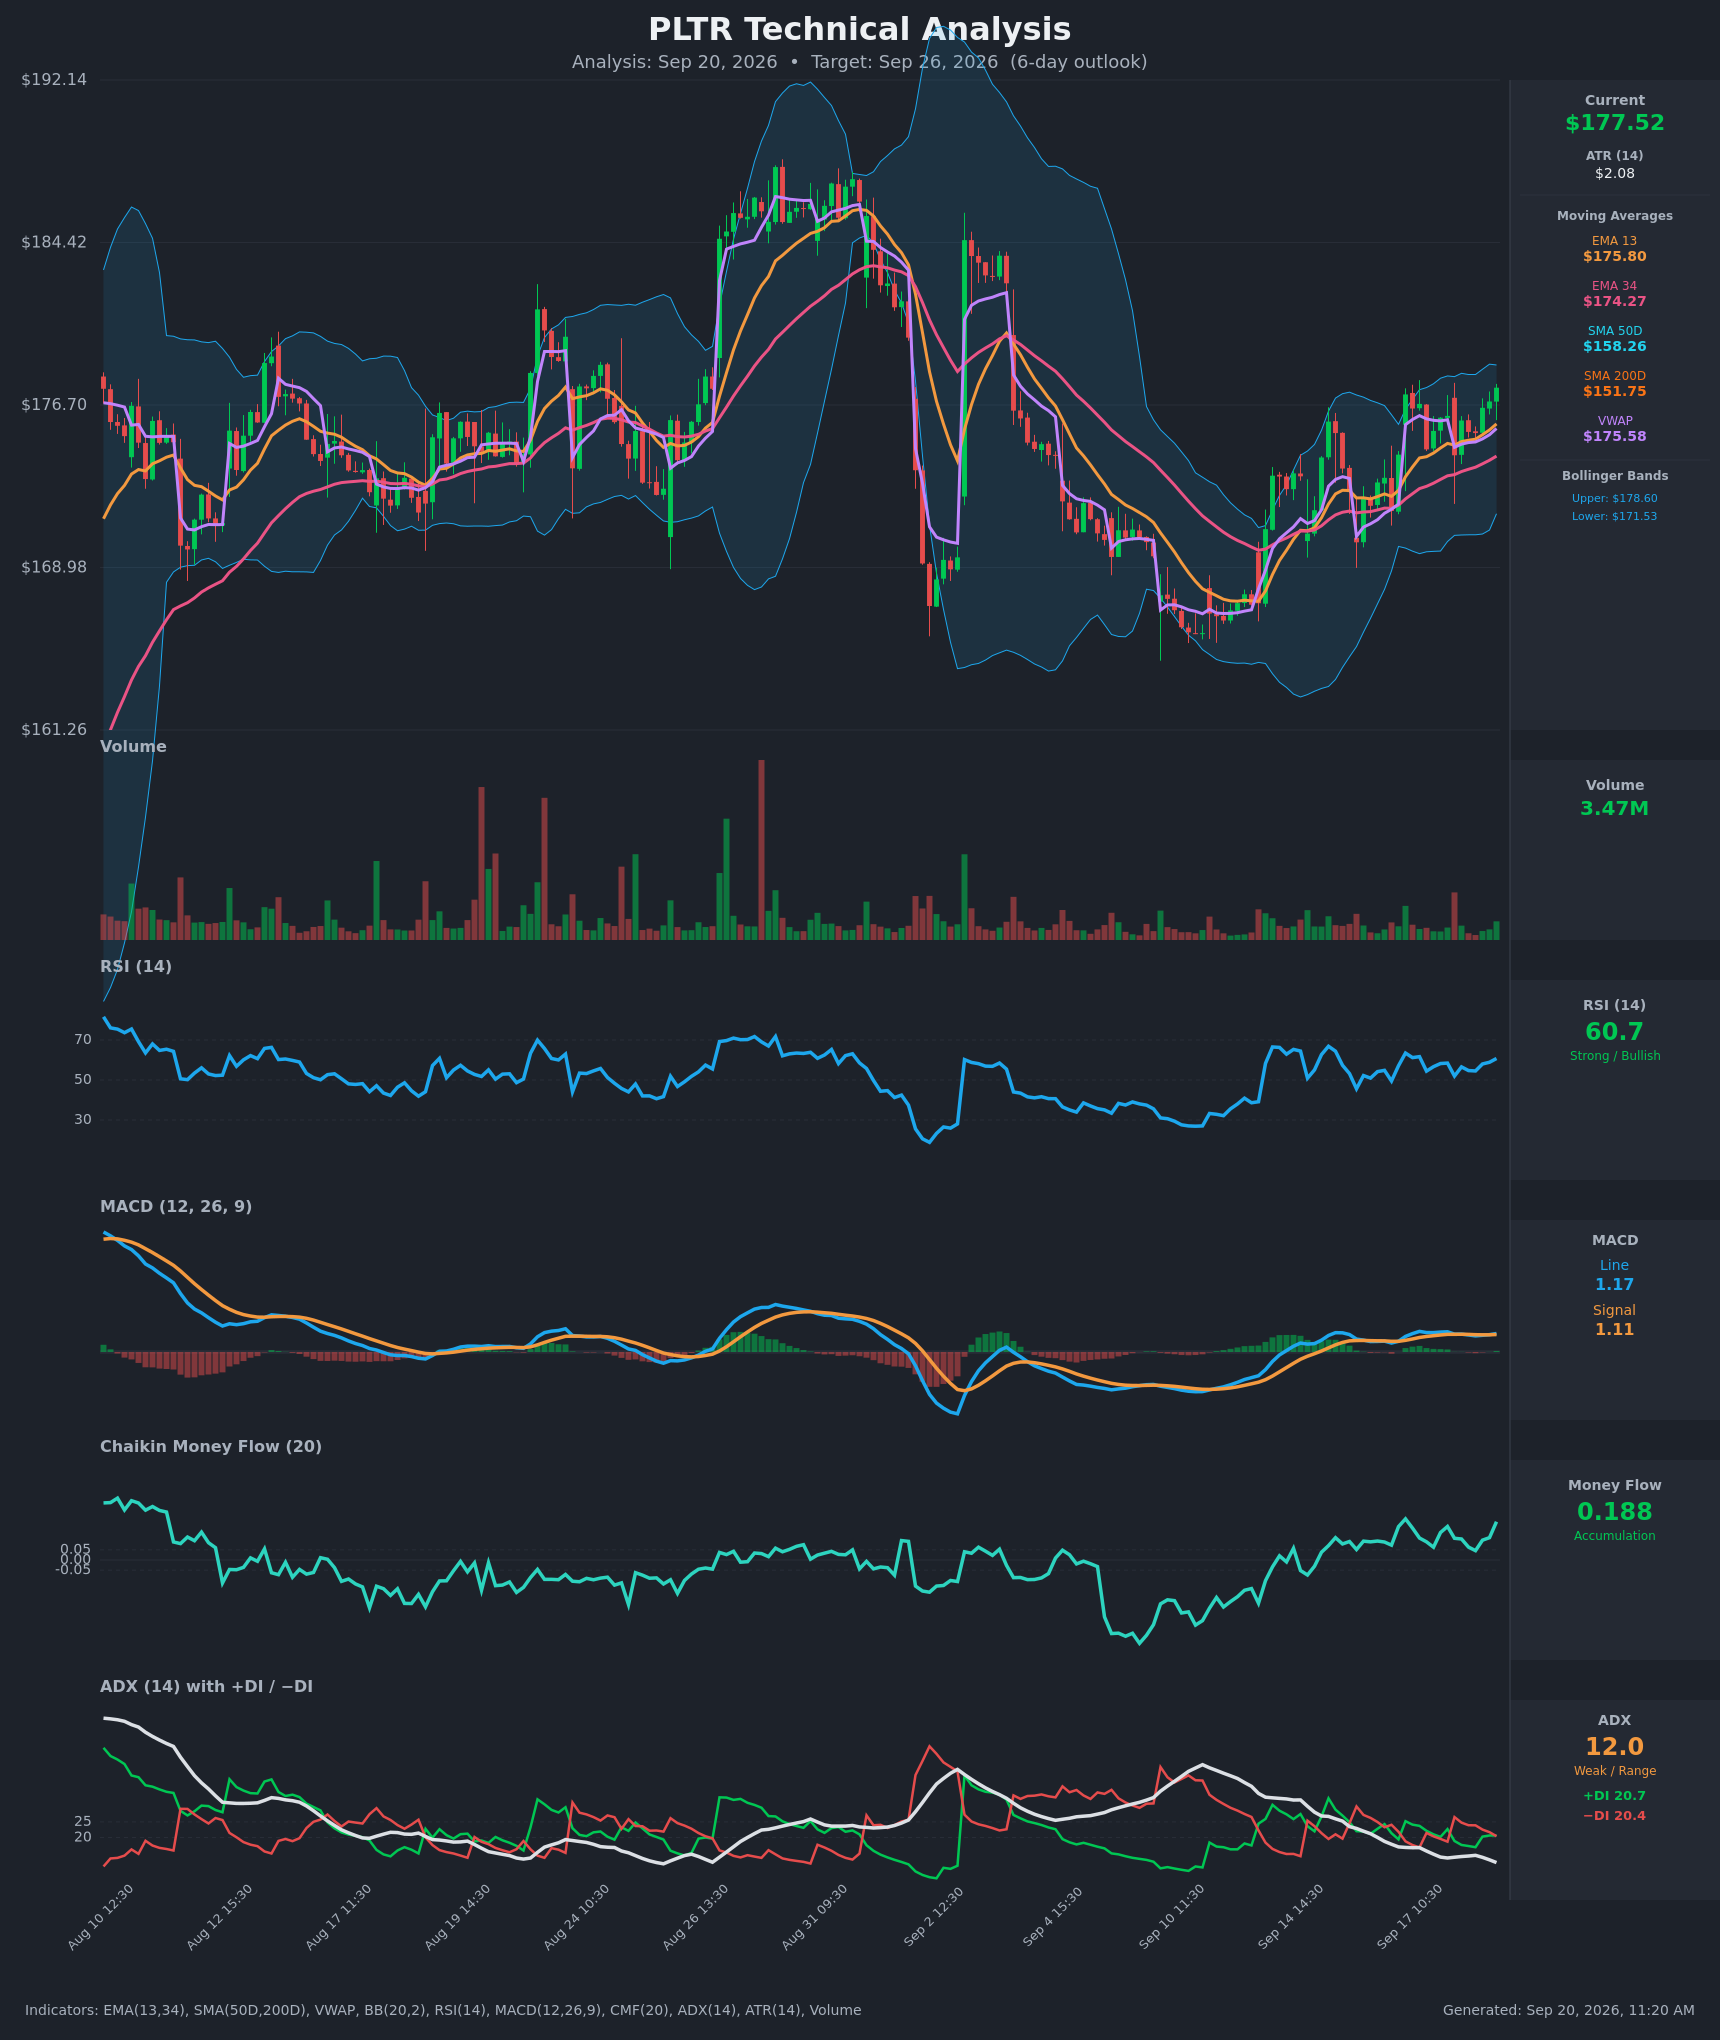
Practically, the technicals shaded one decision below: the bullish structure's short strike sits at $182.50 rather than further out, parked just above the 5-day model's $181.50 target instead of chasing the $190 wall.
Full technical write-ups: 3-day report → · 5-day report →
4 · Three ways the next five days can go
If PLTR pushes above the call wall ($190): that's the strike with the largest pile of open call contracts for September 25, and heavy call open interest overhead tends to slow rallies as dealers hedge into strength. It also sits above the top of the implied range at $188.39, so getting there requires a bigger move than options are pricing. Above it, positioning thins out quickly — the next meaningful marker is the 52-week high at $207.52.
If PLTR drifts between the walls: this is the base case the positioning describes. Max pain for September 25 sits at $172.50 — the price at which the most option value expires worthless — about $5 below Friday's close, and the estimated dealer-gamma regime is the kind that damps moves rather than amplifying them. A grind between roughly $170 and $185, with expiring open interest exerting a mild downward tug toward $172.50 into Friday, is what this chain is shaped for. Both chart models' targets ($179.50 and $181.50) live inside that zone.
If PLTR breaks below the put wall ($170): that strike carries the heaviest put open interest for the expiration, and once price trades through it, the cushioning effect of that positioning fades rather than strengthens. The next markers are the $169.34 swing shelf and then the bottom of the implied range at $166.89. The gamma-flip estimate sits far below at roughly $55, so the estimate does not flag an accelerant here — but it also offers no floor. This is the branch that kills the neutral read.
5 · Three defined-risk structures
Prices are end-of-day midpoints as of September 18. All structures are hypothetical. Verify live prices before trading — these will be stale by the open.
Because options are priced below what PLTR has actually delivered, the debit structures lead this week: you're buying cheap optionality rather than selling rich premium.
If you lean bullish: September 25 $177.50 / $182.50 call debit spread
- Trade: Buy the September 25 $177.50 call, sell the September 25 $182.50 call
- Debit: $1.96 · Max profit: $3.04 ($304 per spread) · Max loss: $1.96 ($196 per spread) · Break-even: $179.46
- Why it fits: A debit spread means you pay up front and profit if the stock rises — your entire risk is the $1.96 paid. With IV rank at 16.6/100 and the volatility premium running about 5 vol points negative, the long leg is unusually cheap by this stock's own standards, and the $182.50 cap sits just above the 5-day chart model's $181.50 target. Friday's largest call flow ($9.25M into the $180 strike) is positioned for the same zone.
- Makes sense only if: you believe the two-session momentum turn has legs and price grinds toward $180–$183. It does not need a breakout — just a close above $179.46 on Friday.
- Invalidated if: PLTR closes below $175.00.
- Managing it: the medium-term (~20-day) trend read is flat even though the short- and long-term reads are up, which argues for taking profits early rather than holding for the cap — close at roughly 65–70% of maximum value if it gets there, and check the position at the Wednesday, September 23 halfway mark; if the spread is still under water with price below $177.64, close it rather than paying the last two days of time decay.
- Liquidity note: the $177.50 calls quoted 20¢ wide ($4.20 × $4.40, about 4.7% of mid) and the $182.50 calls 9¢ wide (3.8%). Both fill easily; use a limit on the package.
- Analyze this position →
If you expect the range to hold: September 25 $165/$170/$190/$195 iron condor
- Trade: Sell the $170 put, buy the $165 put, sell the $190 call, buy the $195 call — all September 25
- Credit: $1.23 · Max profit: $1.23 ($123 per condor) · Max loss: $3.78 ($378 per condor) · Break-evens: $168.78 and $191.23
- Why it fits: The short strikes are the two walls themselves — $170 is the heaviest put open interest for this expiration, $190 the heaviest call. You collect the credit if PLTR simply finishes anywhere between them, which is where max pain ($172.50) and both chart-model targets already sit. The break-evens sit outside the implied range on both sides.
- Health warning: you're selling premium that hasn't been rich lately — implied volatility is running about 5 vol points below PLTR's delivered 20-day movement, and IV rank is 16.6/100. Historically that is the wrong side of the trade to be on; size it smaller than you would in a high-IV week, and note the risk/reward is $378 at risk to make $123.
- Makes sense only if: you think last week's 6.2% move exhausted itself and the next five days are chop. The decelerating realized-volatility ratio supports that; the fresh momentum turn argues against it.
- Invalidated if: PLTR closes below $170.00 or above $190.00 — at that point you're defending, not collecting.
- Managing it: close at roughly 50% of max credit; exit the whole package by Wednesday, September 23 if either short strike is being tested, rather than carrying gamma risk into the final two sessions.
- Liquidity note: the $170 puts traded 3¢ wide and the $190 calls 3¢ wide — both excellent. The $165 puts are the weak leg at 7¢ wide on a 78¢ mid (about 9%); enter the four legs as one limit order rather than legging in.
- Analyze this position →
If you lean bearish: September 25 $177.50 / $170 put debit spread
- Trade: Buy the September 25 $177.50 put, sell the September 25 $170 put
- Debit: $2.69 · Max profit: $4.81 ($481 per spread) · Max loss: $2.69 ($269 per spread) · Break-even: $174.81
- Why it fits: This is the max-pain trade. The short leg sits exactly on the put wall at $170, so you're selling the strike positioning says is hardest to break through and buying the at-the-money put. Break-even at $174.81 sits above max pain ($172.50), meaning a simple drift toward the pin pays. The steepening 25-delta skew — puts running 2.25 vol points over calls versus a 0.86-point norm — says other traders are paying up for exactly this protection.
- Makes sense only if: you read last week's 6.2% pop as a bounce inside a wide range rather than a trend, which is precisely what the weak trend-strength readings in both chart reports describe.
- Invalidated if: PLTR closes above $181.31 (the nearest swing-resistance shelf).
- Managing it: take profit at $4.00 or better rather than waiting for the full $4.81 — the put wall is where the move is most likely to stall. Reassess Wednesday, September 23; if price is above $178 with two days left, the spread's remaining value is mostly time and it's better recycled.
- Liquidity note: the $177.50 puts quoted 15¢ wide ($4.20 × $4.35, about 3.5% of mid) and the $170 puts 3¢ wide. Both are among the most active contracts in the expiration.
- Analyze this position →
If none of these: no trade
There is an honest case for sitting out. The bias is genuinely flat — the call-heavy volume and the steepening put skew argue against each other, and the composite lands at zero, not at a tilt someone rounded to zero. Meanwhile the premium environment is the awkward one: implied volatility is too cheap to make selling the condor attractive (you're collecting less than the stock has actually been delivering), and cheap-but-directionless is a poor reason to buy a debit spread if you don't hold a view. If you have no opinion on whether the two-day momentum turn is real, standing aside through September 25 and reassessing with a fresh chain costs you nothing but a week.
6 · Quick FAQ
What is PLTR's expected move this week? About ±$10.75, or ±6.05%, into the September 25 expiration — a $166.89 to $188.39 range around Friday's $177.64 close, per the options market's straddle pricing as of September 18.
Is PLTR expected to go up or down over the next five days? Options positioning as of September 18 is genuinely neutral — call volume has surged while put skew has steepened, and the two offset — but that's a read of what traders have done, not a forecast. The actionable map is the $166.89–$188.39 range and the $170 / $190 levels.
Are PLTR options expensive right now? No. IV rank of 16.6/100 says option prices are lower than about 83% of the past year's readings; on top of that, they're running about 5 vol points below the movement PLTR has actually delivered over the past 20 days — a gap that still sits richer than about 58% of this stock's own recent readings, because it has been negative for weeks. The verdict favors owning premium rather than selling it.
Where is PLTR's biggest options support and resistance? For the September 25 expiration, the put wall is $170.00 (5,618 contracts open) and the call wall is $190.00 (5,952 contracts open). Across all expirations combined the heaviest strikes are $175 on the call side and $140 on the put side, but those are dominated by far-dated positioning and are not this week's levels.
What invalidates this read? A close below $170.00.
Methodology & disclosures. Data: end-of-day options-chain snapshot for PLTR, 2026-09-18, generated 2026-09-20T11:20:26Z. Prices shown are midpoints and will differ from live markets. Momentum/positioning scores and volatility-premium comparisons are descriptive measurements of past option flow and past price movement — not investment advice, signals, forecasts, or guarantees. All trade structures are hypothetical. Every structure shown has a defined maximum loss; you can lose the entire max-loss amount. Options involve substantial risk and are not suitable for all investors.