QBTS Options Are Pricing a $1.55 Move Into Friday — the Chart Model Sees $16.55
Options positioning in D-Wave Quantum leans bullish while price structure and both technical reads lean bearish, leaving a genuinely two-sided setup into the September 18 expiration. Here is the $15.25–$18.35 implied range, the levels that matter, and three defined-risk ways to trade it.

The options market implies a $15.25–$18.35 range into the September 18 expiration; here's what's driving it and three defined-risk ways to trade it.
Published Sunday, September 13, 2026 · Data as of the September 11 close
Explore the live QBTS options data in the Detailed Options Analyzer →
Quick answer
| Item | Answer |
|---|---|
| Market bias | Neutral |
| Options-implied range (into Sep 18) | $15.25 – $18.35 (±9.21%) |
| Major support | $16.00 (put wall, Sep 18 expiration) |
| Major resistance | $25.00 (call wall, Sep 18 expiration — a legacy pile far above spot; $18.00 is the practical ceiling) |
| Max pain (Sep 18) | $18.00 |
| Dealer gamma regime (estimate) | Positive for the Sep 18 expiration — hedging tends to dampen moves; no flip level is computable from today's chain, and the all-expiration aggregate estimate reads negative |
| Volatility condition | Falling — IV rank 1.55/100 · premium thin: options priced about 3 vol points below delivered movement |
| Technical check | Diverges (bearish, 3-day and 5-day chart models) |
| Best-fitting strategy | Iron condor — Sep 18 $16/$15 put spread plus $18/$19 call spread |
| Analysis invalidated if | QBTS closes below $16.00 |
1 · What matters today
QBTS closed at $16.80 and the options market is pricing a move of roughly $1.55 up or down by Friday, September 18 — a $15.25 to $18.35 band. That number comes from what straddles cost: it is the move the options market is pricing in, not a forecast of direction.
The reason this article lands on Neutral rather than a lean is that the two halves of the data disagree. Options flow is tilted to the call side — call skew is stretched, call open interest is building, and short-dated sentiment reads bullish across every maturity bucket. Price structure says the opposite: the stock is down 19.6% over 20 sessions and 28.6% over 50, below every major moving average. Both chart-model runs also point lower, targeting $16.55. When positioning and trend pull in opposite directions on a name this volatile, the honest read is the range, not the direction. The level that settles it: a close below $16.00, the heaviest put strike for Friday.
2 · What the options market is pricing
What changed this week
Price went nowhere and volatility kept bleeding. QBTS is down just 0.12% over the past five sessions but down 19.6% over 20 — the recent calm sits inside a steep slide. At-the-money implied volatility — the market's estimate of how much QBTS will move, baked into option prices — closed at 69.7%, up 2.1% over five days but down 29.0% over 30, and well under both its 30-day average (80.6%) and 90-day average (95.7%).
Open-interest flows leaned call-side. Put open interest relative to calls slipped to 0.65 from 0.68 five sessions ago, against a 14-day average of 0.77 — for every call contract held open there are now 0.65 puts, so put positioning is thinning, not building. Today's put/call volume ratio of 0.55 ran hotter than its 7-day average of 0.44, meaning a busier-than-usual day for put trading, but calls still dominated overall. The single biggest open-interest change in a live expiration was the September 25 $21 calls, up 2,072 contracts to 2,307 — a near-tenfold build in one session on a strike 25% above spot. Into Friday's settled September 11 expiry, the $18 calls added 722 contracts of open interest before expiring worthless; that is history, not a live level.
The tension worth naming: our short- and long-term trend reads are both anchored bearish (price −19.6% over roughly a month, −28.6% over roughly two), while the past week has been flat with option flow firming — including a fresh momentum crossover on September 8 that turned the near-term read from bearish to bullish. The near-term flow and the bigger trend are pointing different ways, and that disagreement is the whole story this week.
Expected move
Into September 18, the chain prices a ±9.21% move — about $1.55 on a $16.80 stock, or a $15.25 to $18.35 range. Here is how that scales across the next several expirations:
| Expiration | Implied move | Range around $16.80 |
|---|---|---|
| Sep 18 (7 days) | ±9.21% | $15.25 – $18.35 |
| Sep 25 (14 days) | ±13.37% | $14.55 – $19.05 |
| Oct 2 (21 days) | ±16.14% | $14.09 – $19.51 |
| Oct 16 (35 days) | ±21.08% | $13.26 – $20.34 |
The ladder scales almost exactly with the square root of time — no bump, no kink, no single date the chain is bracing for. That is a clean, event-free curve.
Volatility
At-the-money IV of 69.7% carries an IV rank of 1.55/100 — today's reading is cheaper than roughly 98% of the past year's, and the 52-week percentile of 0.79 says it has been lower on fewer than 1% of days. Its own 7-day average IV rank was 3.30, so even by the standards of the past two weeks, this is the floor of the floor. Front-month term structure is unavailable today: the chain's nearest expiration was a same-day expiry, so that comparison across expiration dates cannot be interpolated — an expiry-day artifact, not a gap in the data.
One "vs its own norm" reading stands out: 20-day realized volatility — how much the stock has actually been moving — sits at 72.9% annualized, which sounds enormous but is unusually depressed for QBTS against its own recent history. Compared against this stock's own past, not the broader market, QBTS has been quiet. Five-day movement is running slightly below the 20-day pace, about typical.
Premium rich or cheap. The gap between what options are priced for and what the stock has actually delivered — when it is positive, option sellers have been collecting more than realized movement cost them — is currently negative by about 3 vol points (69.7% implied versus 72.9% delivered). Sellers have been paid less than the stock's actual movement. That said, the gap sits at the 64th percentile of this stock's own recent readings, meaning it is less unfavorable to sellers than about two-thirds of the past three months; a week ago it was negative by roughly 1 point, and in late August by more than 25 points. The path there is mechanical — realized volatility has been cooling faster than implied. The verdict: an IV rank of 1.55 plus a premium still running below delivered movement favors owning optionality over selling it. Any credit structure this week is a bet on the range holding, not a bet on collecting rich premium.
Skew and sentiment
Skew measures whether puts and calls the same distance from the stock price cost the same. Here they don't — and not in the usual direction. The 25-delta put trades at 66.3% implied volatility against 72.7% for the 25-delta call, so calls are 6.3 vol points richer than puts, against a 60-day median of 3.1 points. Traders are paying up for upside, not crash protection, and they are doing so at roughly double the usual intensity — that call-skew stretch is well above this stock's own norm, one of the most extreme positioning readings in today's data.
Short-dated sentiment agrees. Our read of option flow by expiration bucket is broadly bullish across the curve: the 0–7 day bucket scores +31, the 7–30 day bucket +25, the 30–60 day bucket +30 and the 60–120 day bucket +34, with call open interest building and call-side flow dominating in three of four buckets. Call-side sweeps also ran hotter than usual — five call contracts cleared the peer-relative unusual-volume bar today against zero puts, a busier-than-normal day for this name.
That is the bullish half of the ledger. The bearish half is price: the stock sits 7.3% below its 20-day average, 10.6% below its 50-day and 21.6% below its 200-day, and 64% below its 52-week high of $46.75.
The key levels map
| Level | Price | Why it matters |
|---|---|---|
| Call wall (Sep 18 expiration) | $25.00 | 9,577 calls held open — the heaviest call strike for Friday, but far enough above spot that it is legacy positioning rather than a live ceiling |
| 200-day moving average | $21.42 | Price sits 21.6% below it |
| Whole chain's heaviest strike | $20.00 | 24,551 calls and 22,836 puts across all expirations combined, and the largest gamma strike in the chain — an October magnet, not a September one |
| 50-day moving average | $18.80 | Overhead by 10.6% |
| Swing resistance | $18.46 | Heuristic swing-pivot cluster from recent price action |
| Options-implied ceiling (Sep 18) | $18.35 | Top of the ±9.21% band the chain is pricing |
| 20-day moving average | $18.12 | First trend line a recovery would have to reclaim |
| Max pain (Sep 18) | $18.00 | The price where the most option value would expire worthless; also the third-largest gamma pile in the chain and the practical overhead shelf |
| Swing resistance | $17.74 | Heuristic swing-pivot cluster |
| Chart model's 5-day ceiling | $17.35 | Top of the technical model's projected range |
| Technical resistance | $17.05 | Both chart reports treat a close above this as the bear case's kill switch |
| Heavy gamma strike | $17.00 | Second-largest gamma pile in the chain; the Sep 18 $17 puts were the single most-traded contract in the book |
| Spot | $16.80 | September 11 close |
| Technical support | $16.44 | Lower Bollinger band and the chart models' stated support |
| Swing support | $16.09 | The only heuristic support level below spot in recent structure |
| Put wall (Sep 18 expiration) | $16.00 | 3,518 puts held open — the heaviest put strike for Friday and this week's floor candidate |
| Options-implied floor (Sep 18) | $15.25 | Bottom of the ±9.21% band |
| 52-week low | $12.75 | Price sits 31.8% above it |
Note the split between the week's own levels and the whole chain's: the September 18 expiration's call wall is $25.00 and its put wall $16.00, while the aggregate across all nine covered expirations piles up at $20.00 on both sides. The $20 strike is an October story; for Friday, the levels that matter are $16.00 below and the $18.00 max-pain shelf above.
Positioning and unusual flow
Market makers hedge the options they have sold, and in the regime this chain estimates for the September 18 expiration — a positive signed-gamma estimate — that hedging tends to dampen moves rather than amplify them. Treat that as one rough estimate built on an assumed dealer sign convention, not observed inventory; the aggregate estimate across all expirations reads the other way, negative, and no gamma flip level is computable from today's chain. The week-specific read is the one that applies to Friday's expiry.
Three live flow items stood out:
- Sep 18 $17 puts — 2,851 contracts traded against 2,303 open, about $204,000 of premium, the largest dollar flow anywhere in the chain. That is heavy two-way business right at the money, not a directional statement.
- Oct 16 $22 calls — 3,869 contracts against 3,238 open, roughly $120,000 of premium, with open interest actually falling 37 contracts: a lot of turnover, much of it closing.
- Sep 25 $21 calls — open interest jumped from 235 to 2,307, the largest build in any unsettled contract. Someone established a sizeable lottery-ticket position 25% above spot for two weeks out.
3 · Technical check
Both chart-model runs are bearish, and both land on the same target: $16.55. The 3-day report (target date September 16) projects a $16.20–$17.05 range; the 5-day report (target date September 18, matching this article's horizon) projects $15.95–$17.35. Both cite the same structure: price below the EMA13/EMA34 cluster at $16.90–$17.00, MACD below signal, −DI above +DI, and price far under the 50- and 200-day averages. Both also flag a weak ADX near 14, which argues the downside drift is choppy rather than forceful.
Against the options read, this is a divergence on direction and a confirmation on magnitude. The chart models' targets and both projected ranges sit entirely inside the options-implied $15.25–$18.35 band, so nobody is arguing about how far the stock can travel — only about which way. The clean resolution level is the one both reports name: a close back above $17.05 invalidates their bearish case, and a close below $16.44 triggers it toward $15.90–$16.25.
Model vs. Market: The options market implies $15.25–$18.35 into Friday; the 5-day technical model targets $16.55 within a $15.95–$17.35 band. The chart sees a slow bleed inside a range the options market says is wide enough to contain far more — which is exactly why this week's structures are built to profit from the range holding rather than from a direction resolving.
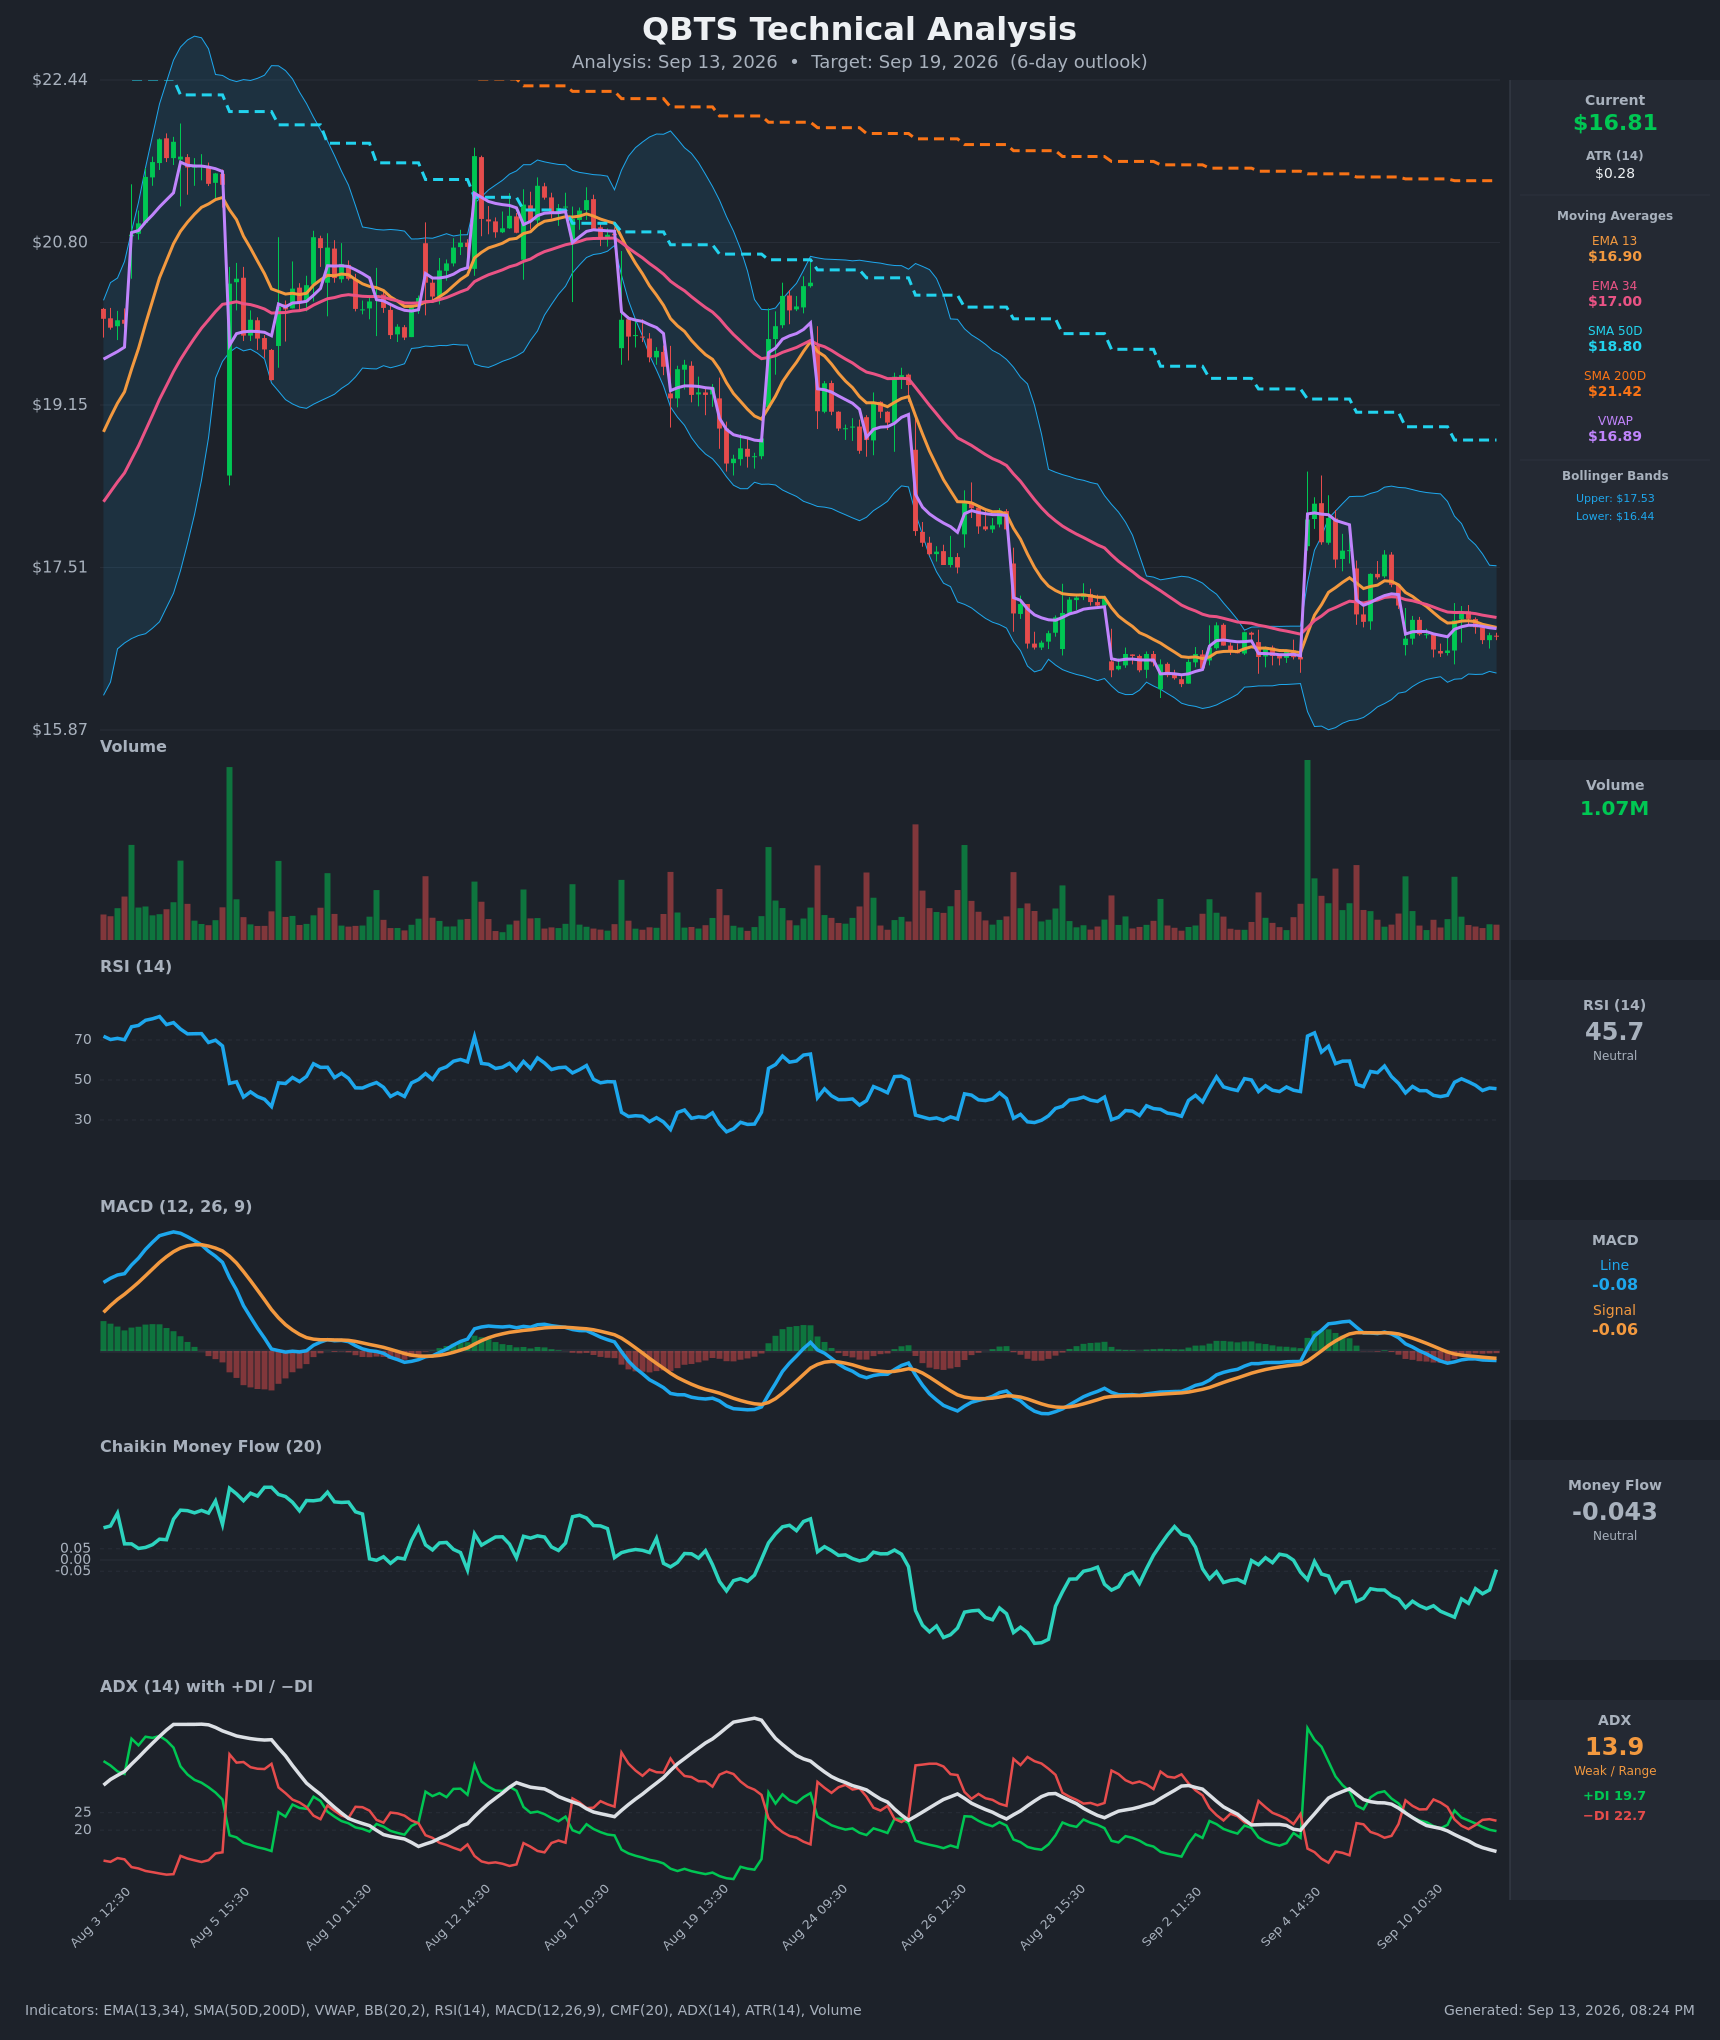
Full technical write-ups: 3-day report → · 5-day report →
4 · Three ways the next five days can go
If QBTS pushes above $18.00: that is Friday's max pain and the third-heaviest gamma strike in the book, sitting just under the 20-day average at $18.12 and a swing-resistance cluster at $18.46. Heavy open interest overhead tends to slow rallies as hedging flows lean against them. Above $18.46, positioning thins considerably until the $20.00 shelf, where the whole chain's open interest is concentrated — but $20 is 19% away, outside what Friday's options are pricing.
If QBTS drifts between $16.00 and $18.00: this is the base case the structures below are built for. With the September 18 expiration's dealer-gamma estimate reading positive, hedging flows in this regime tend to cushion rather than extend moves, and expiring open interest tends to pull price toward the strikes where the most contracts die — $18.00 on the max-pain math, though the put wall at $16.00 anchors the other end. A five-session drift that ends anywhere between those two levels resolves most of this week's open interest quietly.
If QBTS breaks below $16.00: the put wall is the last dense support strike for Friday, and beneath it the heuristic swing levels are empty until the implied floor at $15.25. The 5-day chart model's bearish scenario targets $15.90–$16.10 on a close below $16.44, which is only about 2% under spot. No gamma flip level can be estimated from today's chain, so there is no modelled acceleration point to name — but the all-expiration aggregate gamma estimate does read negative, the side on which hedging tends to amplify moves rather than cushion them.
5 · Three defined-risk structures
Prices are end-of-day midpoints as of September 11. All structures are hypothetical. Verify live prices before trading — these will be stale by the open.
If you expect the range to hold: iron condor
- Trade: Sell the Sep 18 $16/$15 put spread and the Sep 18 $18/$19 call spread (four legs, one condor)
- Credit: $0.335 ($33.50 per condor) · Max profit: $33.50 · Max loss: $66.50 · Break-evens: $15.67 and $18.34
- Why it fits: A credit spread means you collect premium up front and keep it if price stays away from your short strikes. The short strikes here are the two levels the data actually names — the $16.00 put wall and the $18.00 max-pain strike — and the upper break-even at $18.34 lands almost exactly on the top of the options-implied range. The Sep 18 expiration's own gamma estimate is the dampening kind.
- Makes sense only if: you believe the ±$1.55 the market is pricing overstates what actually happens in five sessions. Both short strikes sit inside that one-sigma band, so this is explicitly a bet that the implied move is too generous.
- Health warning: you are selling premium that hasn't been rich lately — options are priced about 3 vol points below what QBTS has actually delivered, and IV rank is at 1.55/100. Size this smaller than you would in a high-IV name.
- Invalidated if: QBTS closes through either short strike — below $16.00 or above $18.00.
- Managing it: close at roughly 50% of max credit; exit regardless by Thursday's close rather than carrying expiration-day gamma on a name that has gapped 6.8% in a single session this month. If either short strike closes in the money, close rather than hope.
- Liquidity note: the $16 puts trade 2¢ wide ($0.25/$0.27) and the $18 calls 2¢ wide ($0.22/$0.24) — both tight. The $19 calls are the weak link at $0.07/$0.10; that leg alone can cost you 3¢ of a $33.50 credit, so work the order as a package.
- Analyze this position →
If you lean bullish: long $17/$18 call spread
- Trade: Buy the Sep 18 $17 call, sell the Sep 18 $18 call
- Debit: $0.305 ($30.50) · Max profit: $69.50 · Max loss: $30.50 · Break-even: $17.31
- Why it fits: A debit spread means you pay up front and profit if price rises through your long strike. This one pays in full at $18.00 — the max-pain strike the expiration's open interest is built around — and it is the cheap side of the volatility trade: with IV rank at 1.55/100 and premium running below delivered movement, you are buying optionality at the bottom of its yearly range rather than selling it.
- Makes sense only if: you side with the option flow over the price trend — call skew at double its usual stretch, bullish short-dated sentiment, and a momentum crossover on September 8.
- Invalidated if: QBTS closes below $16.44, the level both chart models treat as the trigger for the next leg down.
- Managing it: because the short-term flow read is fighting a trend that is bearish over both 20 and 50 sessions, take profits earlier than you otherwise would — around 60–70% of max value, and don't hold into Friday's close hoping for the last nickel.
- Liquidity note: the $17 calls quote $0.50/$0.57 (7¢, about 13% of mid) and the $18 calls $0.22/$0.24 (2¢). The long leg is the expensive one to cross — use a limit at the mid and be patient.
- Analyze this position →
If you lean bearish: long $17/$16 put spread
- Trade: Buy the Sep 18 $17 put, sell the Sep 18 $16 put
- Debit: $0.455 ($45.50) · Max profit: $54.50 · Max loss: $45.50 · Break-even: $16.55
- Why it fits: It pays in full at $16.00 — exactly the put wall — and its break-even of $16.55 sits on the chart models' shared target of $16.55. This is the structure that matches the technical read most precisely, and like the call spread it is long cheap premium rather than short thin premium.
- Makes sense only if: you side with price structure over flow: below the 20-, 50- and 200-day averages, −DI above +DI, and the failed early-September gap being steadily faded.
- Invalidated if: QBTS closes above $17.05 — the level both technical reports name as the bear case's kill switch.
- Managing it: take it off at 60–70% of max value or at the $16.00 put wall, whichever comes first; heavy open interest at a strike tends to slow price there, and waiting for the final few cents of intrinsic value against a wall is a poor trade.
- Liquidity note: the $17 puts were the busiest contract in the entire chain — $204,000 of premium — and quote $0.67/$0.76, about 9¢ wide; the $16 puts are 2¢ wide. Fills should be reasonable at the mid.
- Analyze this position →
If none of these: no trade
There is a real case for standing aside. Implied volatility at an IV rank of 1.55/100 means credit structures are being paid the least they have been paid in a year, and the premium on offer still sits below what the stock has actually delivered over the past month — you are being underpaid to sell risk on a name that gapped 6.8% in one session ten days ago. On the other side, buying cheap options requires the move to actually happen inside five sessions, and the two reads that would tell you which direction to buy are flatly contradicting each other. A setup where the premium is thin, the direction is unresolved, and the underlying can move 7% overnight is a setup where the best expression is often a smaller position or none at all.
6 · Quick FAQ
What is QBTS's expected move this week? ±$1.55 (±9.21%) into the September 18 expiration, a $15.25–$18.35 range, per the options market's straddle pricing as of the September 11 close.
Is QBTS expected to go up or down over the next five days? Options positioning as of September 11 leans bullish — call skew is roughly double its usual stretch and short-dated sentiment is positive across every expiration bucket — while price structure and both technical models lean bearish. That's a read of what traders have done, not a forecast. The actionable map is the $15.25–$18.35 range and the $16.00 / $18.00 levels.
Are QBTS options expensive right now? No. An IV rank of 1.55/100 says option prices are lower than roughly 98% of the past year's readings, and on top of that they are running about 3 vol points below the movement QBTS has actually delivered over the past 20 days — though that gap is less unfavorable to sellers than about 64% of this stock's own recent readings. Net: owning premium is the cheaper side of this market.
Where is QBTS's biggest options support and resistance? For the September 18 expiration, the put wall sits at $16.00 (3,518 contracts held open) and the call wall at $25.00 (9,577 contracts) — though $25 is far enough above spot that $18.00, the max-pain strike, is the more practical ceiling this week. Across all expirations combined, the heaviest strike on both sides is $20.00.
What invalidates this week's read? A close below $16.00.
Methodology & disclosures. Data: end-of-day options-chain snapshot for QBTS, 2026-09-11, generated 2026-09-13T20:24:04.836Z. Prices shown are midpoints and will differ from live markets. Momentum/positioning scores and volatility-premium comparisons are descriptive measurements of past option flow and past price movement — not investment advice, signals, forecasts, or guarantees. All trade structures are hypothetical. Every structure shown has a defined maximum loss; you can lose the entire max-loss amount. Options involve substantial risk and are not suitable for all investors.