QBTS Options Are Pricing a $1.52 Move by September 25 — The Chart Model Sees Less Than Half of It
QBTS options imply a $15.59–$18.63 range into the September 25 expiration, but the technical model targets just $17.50. With IV rank at 1/100 and options priced below what the stock has actually delivered, this is a week to own premium rather than sell it.
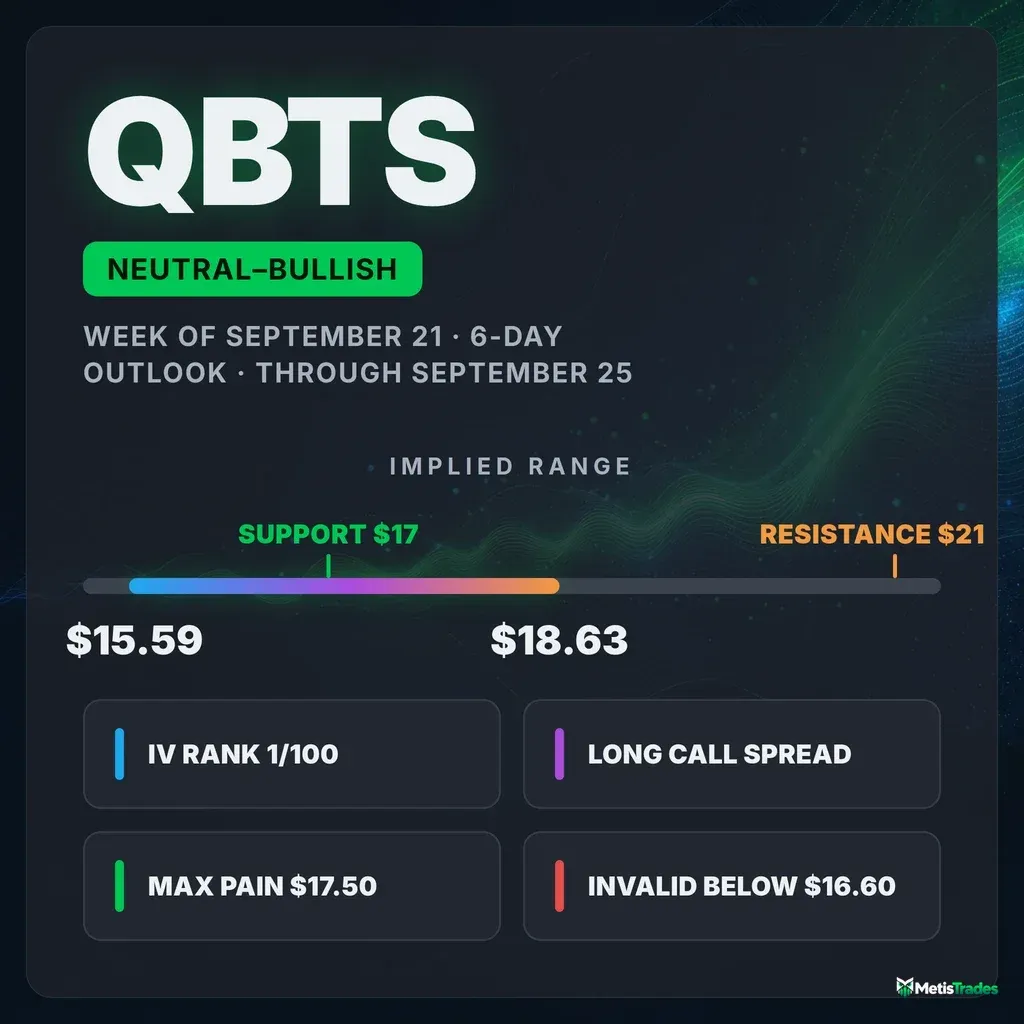
The options market implies a $15.59–$18.63 range into the September 25 expiration; here's what's driving the lean, where the walls sit, and three defined-risk ways to trade it.
Published Saturday, September 19, 2026 · Data as of Friday, September 18, 2026 close
Explore the live QBTS options data in the Detailed Options Analyzer →
Quick answer
| Item | Answer |
|---|---|
| Market bias | Slightly bullish |
| Options-implied range (into September 25) | $15.59 – $18.63 (±8.90%, or ±$1.52) |
| Major support | $17.00 (put wall, September 25 expiration) |
| Major resistance | $21.00 (call wall, September 25 expiration) |
| Max pain (September 25) | $17.50 |
| Dealer gamma regime (estimate) | Positive for the September 25 slice — hedging there tends to dampen moves; the all-expiration estimate is negative. A flip level could not be computed from today's chain. |
| Volatility condition | Falling — IV rank 1.1/100, ATM IV 69.3% · premium thin: options priced ~8 vol points below delivered movement |
| Technical check | Confirms (bullish, 3-day and 6-day models) |
| Best-fitting strategy | Long call spread (debit), September 25 $17.50/$19.00 |
| Analysis invalidated if | QBTS closes below $16.60 |
1 · What matters today
QBTS closed Friday, September 18 at $17.11, and the options market is pricing a move of about $1.52 in either direction over the next six days — a $15.59 to $18.63 range into the September 25 expiration. That figure comes from what at-the-money straddles cost, which is the market's own estimate of how far the stock travels by that Friday.
Our read of the flow leans slightly bullish: call-side sweeps dominated Friday's unusual activity, 25-delta calls are running richer than puts by an unusual margin, and short-dated positioning has been building on the call side across the 7–30 day part of the curve. The one number that changes the picture is $17.00 — the strike holding the most put open interest for September 25, effectively the floor traders have built. A close below $16.60 kills the read entirely. Both technical models we checked also point higher, at $17.50–$17.55, which sits comfortably inside the options-implied range.
2 · What the options market is pricing
What changed this week
Price went nowhere and positioning went two directions at once. QBTS is up 1.85% over the last five trading days but down 8.99% over twenty, and Friday's session was a rejection in miniature: the stock gapped up 2.2% to open at $18.08 against the prior $17.69 close, then finished at $17.11.
Underneath that, the put/call open interest ratio — how many put contracts are held open for every call — climbed from 0.65 to 0.79 over five sessions, a 21% jump, against a 14-day average of 0.72. Traders added downside protection at a rapid clip, and that pace of put building is well outside this stock's own recent norm. Yet the day's volume ran call-heavy: put volume was just 0.45 times call volume, below the 7-day average of 0.50, and four call contracts cleared the unusual-volume bar versus zero puts. Hedges are being stacked in the open-interest book while the day-to-day trading is chasing calls.
The single largest non-expired open-interest build was the September 25 $19 calls, which added 1,172 contracts to reach 1,941 — a strike a full $1.89 above spot with only six days to run. (Into Friday's expiration, by contrast, the $17 calls shed 1,711 contracts as they settled — history now, not a live level.) Implied volatility barely moved on the day (+0.18%) and is down 27.4% over thirty sessions.
The multi-horizon trend read is openly divergent, and that tension deserves naming: the past week's +1.8% pop runs against a stock down 9.0% over the past month and 19.1% over the past ten weeks. Near-term flow and the bigger trend are pointing different ways, which is an argument for short-dated directional structures and quick profit-taking rather than sitting in anything for weeks.
Expected move
Into September 25, the options market is pricing roughly ±$1.52, or ±8.90% — a $15.59 to $18.63 band around Friday's $17.11 close. Here is how that scales out across the ladder:
| Expiration | Implied move | Range around $17.11 |
|---|---|---|
| September 25 (7 DTE) | ±8.90% | $15.59 – $18.63 |
| October 2 (14 DTE) | ±12.74% | $14.93 – $19.29 |
| October 16 (28 DTE) | ±19.11% | $13.84 – $20.38 |
The ladder scales almost exactly with the square root of time — no bump, no kink, no single date the chain is bracing for. Whatever the market expects from QBTS over the next month, it doesn't expect it on a particular day.
Volatility
At-the-money implied volatility — the market's estimate of how much QBTS will move, baked into option prices — sits at 69.3%. That is a big absolute number and a tiny relative one: IV rank is 1.1 out of 100, meaning today's implied volatility is cheaper than roughly 99% of the past year's readings. The 52-week context is brutal for anyone who sold premium a year ago; today's level is nearly at the floor of that range. IV is flat on the day (+0.18%), down 0.57% over five sessions, and down 27.4% over thirty, and it sits below both its 30-day average of 75.9% and its 90-day average of 93.7%. The front-month read is unavailable today — Friday was an expiration day, so the near-tenor slope can't be interpolated from a same-day-expiring contract.
Realized movement has cooled too, though "cooled" is relative for this name: 20-day realized volatility is 77.5%, which is actually low versus this stock's own recent history, and the 5-day-versus-20-day ratio at 0.96 says the last week has been marginally calmer than the month around it.
Premium rich or cheap? The volatility risk premium — the gap between how much movement options are priced for and how much QBTS has actually delivered — is negative 8.2 vol points. Option sellers have been collecting less than the stock's realized movement has cost them. That gap sits at the 53rd percentile versus this stock's own recent readings, so it is middling by QBTS standards rather than extreme, but the direction is unambiguous, and it has widened over the past two sessions (from about −1 vol point midweek to −8 now) as implied volatility stayed pinned while realized movement held up. Combine it with an IV rank of 1.1 and the verdict is straightforward: this is a week to own premium rather than collect it. Anyone writing naked options here is selling something that hasn't been rich in a while.
Skew and sentiment
Normally, puts and calls the same distance from the stock price don't cost the same — puts are usually pricier, because traders pay up for crash protection. QBTS has the opposite problem. The 25-delta put trades at 66.0% implied volatility while the 25-delta call trades at 73.3%: calls are 7.3 vol points more expensive than puts, against a 60-day median of 3.7 points. Upside is where the demand is, and that stretch is meaningfully wider than this name's own recent norm.
Sentiment across the curve backs it up. Short-dated 0–7 day positioning reads only mildly positive, but the 7–30 day bucket scores +39 and the 30–60 day bucket +53, with call open interest building and call-side flow dominating at every tenor beyond the front week. The one-phrase summary of the curve is "bullish recovery" — the conviction is being built further out, not in the front week.
Against that, the put/call open-interest drift is the loudest dissenting voice in the data, and it is an unusually loud one by this stock's standards. The honest translation: traders are buying upside calls with their trading capital and buying puts with their hedging capital, and the two flows are showing up in different parts of the book.
The key levels map
| Level | Price | Why it matters |
|---|---|---|
| 200-day moving average | $21.28 | 19.6% above spot — the long-term trend line, nowhere near in play this week |
| Call wall (September 25) | $21.00 | Heaviest call open interest for the target expiration (2,859 contracts) — the ceiling the week's own book has built |
| Swing resistance / 100-day MA | $20.93 | A price-structure level and a moving average sitting on the same number |
| Whole-chain heaviest strike | $20.00 | 34,431 calls and 28,170 puts across all expirations, and the largest gamma strike in the chain — note this differs from the September 25 call wall at $21 |
| Top of the 6-day implied range | $18.63 | The upper rail of what options are pricing by September 25 |
| Resistance cluster / 50-day MA | $18.02 – $18.46 | Swing highs stacked around the declining 50-day average at $18.33 |
| Nearest swing resistance | $17.74 | First real overhead supply; the technical models put resistance at $17.80–$17.85 |
| Max pain (September 25) | $17.50 | Where the most option value would expire worthless — expirations sometimes gravitate toward it |
| 20-day moving average | $17.35 | Spot is 1.39% below it — the nearest mean-reversion marker |
| Spot / Friday close | $17.11 | The anchor for everything above |
| Put wall (September 25) | $17.00 | Heaviest put open interest for the target expiration (1,992 contracts) — the floor traders have built, and the chain's second-largest gamma strike |
| Technical support / invalidation | $16.60 | Both chart models flag a close below here as the level that kills the bounce |
| Swing support | $16.09 | The last clustered pivot low in the price structure (heuristic level, not a guaranteed reaction zone) |
| Bottom of the 6-day implied range | $15.59 | The lower rail of what options are pricing by September 25 |
Positioning and unusual flow
Market makers hedge the options they've sold, and the direction of that hedging depends on how their book is positioned. One rough estimate built from the September 25 chain alone puts dealers in positive gamma for that expiration, meaning their hedging there would tend to dampen moves rather than amplify them — a mild pinning force into Friday. The same estimate run across all expirations comes out negative, which is the amplifying regime. The two disagree, and for a six-day trade the September 25 slice is the one that applies. Treat both as estimates: they are derived from raw gamma and open interest under an assumed dealer convention, not from observed dealer inventory, and today's chain didn't produce a computable flip level.
Three pieces of flow stood out among live contracts:
- October 23 $21 calls — 3,008 contracts traded against just 188 held open, roughly $102,000 of premium and the single largest dollar-premium print in the chain. A far-out-of-the-money call bought sixteen times over its own open interest is a lottery ticket, not a hedge.
- October 2 $19 calls — 2,023 contracts on 765 open, about $72,000 of premium. Same shape, closer expiration.
- September 25 $20 calls — 1,474 contracts traded and open interest up 537 to 1,264, the heaviest peer-relative volume reading in the target expiration. That's fresh positioning in the week we're covering, and it sits a dollar below the week's call wall.
On the other side, the September 25 $17 puts added 448 contracts of open interest to 1,992 — the strike that is the put wall got reinforced on Friday. Both sides of the book are being built at once.
3 · Technical check
The 3-day model targets $17.55 by September 22 with a projected range of $16.70 to $17.95. The 6-day model targets $17.50 by September 25 with a projected range of $16.55 to $17.90. Both are bullish, and both targets sit well inside the options-implied $15.59–$18.63 band — this is a confirmation, not a divergence, on direction.
The supporting reads are consistent across both horizons: the short EMA has crossed back above the longer one after Friday's bounce off $16.59, and the directional indicators flipped positive (+DI 26.6 versus −DI 24.1) for the first time in several sessions. But ADX at 23.3 and falling from a peak above 31 says trend strength is draining, not building — this reads as a downtrend losing steam rather than an uptrend beginning. Both write-ups are explicit that price remains well below a declining 50-day ($18.33) and 200-day ($21.28) average, which caps how far the bounce can be expected to run. The dominant scenario in each report invalidates on a close back below $16.60.
Model vs. Market: The options market implies $15.59–$18.63 into September 25; the 6-day technical model targets $17.50 with a $16.55–$17.90 band. The chart model is claiming barely half the range the options are pricing — agreement on direction, sharp disagreement on magnitude. If the stock is still stuck between $16.60 and $17.90 by midweek, the options were overpriced for the move and the chart model was right to shrink the band.
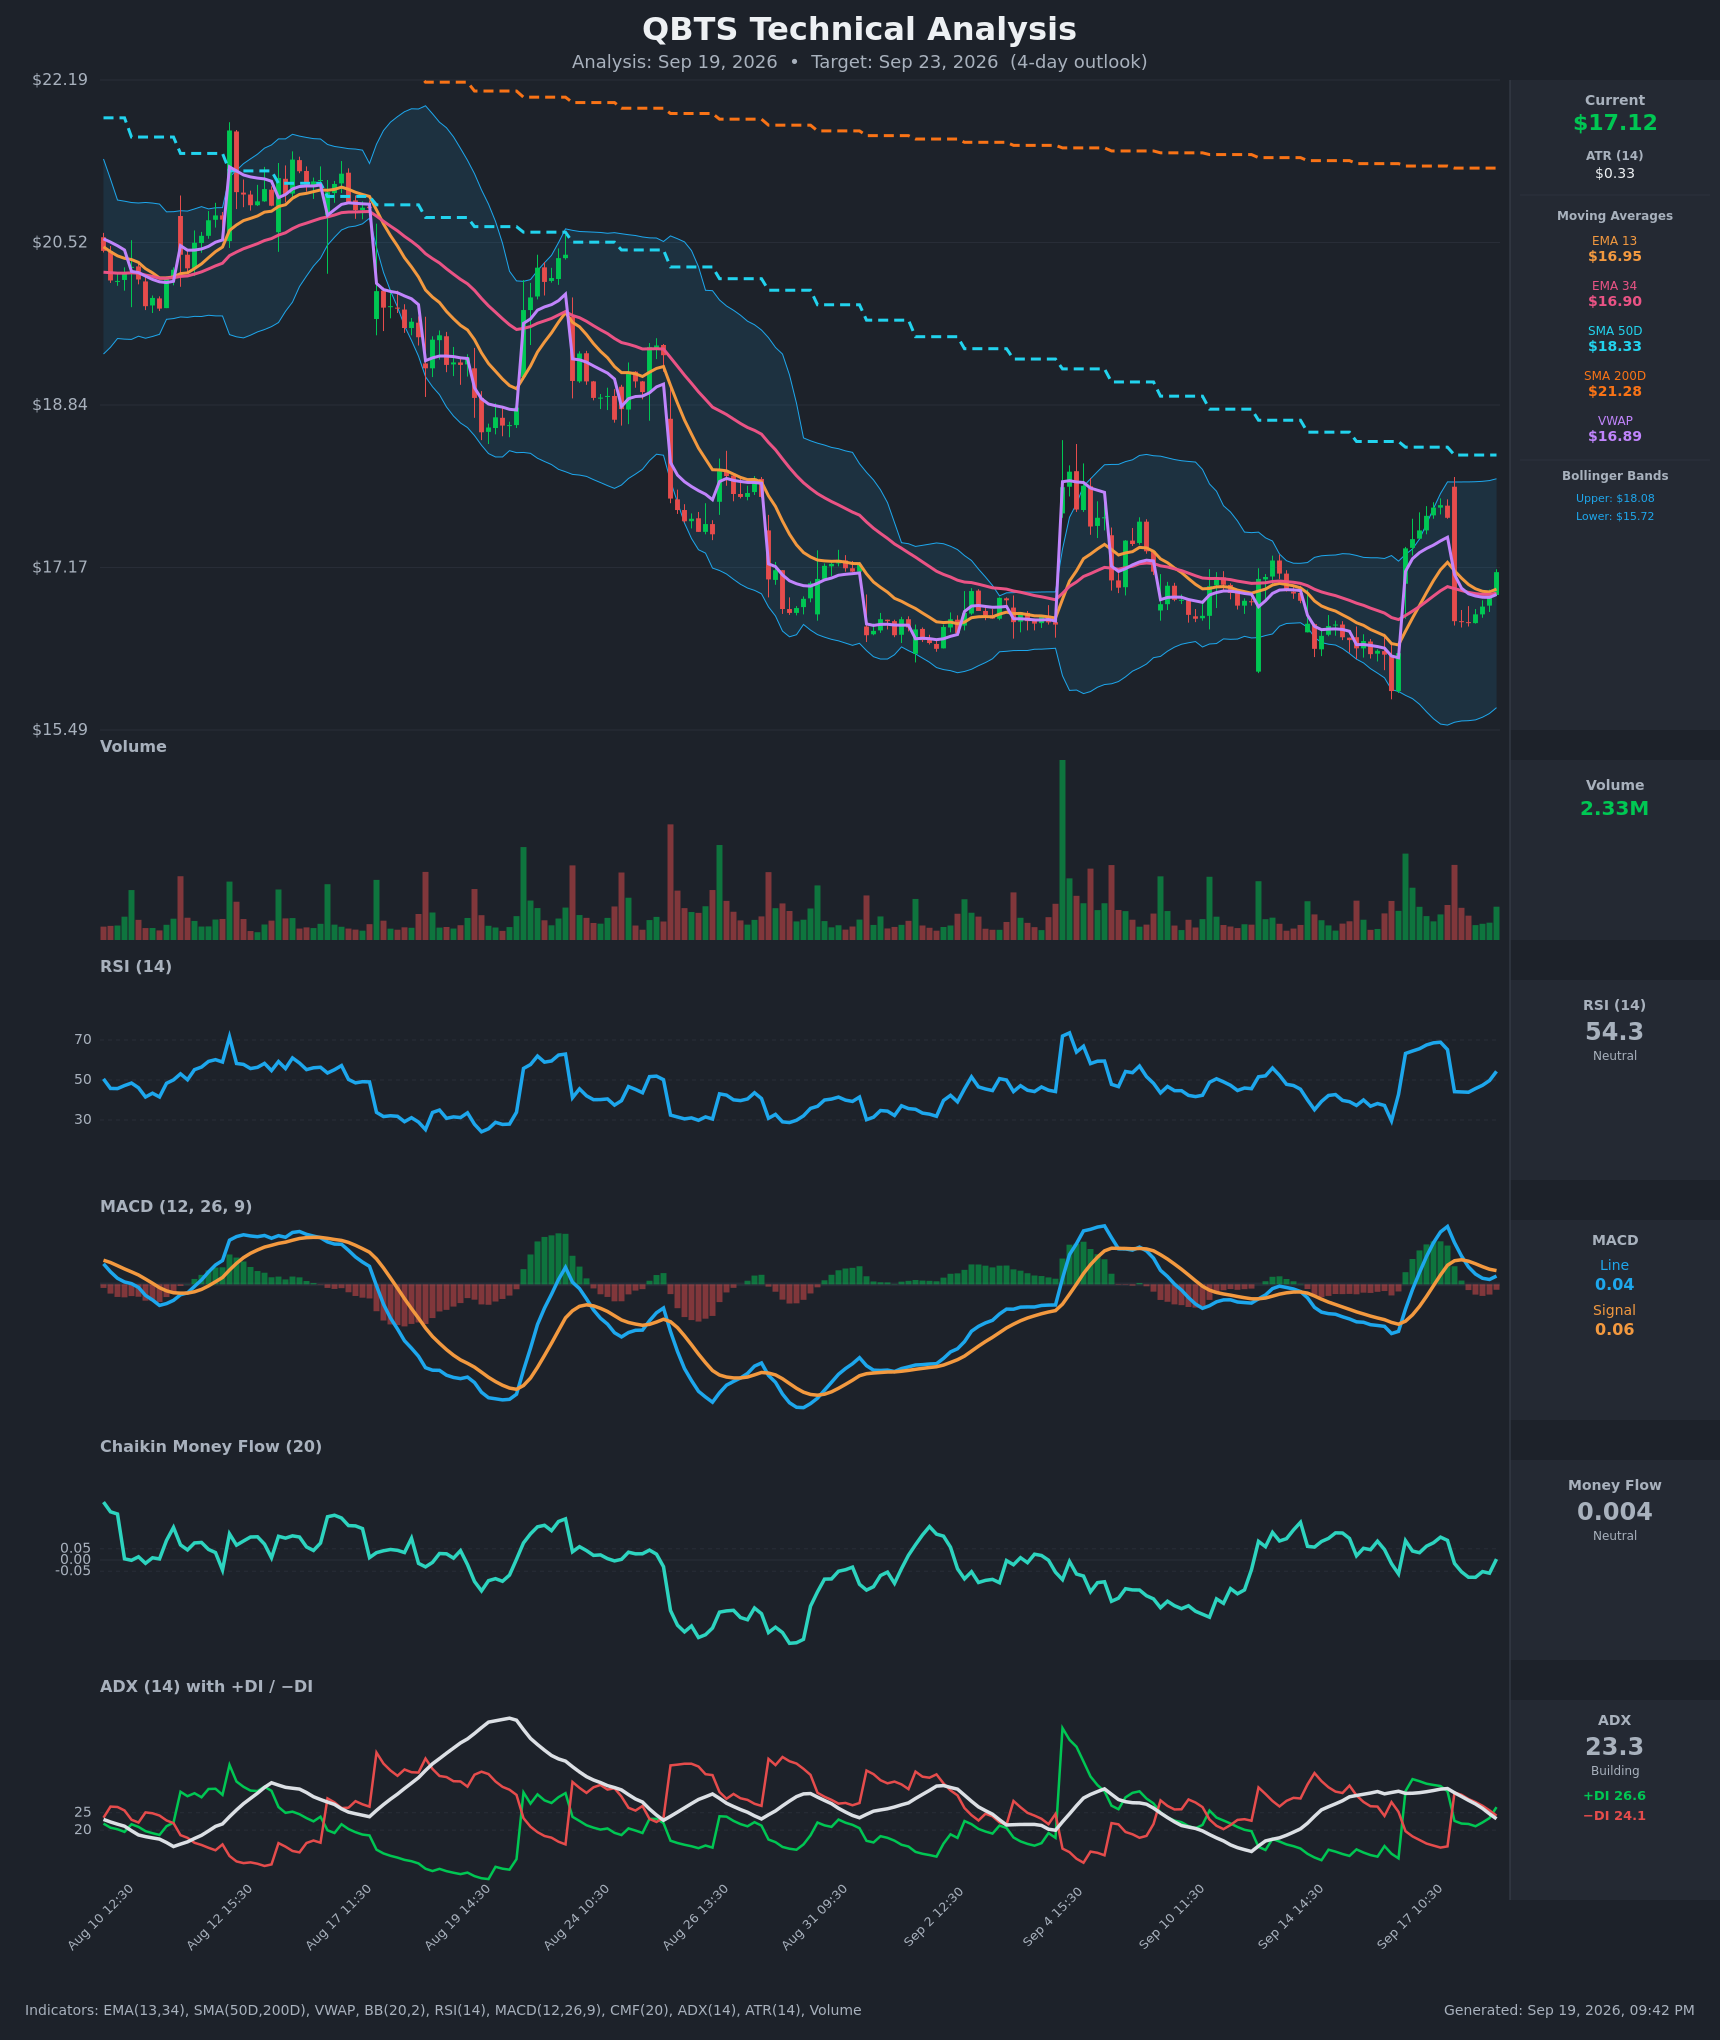
How the technicals shaped the strikes below: the call spread's short leg is placed at $19, above the $17.80–$18.05 zone both models name as the realistic upside target, so the structure still pays in full if the chart model is right and the options market is too generous. The condor's short call sits at the same $19.
Full technical write-ups: 3-day report → · 6-day report →
4 · Three ways the week can go
If QBTS pushes above the call wall ($21.00): this would take a 23% move in six days — roughly two and a half times what options are pricing, so treat it as the tail. The more relevant overhead is the $18.02–$18.46 resistance cluster and the declining 50-day average at $18.33, followed by the whole chain's heaviest strike at $20.00, where 34,431 calls and 28,170 puts sit together. That $20 level is where positioning gets genuinely dense; $18 is where the week's price structure gets difficult.
If QBTS drifts between the walls: the base case. Max pain for September 25 sits at $17.50, just 39 cents above Friday's close, and the dealer-gamma estimate for that expiration is positive — hedging in that slice would tend to cushion moves in both directions rather than accelerate them. A drift from $17.11 up toward $17.50 with decaying implied volatility is exactly what the max-pain and pinning dynamics describe, and it also happens to be the chart model's target.
If QBTS breaks below the put wall ($17.00): the floor traders built is only 11 cents away, so a break isn't exotic. Below it, structure thins fast: $16.60 is where both chart models call the bounce dead, and the next clustered pivot is $16.09. The all-expiration dealer-gamma estimate is negative, which is the regime where hedging amplifies selling rather than cushioning it — and while the September 25 slice reads the other way, that cushion evaporates as the week's contracts decay into expiration. The lower implied rail at $15.59 is the market's own worst-case marker for the window.
5 · Three defined-risk structures
Prices are end-of-day midpoints as of 2026-09-18. All structures are hypothetical. Verify live prices before trading — these will be stale by the open.
Premium is thin, not rich — options are priced below what this stock has actually been delivering, and IV rank is 1.1/100. That puts long-premium (debit) structures first and means every credit structure here carries a warning label.
If you lean bullish: September 25 $17.50/$19.00 call debit spread
- Trade: Buy the September 25 $17.50 call ($0.44 mid), sell the September 25 $19.00 call ($0.115 mid)
- Debit: $0.33 · Max profit: $1.17 per spread ($117) · Max loss: $33 · Break-even: $17.83
- Why it fits: You are buying the cheapest implied volatility this stock has shown in a year, in a week when options are priced roughly 8 vol points below the stock's delivered movement — exactly when a debit spread's cost basis is favorable. The short leg at $19 is above the $17.80–$18.05 zone both chart models name as the realistic ceiling, so the spread can reach full value without the stock doing anything the technicals say it can't.
- Makes sense only if: you believe the bounce off $16.59 has another leg and can tolerate the whole debit going to zero in six days.
- Invalidated if: QBTS closes below $16.60.
- Managing it: the short-term trend is fighting a stock still down 19% over ten weeks, so take profits early rather than holding for max value — close at roughly 60–70% of maximum, or by Wednesday, September 23, whichever comes first. Gamma risk into a Friday expiration on an 8.9%-implied-move name is unkind to indecision.
- Liquidity note: the $17.50 calls quoted 2¢ wide (about 4.6% of mid) — easy fills. The $19 calls quoted 3¢ wide on an 11.5¢ mid, roughly 26%, which is wide; work the spread as a package with a limit order rather than legging in.
- Analyze this position →
If you expect the range to hold: September 25 $15.50/$16.50/$19.00/$20.00 iron condor
- Trade: Sell the $16.50 put ($0.32) / buy the $15.50 put ($0.10); sell the $19.00 call ($0.115) / buy the $20.00 call ($0.055) — all September 25
- Credit: $0.28 · Max profit: $28 · Max loss: $72 · Break-evens: $16.22 and $19.28
- Why it fits: you collect the credit up front and keep it if QBTS finishes between the break-evens. The body is centered around $17.75 — above spot, toward the $17.50 max-pain strike — which shades it with the same mild bullish tilt the flow shows, and the short strikes straddle the pinning zone the September 25 gamma estimate describes.
- Health warning: you're selling premium that hasn't been rich lately. With IV rank at 1.1/100 and options priced below delivered movement, this structure is fighting the volatility backdrop, and $28 of credit against $72 of risk leaves no room for a second chance.
- Makes sense only if: you specifically believe the pin holds and implied volatility falls further from an already historic low.
- Invalidated if: QBTS closes below $16.60 or above $18.63 (the upper implied rail) — either one puts a short strike in play well before expiration.
- Managing it: close at roughly 50% of max credit; exit the whole position by Wednesday, September 23 regardless; if either short strike trades through, close rather than roll.
- Liquidity note: the $16.50 puts quoted 4¢ wide on a 32¢ mid (12.5%) and the $19 calls 3¢ on 11.5¢ (26%) — all four legs are wider than ideal, so expect meaningful slippage on a four-leg package. This is the least liquid of the three structures.
- Analyze this position →
If you lean bearish: September 25 $17.00/$16.00 put debit spread
- Trade: Buy the September 25 $17.00 put ($0.545 mid), sell the September 25 $16.00 put ($0.185 mid)
- Debit: $0.36 · Max profit: $64 · Max loss: $36 · Break-even: $16.64
- Why it fits: this is the trade that expresses the dissenting signal in the data — put open interest building at a pace well outside this stock's own norm, and a stock that has faded a gap-up open twice in three sessions. The long strike sits right at the put wall, so the spread starts paying the moment the floor breaks, and cheap implied volatility makes the long leg inexpensive relative to what the stock has actually been delivering.
- Makes sense only if: you read the 20-day (−9.0%) and 50-day (−19.1%) price trends as the dominant signal and the week's call buying as noise.
- Invalidated if: QBTS closes above $17.90 (the top of both chart models' projected ranges) — at that point the bounce has won.
- Managing it: this pays out fastest on a fast break; if $16.60 doesn't give way within the first three sessions, take whatever is left rather than paying theta into Friday.
- Liquidity note: the $17 puts quoted 9¢ wide on a 54.5¢ mid (about 16.5%) and the $16 puts 3¢ on 18.5¢ (about 16%) — both wider than the 5% comfort bar, so use a limit on the package and accept that a market order will leak edge.
- Analyze this position →
If none of these: no trade
There is a real case for standing aside. The directional edge here is genuine but modest — the flow leans bullish while the stock's own trend over the past month and the past ten weeks leans hard the other way, and the two loudest signals in the chain (call-side sweeps and an unusual build in put open interest) contradict each other. Meanwhile the bid-ask spreads on the September 25 weeklies run 12–26% on several of the strikes above, which means a meaningful chunk of any small edge disappears into the fills. If you can't work a limit order patiently, the spreads alone can turn a correct call into a flat outcome. And if your instinct was to sell premium into an 8.9% implied move, remember that premium is currently priced below what this stock has been delivering — the compensation isn't there.
6 · Quick FAQ
What is QBTS's expected move this week? About ±$1.52, or ±8.90%, into the September 25 expiration — a $15.59 to $18.63 range around the $17.11 close, per the options market's straddle pricing as of Friday, September 18.
Is QBTS expected to go up or down over the next six days? Options positioning as of September 18 leans slightly bullish — call-side sweeps dominated, and 25-delta calls are running 7.3 vol points richer than puts against a 3.7-point norm — but that is a read of what traders have done, not a forecast. The actionable map is the $15.59–$18.63 range with $17.00 as the floor and $21.00 as the week's call wall.
Are QBTS options expensive right now? No, on both lenses. IV rank of 1.1/100 says option prices are lower than about 99% of the past year's readings, and on top of that they're running roughly 8 vol points below the movement QBTS has actually delivered — a gap sitting near the middle of this stock's own recent readings. The verdict favors owning premium over selling it.
Where is QBTS's biggest options support and resistance? For the September 25 expiration, the put wall is $17.00 (1,992 contracts held open) and the call wall is $21.00 (2,859 contracts). Across the whole chain combined, the heaviest strike on both sides is $20.00 — so the week's own book and the aggregate book do not agree, and for a six-day trade the September 25 numbers are the ones that matter.
What invalidates this week's read? A close below $16.60.
Methodology & disclosures. Data: end-of-day options-chain snapshot for QBTS, 2026-09-18, generated 2026-09-19T21:42:11.205Z. Prices shown are midpoints and will differ from live markets. Momentum/positioning scores and volatility-premium comparisons are descriptive measurements of past option flow and past price movement — not investment advice, signals, forecasts, or guarantees. All trade structures are hypothetical. Every structure shown has a defined maximum loss; you can lose the entire max-loss amount. Options involve substantial risk and are not suitable for all investors.