QCOM Options Are Pricing an $11 Move Through Friday — And Premium Is Unusually Rich
Options positioning in Qualcomm turned firmly call-heavy into the September 18 expiration, with the chain implying a $170.78–$193.16 range. Here's the level map, the premium picture, and three defined-risk ways to trade it.

The options market implies a $170.78–$193.16 range into the September 18 expiration; here's what's driving it and three defined-risk ways to trade it.
Published Sunday, September 13, 2026 · Data as of the 2026-09-11 close
Explore the live QCOM options data in the Detailed Options Analyzer →
Quick answer
| Item | Answer |
|---|---|
| Market bias | Bullish |
| Options-implied range (into Sep 18) | $170.78 – $193.16 (±6.15%, or about ±$11.19) |
| Spot (chain snapshot) | $181.97 |
| Major support | $130.00 — the Sep 18 put wall, far out of play; the whole chain's heaviest put strike is $160.00, and the nearest price-structure support is $178.65 |
| Major resistance | $300.00 — the Sep 18 call wall, a leftover far-strike pile; the whole chain's heaviest call strike is $200.00 |
| Max pain (Sep 18) | $170.00 |
| Dealer gamma regime (estimate) | Positive — market-maker hedging tends to dampen moves; flip level ≈ $180.00 |
| Volatility condition | Falling day-over-day, higher on the week — IV rank 28.6/100 · premium rich: options priced about 18 vol points above delivered movement |
| Technical check | Confirms (bullish, 3-day and 5-day chart models) |
| Best-fitting strategy | Sep 18 $175/$170 short put spread |
| Analysis invalidated if | QCOM closes below $178.00 |
1 · What matters today
Qualcomm closed at $181.97 after an 8.0% run over five sessions, and the options chain is leaning the same way. Our read of options flow is bullish across every input we track: call-tilted volume, puts being closed rather than added, and short-dated sentiment that is positive at every expiration bucket. The market is pricing a move of roughly $11.19 up or down into the September 18 expiration — a $170.78 to $193.16 range — derived from what at-the-money straddles cost.
The complication is price: at 45.0% implied volatility, options are priced about 18 vol points above the movement QCOM has actually delivered over the past month. That is rich premium, and it argues for collecting it rather than buying it. Two independent chart models agree on direction with targets near $184.50–$184.75. The level that changes the picture is $178.00 — a close below it puts price under the breakout shelf and under the estimated gamma flip at $180.00.
2 · What the options market is pricing
What changed this week
Money moved to the call side quickly. Put/call open interest — how many put contracts are held open for every call — fell from 0.90 to 0.71 over five sessions; the 14-day average is 0.89, so this is a genuine thinning of downside positioning rather than noise. Put/call volume printed 0.27 against a 7-day average of 0.31 and a 14-day average of 0.40: for every 100 call contracts traded, only 27 puts changed hands. Total option volume ran 2.0× its 20-day average, so the tilt came on real participation.
Implied volatility — the market's estimate of how much QCOM will move, baked into option prices — rose 14.0% over five days to 45.0%, even as it sits 21.1% below where it was 30 days ago and far under the 90-day average of 65.3%. In other words, the rally pulled option prices up off a low base rather than into an expensive one.
Among contracts that are still tradeable, the biggest fresh positioning went into the September 18 $182.50 calls (open interest up 773 to 1,109) and the September 18 $200 calls (up 757 to 9,298). Into Friday's settled expiration, the $200 calls had added 2,011 contracts — that flow is history now, but it tells you where last week's speculation was aimed. Our short-, medium- and long-term trend reads agree in direction here: price is up 8.0% over the past week and 10.4% over the past month, with the ~50-day read flat at +0.3% — near-term strength inside a bigger sideways year, not a fight between horizons.
Expected move
Into September 18, the chain prices a ±6.15% move — about $11.19 in either direction from $181.97.
| Expiration | Implied move | Range around $181.97 |
|---|---|---|
| Friday, September 18 (7 DTE) | ±6.15% | $170.78 – $193.16 |
| Friday, September 25 (14 DTE) | ±8.68% | $166.18 – $197.77 |
| Friday, October 16 (35 DTE) | ±14.03% | $156.44 – $207.50 |
The ladder scales almost exactly with the square root of time — 44.4% at-the-money IV at the front rung, 45.3% at the 35-day rung — so there is no event bump distorting any single expiration. Whatever the chain is bracing for, it is spread evenly across the next five weeks.
Volatility
At-the-money IV is 45.0%. IV rank is 28.6/100 — where today's IV sits versus the past year, meaning option prices are cheaper than roughly 71% of the past year's readings. But IV percentile is 67, meaning today's level is above where IV actually spent two-thirds of the past year; the gap between the two is the signature of a stock whose volatility spiked hard once and has been grinding lower since. IV fell 5.4% on the day, rose 14.0% over five days, and sits 2% under its 30-day average of 45.9%. The front-month read is unavailable today — the snapshot landed on an expiration day, which is when that particular calculation can't be interpolated.
One "vs its own norm" observation worth flagging: 20-day realized volatility — how much QCOM has actually been moving — is 27.0%, unusually low compared against this stock's own recent history. The 5-day/20-day realized ratio is about average, so the stock is not accelerating; it has simply been calmer than usual while option prices have not.
Premium rich or cheap. The volatility risk premium — the gap between how much movement options are priced for and how much QCOM has actually delivered — is currently about 18 vol points (45.0% implied against 27.0% delivered). When that gap is positive, option sellers have been collecting more than realized movement cost them. At the 88th percentile, today's gap is richer than roughly 88% of this stock's own recent readings. The path there was fast: two and a half weeks ago the gap was slightly negative (options priced below delivered movement), and it has climbed steadily since as IV rose and realized volatility kept fading. That combination — a modest IV rank of 28.6 but an 88th-percentile premium over delivered movement — favors collecting premium this week rather than owning it, and it shapes which structures lead below.
Skew and sentiment
Skew is the fact that puts and calls the same distance from the stock price don't cost the same. Here they don't — but in the unusual direction. The 25-delta put trades at 43.0% implied volatility while the 25-delta call trades at 46.3%: calls are running 3.3 vol points richer than equidistant puts, against a 60-day norm of just 0.6 vol points for this name. Traders are paying up for upside exposure, not crash protection, and that reading is stretched well beyond this stock's own recent history.
Sentiment in short-dated options confirms it. Our directional read scores the 0–7 day bucket at +36 and the 7–30 day bucket at +27, with every expiration bucket positive — a "broadly bullish" regime with no single tenor carrying it. The 7-day averages for those same buckets are +32 and +15, so the front end has been persistently call-leaning and the middle of the curve has joined it in the last few sessions.
One honest counterweight: on the peer-relative sweep screen, zero call contracts and three put contracts cleared the 95th-percentile volume bar today. That reading is about as put-tilted as it gets for this name versus its own norm, and it is the single input in our composite pointing the other way. It is a small tell inside a much larger call-side flow, but it is there.
The key levels map
| Level | Price | Why it matters |
|---|---|---|
| Call wall, Sep 18 expiration | $300.00 | 10,242 calls open — a leftover far-strike pile, not a live ceiling for a 7-day move |
| Call wall, whole chain | $200.00 | 43,009 calls open across all expirations, 9,298 at Sep 18 alone — the real overhead cluster |
| Upper rail, Sep 18 implied range | $193.16 | One standard deviation up, per straddle pricing |
| Swing resistance | $190.56 | Heuristic swing-pivot cluster from the daily price feed |
| Heavy near-dated call strike | $190.00 | 4,297 contracts open at Sep 18; 6,727 traded Friday |
| Chart resistance / 100-day average | $186.10 / $185.13 | Upper Bollinger Band per the chart model; price is 1.7% below its 100-day average |
| Spot | $181.97 | Chain-snapshot close |
| Largest gamma strike / gamma flip (estimate) | $180.00 | Biggest total gamma-weighted open interest chain-wide; one rough estimate puts the dealer-hedging flip here |
| Chart support / swing support | $178.00 / $178.65 | Breakout base per the 5-day chart model; nearest swing-pivot support |
| Heavy near-dated strike | $175.00 | 3,104 puts and 4,786 calls open at Sep 18 — the densest strike beneath spot |
| Swing supports | $172.12 / $170.13 | Prior pivot cluster from the daily feed |
| Lower rail, Sep 18 implied range | $170.78 | One standard deviation down |
| Max pain, Sep 18 | $170.00 | Where the most option value would expire worthless — expirations sometimes gravitate toward it |
| 50-day / 20-day averages | $168.60 / $166.85 | Price sits 7.9% and 9.1% above them |
| Put wall, whole chain | $160.00 | 17,533 puts open across all expirations; 4,360 at Sep 18 |
| Put wall, Sep 18 expiration | $130.00 | 4,924 puts open — deep-tail hedging, no practical floor this week |
Note the disagreement plainly: the September 18 expiration's own walls sit at $300 and $130, which are tail strikes rather than magnets. The whole chain's walls — $200 above, $160 below — are the levels with real positioning behind them, and they bracket this week's implied range comfortably on both sides.
Positioning and unusual flow
The dealer gamma estimate reads positive both for the whole chain and for the September 18 expiration specifically. Market makers hedge the options they've sold; in this estimated regime their hedging tends to dampen moves rather than amplify them, which is consistent with the orderly, shallow pullback the stock has traced since Thursday's high. Treat it as an estimate built on an assumed hedging convention, not as observed dealer inventory.
Three flow items stand out, all still tradeable:
- Sep 18 $185 calls — 5,373 contracts traded against 3,069 open, roughly $1.69 million of premium, the single largest dollar-premium line in the chain. That's the strike just above spot being bought and sold aggressively into a 7-day expiry.
- Sep 18 $190 calls — 6,727 contracts on 4,297 open, about $1.15 million of premium, with open interest up 402 on the day. More contracts traded than existed, and the pile grew.
- Sep 18 $197.5 calls — 516 contracts against just 35 open, turnover of nearly 15×. Small in dollars but a clean lottery-ticket footprint at a strike above the implied range's upper rail.
3 · Technical check
Both chart models point the same way as the options data. The 3-day model (target date September 16) is bullish with a target of $184.50 and a projected range of $177.80 to $187.20. The 5-day model (target date September 18, matching our expiration) is also bullish, targeting $184.75 within a projected $177.00 to $187.00. Both targets sit comfortably inside the options-implied $170.78–$193.16 band, so this is a Confirms read on direction and magnitude alike.
The decisive indicator reads: ADX at 36.8 with +DI (31.9) well above −DI (15.3) — a strong, established uptrend with buyers in control — set against a MACD histogram that has narrowed for three consecutive bars. Momentum is still positive but cooling, which is why both models frame the current pullback as a shallow flag rather than a reversal. The dominant scenario in each report invalidates on a close below $178.00–$178.50.
Model vs. Market: The options market implies $170.78–$193.16 into September 18; the 5-day technical model projects a far tighter $177.00–$187.00 with a $184.75 target. The chart model is effectively saying the options market is paying for a tail that won't show up — the same conclusion the volatility risk premium reaches from the other direction, and the reason every structure below is a credit trade rather than a debit one.
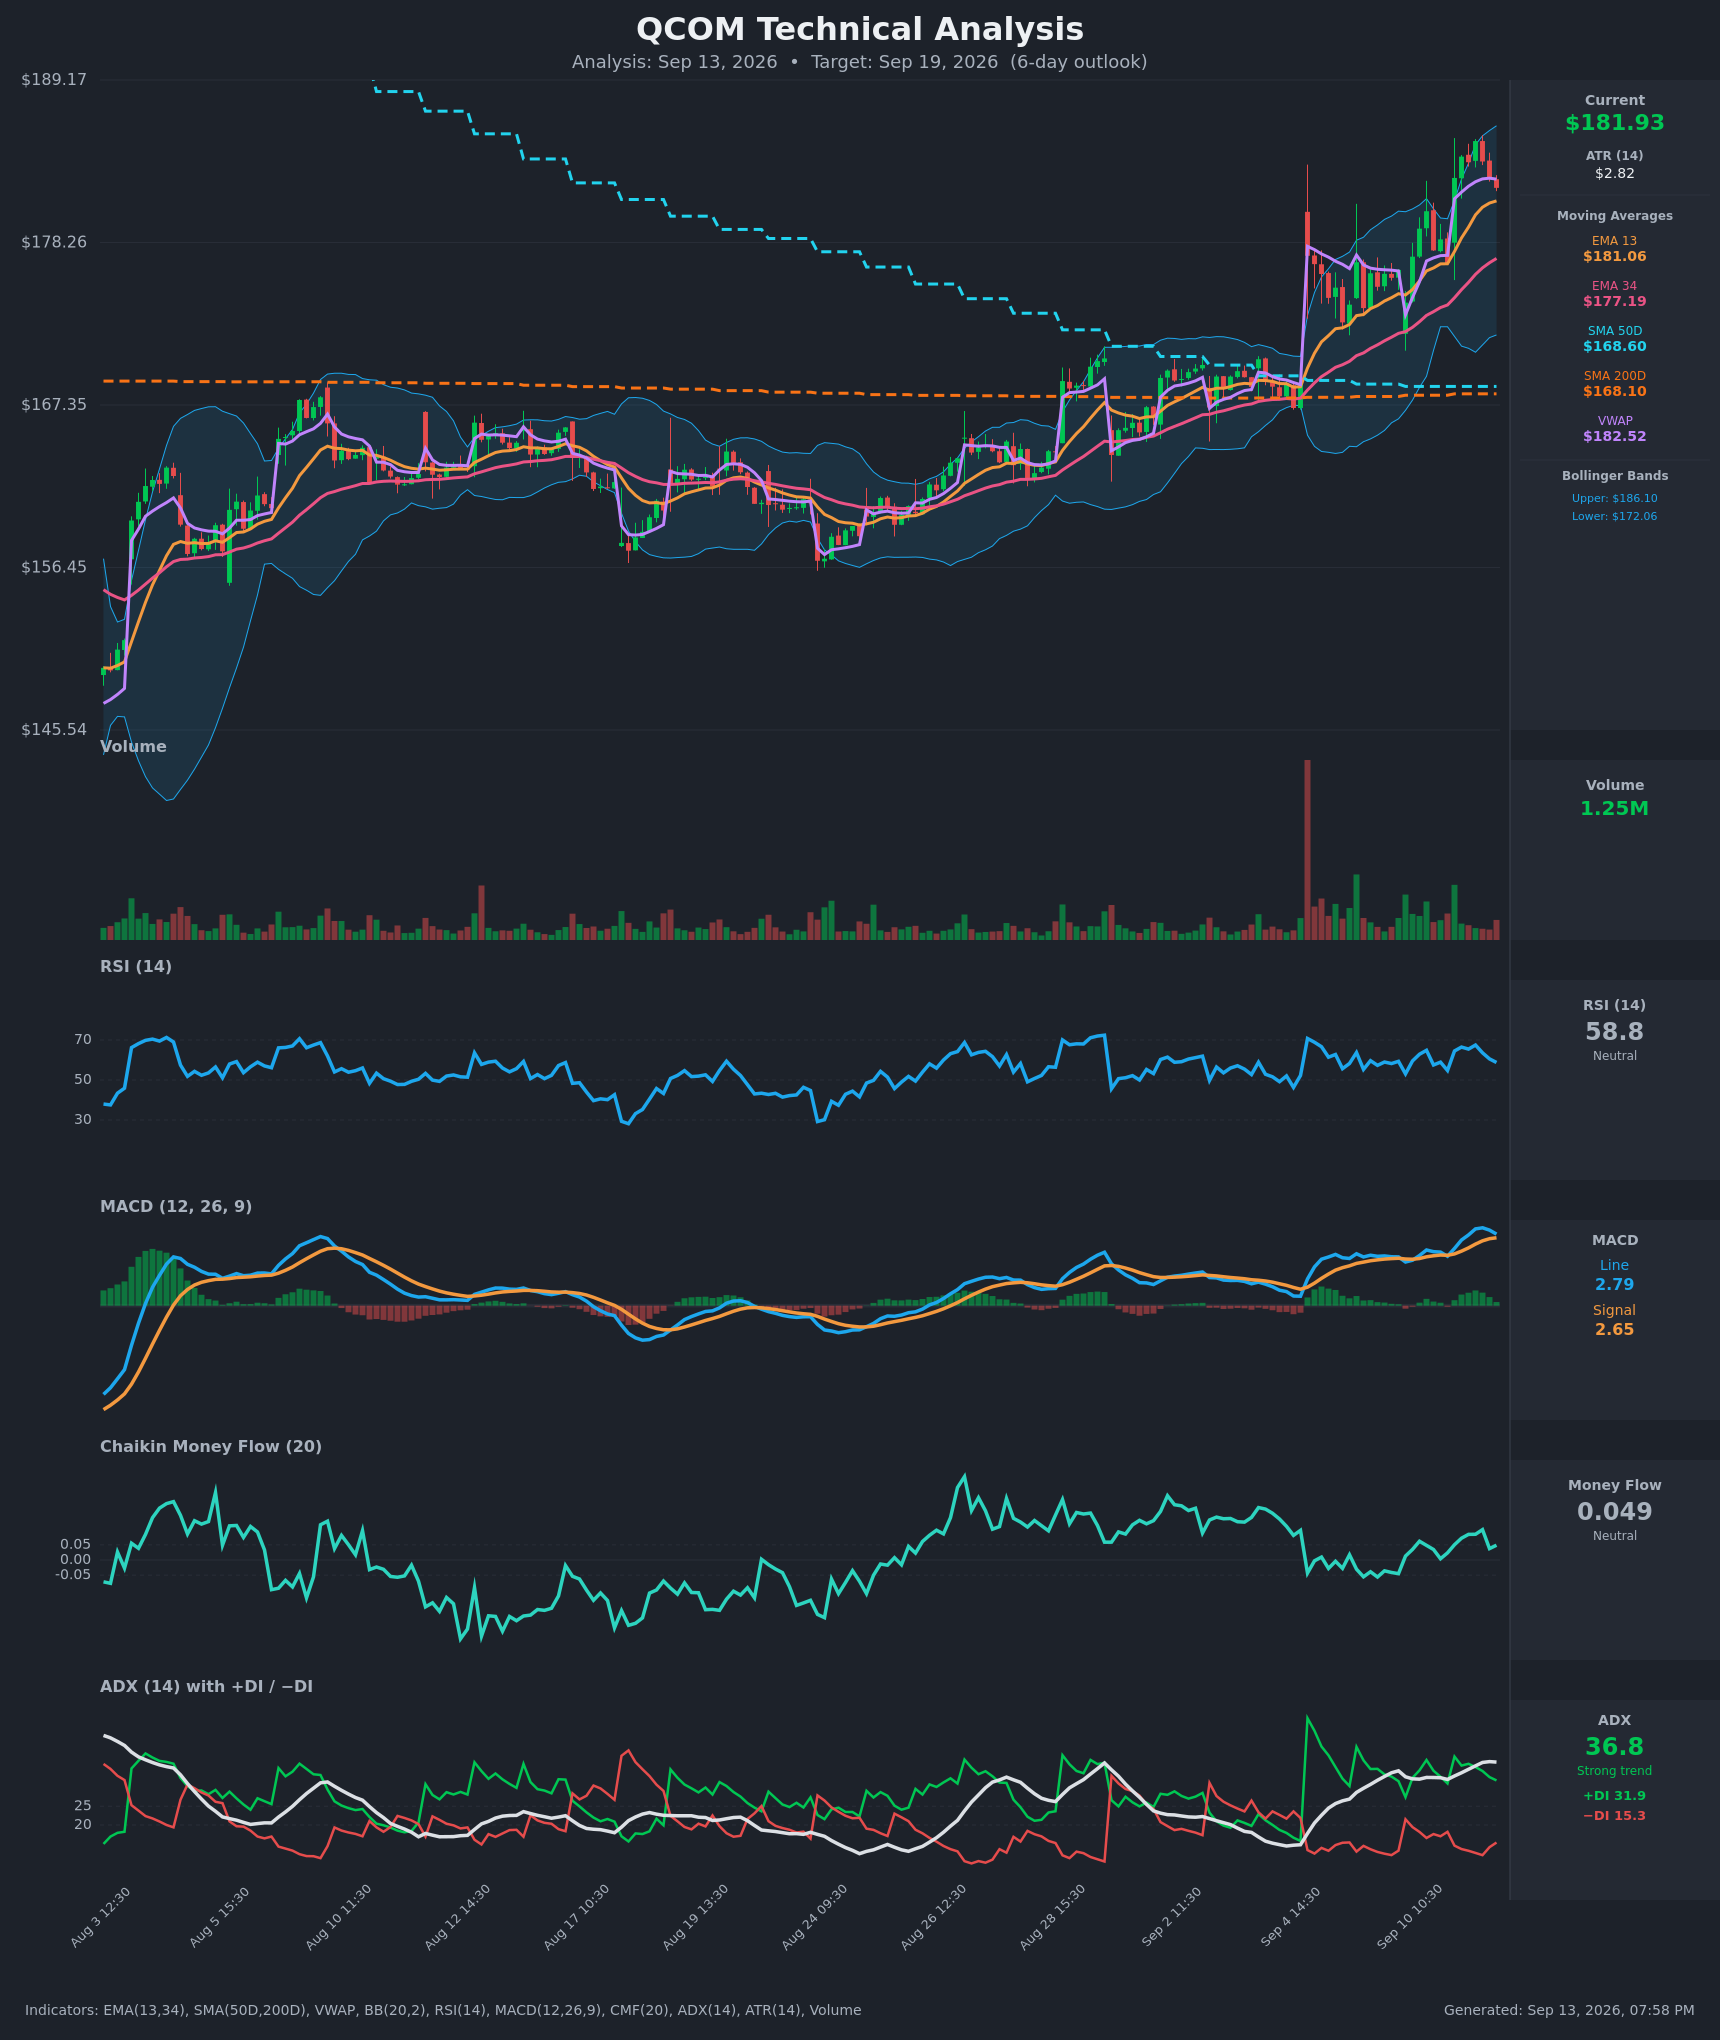
The TA did shade strike selection: the chart models' $186–187 ceiling is why the bearish structure below uses a $190 short call rather than something closer, and their $177–178 floor is why the bullish structure's short put sits at $175 instead of $172.50.
Full technical write-ups: 3-day report → · 5-day report →
4 · Three ways the next five days can go
If QCOM pushes through $190 toward the implied high ($193.16): the heaviest near-dated call positioning sits at $190 (4,297 contracts) and $195 (2,002), and the whole chain's biggest call pile is at $200. Strikes with that much open call interest tend to slow rallies as the hedging against them builds, so the path from $190 to $193 is usually grindier than the path to it. The September 18 wall at $300 is a tail strike and caps nothing.
If QCOM drifts between $178 and $190: this is the base case the positive gamma estimate supports — hedging flows that lean against moves in both directions, which is how a stock digests an 8% week. Max pain for September 18 sits at $170.00, below spot, so any expiration-week pull would be downward-tilted; but max pain is only a magnet when nothing stronger is operating, and an 8% five-day run with call-side skew qualifies as stronger.
If QCOM breaks below $180: that's the estimated gamma flip level, and below it one rough estimate suggests market-maker hedging shifts from cushioning selling to amplifying it. Spot sits about 1% above the flip — a fairly typical distance for this name — so it isn't far. Beneath that, the markers are $178.65 swing support, the $175.00 open-interest cluster, and then the implied floor at $170.78 with max pain at $170.00. The September 18 put wall at $130.00 offers nothing useful on the way down.
5 · Three defined-risk structures
Prices are end-of-day midpoints as of 2026-09-11. All structures are hypothetical. Verify live prices before trading — these will be stale by the open.
Because premium is rich versus delivered movement (88th percentile), credit structures lead here — all three below collect premium rather than pay it.
If you lean bullish: Sep 18 $175/$170 short put spread
- Trade: Sell the September 18 $175 put, buy the September 18 $170 put
- Credit: ~$0.95 ($1.76 mid on the $175 put, $0.80 mid on the $170 put) · Max profit: $95 · Max loss: $405 · Break-even: $174.05
- Why it fits: This is the bias expressed the way the premium picture wants it expressed — you are selling volatility that is priced 18 vol points above what the stock has been delivering, at a strike below the chart models' $177–178 floor. A credit spread means you collect cash up front and keep it if QCOM stays above $175; your risk is capped by the long $170 put.
- Makes sense only if: you believe the flag consolidation resolves sideways-to-higher and the stock holds its breakout shelf.
- Invalidated if: QCOM closes below $178.00.
- Managing it: close at roughly 50% of max credit; with the short-term trend running well ahead of a flat ~50-day read, take profits early rather than holding for the last dime. If QCOM closes through $175, close the spread rather than hope into a Friday expiry.
- Liquidity note: the $175 puts quoted 7¢ wide (about 4% of mid) — easy fills. The $170 puts quoted 8¢ wide on a $0.80 mid, roughly 10%, so work the order rather than hitting the ask.
- Analyze this position →
If you expect the range to hold: Sep 18 $172.5/$167.5/$195/$200 iron condor
- Trade: Sell the $172.50 put / buy the $167.50 put, and sell the $195 call / buy the $200 call, all September 18
- Credit: ~$1.09 · Max profit: $109 · Max loss: $391 · Break-evens: $171.41 and $196.09
- Why it fits: The short call sits above the implied range's upper rail ($193.16) and just under the whole chain's heaviest call strike at $200.00; the short put sits just inside the lower rail, a deliberate concession to collect a workable credit in a 7-day structure. The positive dealer-gamma estimate describes exactly the kind of dampened, range-bound tape this profits from, and the chart models' $177–187 projection sits entirely inside both break-evens.
- Makes sense only if: you want to monetize rich premium without taking a side, and you accept that the put wing is the exposed one given a one-standard-deviation down move touches it.
- Invalidated if: QCOM closes outside $171.41–$196.09, at which point the structure is already at or near max loss on that wing.
- Managing it: take it off at ~50% of max credit; don't carry a tested wing into Friday's close. If only one side comes under pressure, closing the untested wing for pennies first reduces the remaining risk cheaply.
- Liquidity note: the $172.50 puts quoted 11¢ wide and the $195 calls 6¢ wide; the $167.50 puts are the loose leg at 8¢ on a $0.51 mid (about 16%) — use a limit on the package, never legs at market.
- Analyze this position →
If you lean bearish: Sep 18 $190/$195 short call spread
- Trade: Sell the September 18 $190 call, buy the September 18 $195 call
- Credit: ~$0.79 ($1.72 mid on the $190 call, $0.93 mid on the $195 call) · Max profit: $79 · Max loss: $421 · Break-even: $190.79
- Why it fits: This fades the rally without betting on a reversal. The $190 strike carries 4,297 contracts of open interest at this expiration and both chart models cap their projections at $186–187, so the trade wins on a stall as easily as on a decline. It is the structure for a reader who thinks the 25-delta call skew — calls 3.3 vol points over puts against a 0.6-point norm — marks crowded upside chasing rather than information.
- Makes sense only if: you are comfortable selling into an uptrend with ADX at 36.8. This trade fights both the options bias and the chart models; size it accordingly.
- Invalidated if: QCOM closes above $186.10.
- Managing it: take 50% and leave; with momentum still positive, this is a short-leash trade rather than a hold-to-expiry one. A close above $186.10 mid-week is a reason to exit early, not to add.
- Liquidity note: the $190 calls quoted 13¢ wide (7.6% of mid) and the $195 calls 6¢ (6.5%) — slightly wider than ideal, but both traded thousands of contracts Friday, so fills near mid are realistic.
- Analyze this position →
If none of these: no trade
Premium is rich and not distorted by any scheduled event, so "just sell something" is a tempting conclusion — but there is a real case for standing aside. Seven days to expiration is where gamma risk dominates the theta you collect: the same 18-vol-point cushion that looks generous on paper evaporates if QCOM gaps, and this stock has printed four gaps of 2.4% or larger in the last five weeks, including a 6.9% opening gap on September 8. A rich premium reading tells you sellers have been paid recently; it does not tell you the next five days will be quiet. If your alternative is a comfortably sized 21–35 day credit structure where time decay does more of the work, that is a defensible reason to skip the front week entirely.
6 · Quick FAQ
What is QCOM's expected move this week? About ±$11.19, or ±6.15%, into the September 18 expiration — a $170.78 to $193.16 range around the $181.97 close, per the options market's straddle pricing as of 2026-09-11.
Is QCOM expected to go up or down over the next five days? Options positioning as of September 11 leans bullish — call-tilted volume, put open interest thinning, and calls priced richer than equidistant puts — but that's a read of what traders have done, not a forecast. The actionable map is the $170.78–$193.16 range, the $175.00 open-interest shelf below, and the $200.00 call cluster above.
Are QCOM options expensive right now? Two lenses. IV rank of 28.6/100 says option prices are lower than about 71% of the past year's readings. But they are running roughly 18 vol points above the movement QCOM has actually delivered over the past 20 sessions — richer than about 88% of this stock's own recent readings. Cheap by the year's standard, rich by the stock's current standard: a seller's setup, not a buyer's.
Where is QCOM's biggest options support and resistance? For September 18 specifically, the walls are $130.00 (puts) and $300.00 (calls) — both tail strikes with no practical pull. The levels with real positioning are the whole chain's $160.00 put wall and $200.00 call wall, with max pain for the week at $170.00.
What invalidates this week's read? A close below $178.00 — that puts price under the breakout shelf and beneath the estimated $180.00 gamma flip, where hedging flows stop cushioning and start amplifying.
Methodology & disclosures. Data: end-of-day options-chain snapshot for QCOM, 2026-09-11, generated 2026-09-13T19:58:28.607Z. Prices shown are midpoints and will differ from live markets. Momentum/positioning scores and volatility-premium comparisons are descriptive measurements of past option flow and past price movement — not investment advice, signals, forecasts, or guarantees. All trade structures are hypothetical. Every structure shown has a defined maximum loss; you can lose the entire max-loss amount. Options involve substantial risk and are not suitable for all investors.