QCOM Options Are Pricing an $11 Move Into September 25 — The Chart Models See a Lower Close
Qualcomm gave back nearly 6% on Friday, and the options market now implies a $166.74–$188.70 band into the September 25 expiration with max pain parked at $177.50. Here's what the positioning data actually says, where the technical models disagree, and three defined-risk ways to trade the gap.
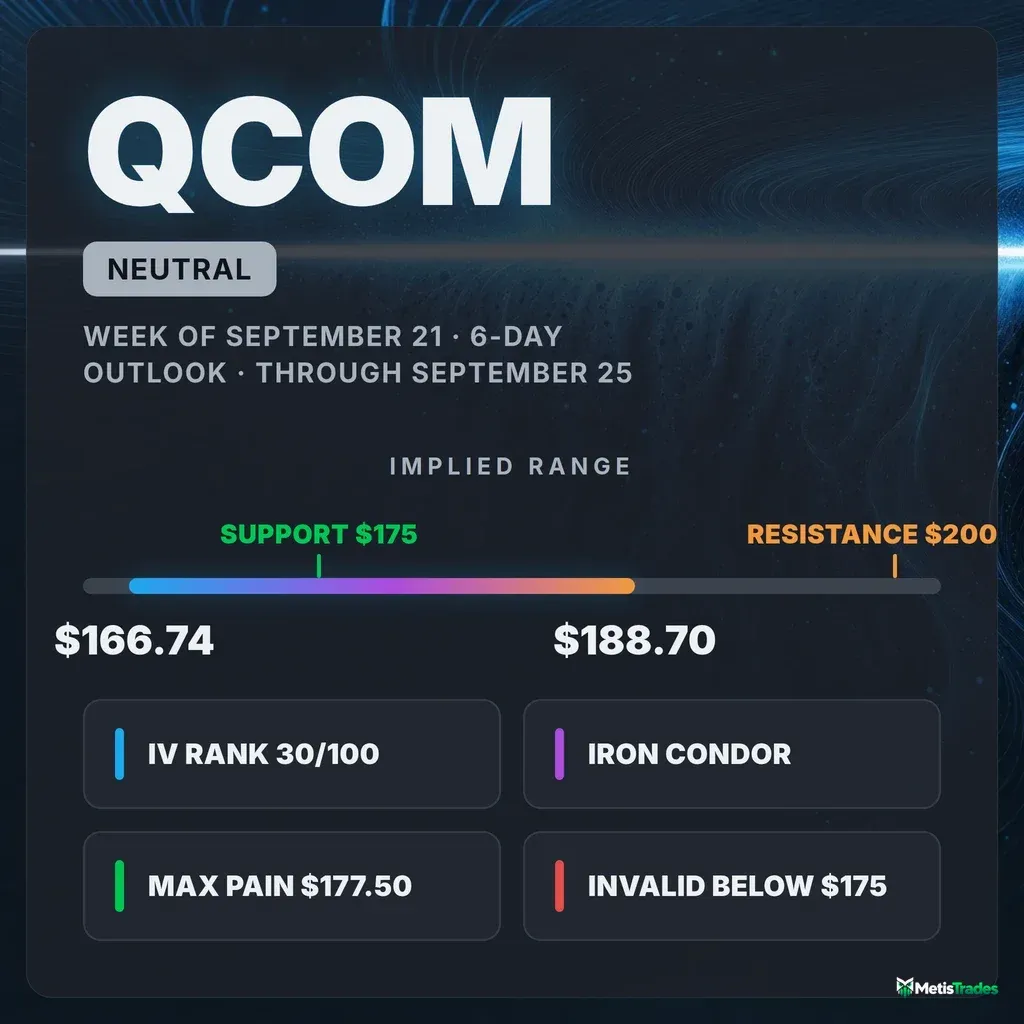
The options market implies a $166.74–$188.70 range into the September 25 expiration; here's what's driving it, where the chart models break ranks, and three defined-risk ways to trade it.
Published Saturday, September 19, 2026 · Data as of Friday, September 18 close
Explore the live QCOM options data in the Detailed Options Analyzer →
Quick answer
| Item | Answer |
|---|---|
| Market bias | Neutral |
| Options-implied range (into Sep 25) | $166.74 – $188.70 (±6.18%, about ±$10.98) |
| Major support | $175.00 (put wall, Sep 25 expiration) |
| Major resistance | $200.00 (call wall, Sep 25 expiration) |
| Max pain (Sep 25) | $177.50 |
| Dealer gamma regime (estimate) | Positive — hedging tends to dampen moves; estimated flip level ≈ $200 |
| Volatility condition | Neutral-to-easing — IV rank 30/100, ATM IV 46.01% · premium rich: options priced about 8.2 vol points above delivered movement |
| Technical check | Diverges (bearish, 3-day and 6-day models) |
| Best-fitting strategy | Iron condor — Sep 25 $170/$165 put spread plus $187.50/$192.50 call spread |
| Analysis invalidated if | QCOM closes below $175.00 |
1 · What matters today
QCOM closed Friday, September 18 at $177.72 after giving back nearly 6% in a single session, and the options market is now pricing a $166.74–$188.70 band into the September 25 expiration — about ±$10.98, or ±6.18%. That figure is the expected move: the move the options market is pricing in, derived from what straddles cost. Our read of the options data lands Neutral. Friday's flow turned sharply put-heavy, but 25-delta calls still cost more than 25-delta puts, and max pain for next Friday — the price where the most option value would expire worthless — sits at $177.50, essentially on top of the current price.
The single level that matters is $175: the strike holding the most put open interest for this expiration, and the same shelf the chart models flag as support. The technical read is the dissenting voice — both the 3-day and 6-day models are bearish, targeting $174.80 and $173.50.
2 · What the options market is pricing
What changed this week
Friday was a violent session. QCOM fell from $188.71 to $177.72 — a drop of roughly 5.8% — on 54.4 million shares, about 3.9× its 20-day average volume. Over five trading days the stock is down 2.34%; over twenty it is still up 10.56%. Options volume ran 1.93× its 20-day average.
Flow flipped with it. Put volume relative to call volume came in at 0.68 — still more calls than puts, but a long way above the 0.41 seven-day average and the 0.39 fourteen-day average for this name; traders bought protection at a pace that is genuinely unusual for QCOM. Open interest moved the same way: for every call contract held open there are now 0.93 puts, up from 0.71 five sessions ago and against a fourteen-day average of 0.84. Day over day, call open interest shed 16,799 contracts while put open interest added 6,646.
The single biggest build in contracts still live was the September 25 $200 calls, up 2,020 to 6,284 open, with the $190 calls adding 1,835 and the $195 calls 1,627 — upside lottery tickets going on even as the stock fell. Our momentum read of option flow swung to −23 on Friday from a +17 seven-day average, one of the sharper one-session reversals in the record.
The multi-horizon trend reads disagree with each other, and that tension is worth holding onto: over the past week the direction is flat-to-lower (price −2.3%), over the past month it is firmly higher (+10.6%), and over the past two and a half months it is lower (−7.0%). A blow-off single session sits inside a strong month inside a weak quarter — the near-term flow and the bigger trend are pointing different ways, which is exactly the setup that argues for short-dated structures and quick profit-taking rather than a held directional view.
Expected move
Into the September 25 expiration, the chain prices a ±6.18% move — about ±$10.98 — giving a $166.74 to $188.70 band around Friday's $177.72 close. That is one standard deviation, not a ceiling; roughly a third of the time price finishes outside it.
| Expiration | Implied move | Range around $177.72 |
|---|---|---|
| September 25 (7 DTE) | ±6.18% | $166.74 – $188.70 |
| October 2 (14 DTE) | ±8.87% | $161.96 – $193.48 |
| October 16 (28 DTE) | ±12.64% | $155.26 – $200.18 |
The rungs step up smoothly in line with the square root of time — there is no hump, no kink, no single date the chain is bracing for. Whatever traders are worried about, it is generalized volatility, not a scheduled event.
Volatility
At-the-money implied volatility — the market's estimate of how much QCOM will move, baked into option prices — sits at 46.01%. IV rank is 30/100, meaning today's reading is cheaper than about 70% of the past year's range. But the percentile tells a different story: 68% of the past year's individual sessions carried lower IV than today. Both are true; a handful of enormous volatility spikes in the past twelve months stretched the top of the range, so QCOM looks cheap against its extremes and mildly expensive against its typical day.
Direction is mixed. IV slipped 1.5% on Friday, is up 2.2% over five sessions, and is down 15.5% over thirty. It sits 4.3% above its 30-day average of 44.1% and far below its 90-day average of 64.7%. The front-month read is unavailable today — Friday was an expiration day, and front-month at-the-money IV cannot be interpolated from a contract expiring the same session. The 60-day tenor prices 49.48%, so the curve still slopes gently upward into the autumn.
On the realized side, the stock has been accelerating hard: twenty-day realized volatility is 37.78%, but the ten-day window is up at 46.72%, and the five-day pace is running about 1.6× the twenty-day pace — an unusually fast acceleration versus this stock's own recent history.
Premium: rich, but shrinking fast. The volatility risk premium — the gap between how much movement options are priced for and how much QCOM has actually delivered — stands at about 8.2 vol points in favor of the option seller. That is richer than roughly 69% of this stock's own recent readings, so sellers are still being paid above the going rate for carrying this stock's movement. The path matters, though: a week ago the gap was running near 17 to 22 vol points, and it halved on Friday alone — not because implied volatility collapsed, but because the 5.8% drop dumped real movement into the realized-volatility window. No scheduled report sits inside this window (Qualcomm's next is November 4), so none of the remaining richness is event premium. The verdict: IV rank 30 with a 69th-percentile premium over delivered movement still tilts toward collecting premium rather than owning it — but with the cushion thinner than it was, on tight structures rather than naked ones.
Skew and sentiment
Skew is the observation that puts and calls the same distance from the stock price don't cost the same. Here it runs the unusual way: 25-delta calls price at 48.13% implied volatility against 45.07% for 25-delta puts — calls are about 3.1 vol points richer than puts, versus a 60-day norm of roughly 0.6 points. That is 2.5 points further toward call-richness than this name's own baseline, and it is the most stretched of Friday's readings relative to its own history. Translation: even on a day the stock fell 6%, traders were paying up for upside exposure, not crash protection. It is a complacency signal as much as a bullish one.
Sentiment across the curve backs that up everywhere except the front. The nearest bucket, contracts expiring within seven days, reads a flat −3 against a seven-day average of +24 — the front end is the only place that turned. The 7-to-30-day bucket sits at +31, the 30-to-60-day bucket at +24, and the 60-to-120-day bucket at +37. Our summary phrase for that shape is a bullish-recovery regime: positioning is building further out while the nearest expiration goes neutral.
Cutting the other way, our leading positioning read — a composite built only from flow, skew and curve inputs, deliberately excluding price and IV trend — flipped to a bearish-setup state on Friday at −19, driven by the put-heavy volume, the call open-interest bleed, and put-side sweeps dominating the day's unusual prints (one call contract versus three puts cleared the peer-relative bar). Price rose nearly 8% over the trailing ten sessions while that score fell about 15 points — the widest price-versus-positioning gap in the current window.
Add it all together and the signals genuinely disagree: a bearish positioning setup, a mildly bullish curve, complacent skew, and negative one-day flow momentum. The arithmetic lands squarely in the middle, and the honest label is Neutral rather than a forced lean.
The key levels map
| Level | Price | Why it matters |
|---|---|---|
| Call wall (Sep 25) / estimated gamma flip | $200.00 | Heaviest call open interest for the target expiration (6,284) and for the whole chain (56,512); also the estimated flip level — treat as an estimate |
| Swing resistance | $196.09 | Prior pivot cluster from the daily feed |
| Swing resistance / call OI shelf | $190.56 | Near the $190 strike, 2,661 contracts open for Sep 25 |
| Upper implied rail (Sep 25) | $188.70 | Top of the one-standard-deviation band |
| 100-day moving average | $187.28 | Price sits 5.1% below it — the only major average still overhead |
| Technical resistance | $182.02 | Chart model's reclaim level; a close above it invalidates the bearish technical case |
| Swing resistance | $178.65 | Nearest overhead pivot |
| Spot / last close | $177.72 | Friday's close |
| Max pain (Sep 25) | $177.50 | Where the most option value expires worthless — expirations sometimes gravitate toward it |
| Put wall (Sep 25) | $175.00 | Heaviest put open interest for this expiration (1,324) and the day's largest premium print; chart support at $175.32 sits on the same shelf |
| 20-day moving average / swing support | $172.27 / $172.12 | First real structural cushion below the wall |
| Swing support | $170.25 | Pivot cluster |
| 50-day and 200-day moving averages | $168.52 / $168.55 | Converged — the longer-term trend line for this name |
| Lower implied rail (Sep 25) | $166.74 | Bottom of the one-standard-deviation band |
| Whole-chain put wall | $150.00 | 24,149 contracts across all expirations — far below the target expiration's own $175 wall, so it says nothing about next week |
Note the disagreement: the call wall is $200 on both the target expiration and the whole chain, but the put wall differs sharply — $175 for September 25 versus $150 across all expirations combined. For this window, use $175.
Positioning and unusual flow
One rough estimate of dealer positioning reads the September 25 expiration as positive-gamma — the regime in which market-maker hedging tends to dampen moves rather than amplify them, which is consistent with the pin-toward-max-pain case. The same estimate places the flip level at $200, above the current price rather than below it, which is a good reminder that this is a modeled figure built on an assumed convention, not observed dealer inventory. Read it as weak supporting evidence for pinning, nothing stronger.
Three live prints stand out from Friday:
- Sep 25 $175 put — 10,750 contracts traded against 1,324 open, $3.31 million of premium. By far the day's largest dollar print, and turnover of eight times the standing position. Open interest only grew by 463, so much of that was traded and closed intraday — but it explains why the put wall sits exactly at $175.
- Sep 25 $200 call — 7,381 traded, open interest up 2,020 to 6,284. The biggest genuine build of the day, and it is upside, bought on a 6% down day.
- Sep 25 $190 call — 4,044 traded, open interest up 1,835 to 2,661. Same story one strike closer: fresh call positioning stacked overhead into next Friday.
That is not a chain positioning for a crash. It is a chain where people hedged aggressively into the close and simultaneously kept paying for upside a week out.
3 · Technical check
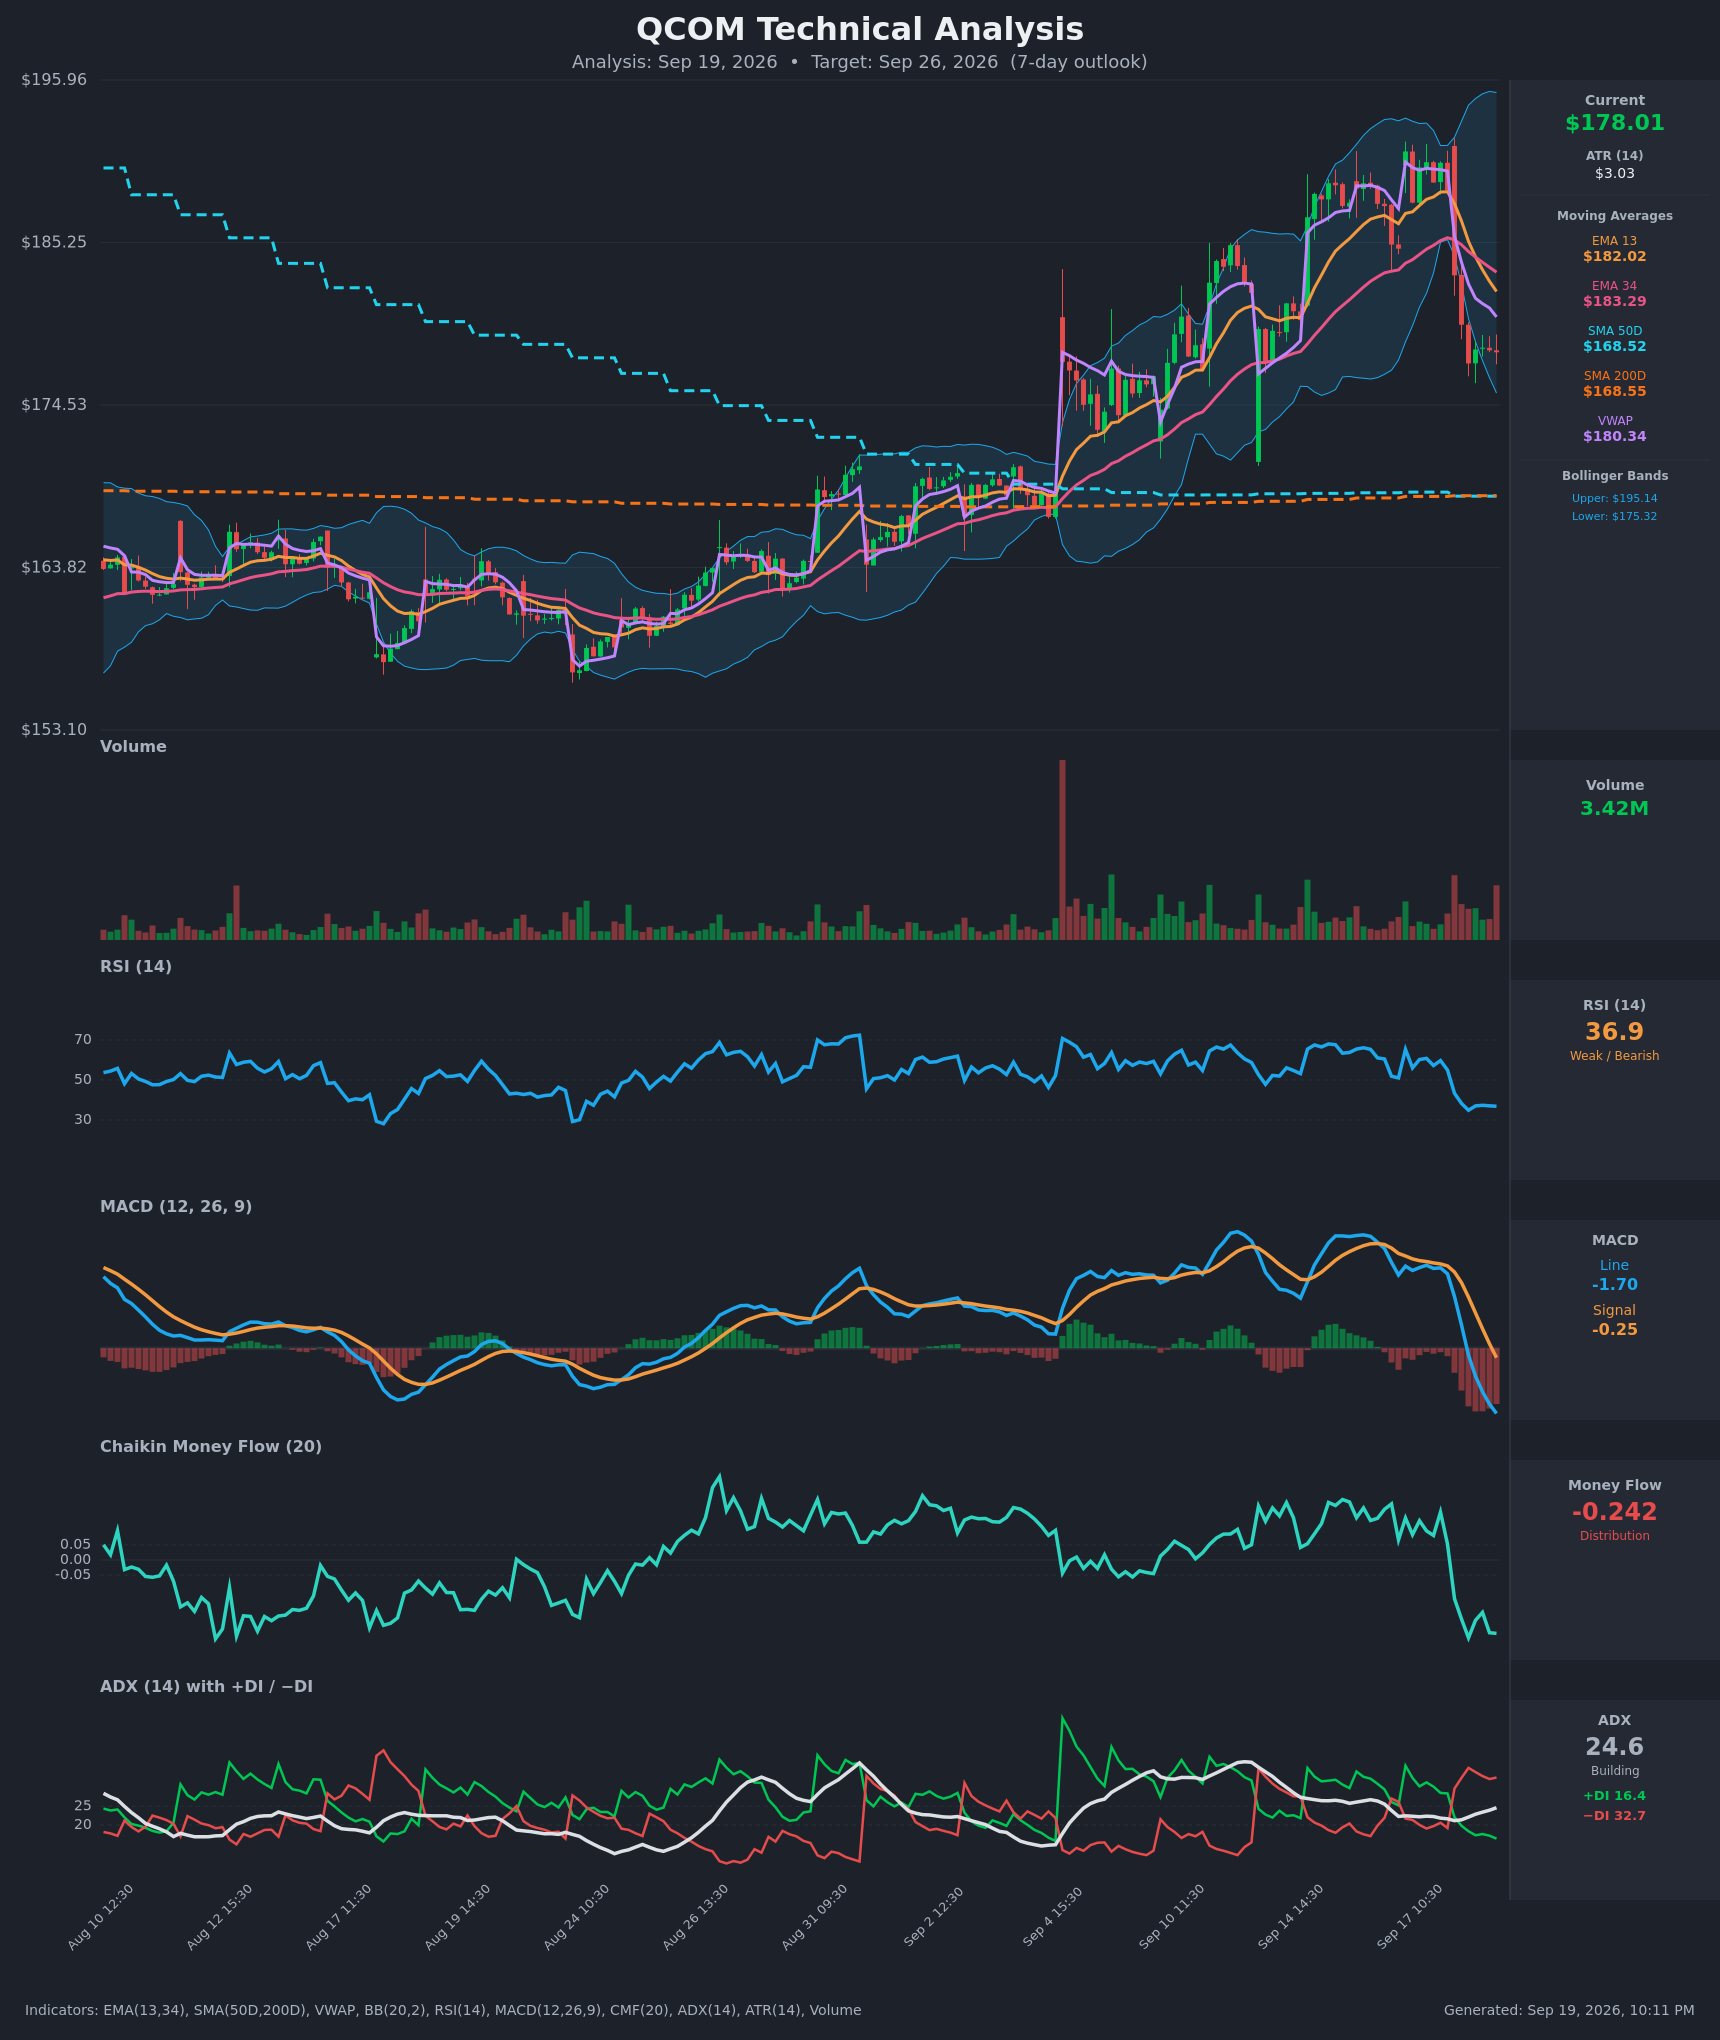
Both chart models break ranks with the options read, and they do it firmly. The 3-day model targets $174.80 by September 22 with a projected range of $172.20 to $181.70; the 6-day model targets $173.50 by September 25 with a projected range of $169.50 to $181.50. Both are labeled bearish. Their reasoning is consistent: a fresh MACD bearish crossover on September 18, ADX at 24.6 and rising with −DI at 32.7 well above +DI at 16.4, and a money-flow reading of −0.242 that swung from mildly positive to heavy distribution in two sessions. Both flag support at roughly $175.30 and resistance at $182.00.
Against the options-implied band, this classifies as a divergence — not because the targets are outlandish (both sit comfortably inside the $166.74–$188.70 band), but because the direction contradicts a flat options read and a max pain that sits at $177.50, three to four dollars above where the models expect price to finish. The gap that would resolve the question is small and specific: a decisive close through $175 says the chart models had it and the put wall was a speed bump rather than a floor; a reclaim of $182 with volume kills the bearish technical case outright and hands the week to the pin.
Model vs. Market: The options market implies $166.74–$188.70 into September 25; the 6-day technical model targets $173.50. Both can be right — $173.50 is inside the band — but they imply very different trades, one built around price going nowhere and one built around it grinding down four dollars.
That divergence is why the structures below shade their downside strikes lower than a symmetric expected-move condor would, and why nothing here is sized as a bullish directional bet.
Full technical write-ups: 3-day report → · 6-day report →
4 · Three ways the next six days can go
If QCOM pushes back above $182 and into the upper rail: the chart models' invalidation level is $182.02, and the implied rail is $188.70. Between those two sits the 100-day moving average at $187.28 and a shelf of call open interest at $190 that grew by 1,835 contracts on Friday. Heavy call open interest overhead tends to slow rallies as the contracts get hedged into; the genuine wall is not until $200, where 6,284 contracts sit for this expiration alone.
If QCOM drifts between $175 and $182: this is the case the positioning data supports most directly. Max pain for September 25 is $177.50, five cents' worth of distance from Friday's close, and one rough estimate has dealer hedging in the dampening regime for this expiration. Expiring open interest and hedging flows in that configuration tend to pull price toward the strike cluster rather than away from it, and the flat front-end sentiment read fits a market with no conviction either way.
If QCOM breaks below the $175 put wall: the cushion disappears quickly. The next structural markers are the 20-day average at $172.27 and the swing shelf at $172.12, then $170.25, then the converged 50- and 200-day averages at $168.52 and $168.55 — which is also roughly where the lower implied rail at $166.74 lives. Note that the estimated gamma flip sits at $200, above spot rather than below, so the usual "hedging accelerates the selling below the flip" framing does not cleanly apply here; the risk below $175 is plain structural air, not a modeled hedging cascade.
5 · Three defined-risk structures
Prices are end-of-day midpoints as of Friday, September 18. All structures are hypothetical. Verify live prices before trading — these will be stale by the open. Weekly QCOM contracts were quoting wide on Friday; every structure below should be worked as a package with a limit order, never at market.
If you expect the range to hold: Sep 25 iron condor
- Trade: Sell the $170 put / buy the $165 put, and sell the $187.50 call / buy the $192.50 call, all expiring September 25.
- Credit: about $1.40 · Max profit: $140 · Max loss: $360 · Break-evens: $168.60 and $188.90
- Why it fits: A credit spread means you collect premium up front and keep it if price stays between the short strikes. Max pain at $177.50 sits within twenty-two cents of the close, the estimated gamma regime for this expiration is the dampening kind, and premium is still running about 8.2 vol points above delivered movement — richer than roughly two-thirds of this stock's own recent readings. Both short strikes are shaded below the symmetric expected-move rails so the structure leans with, not against, the bearish chart read.
- Makes sense only if: you believe Friday was a one-session flush rather than the start of a trend leg. Both short strikes sit just inside the ±1σ rails, so this needs the pin, not merely a quiet week.
- Invalidated if: QCOM closes below $175.00 or above $182.00 — either close breaks the range thesis well before the short strikes are threatened.
- Managing it: close at roughly 50% of max credit; exit regardless on Wednesday, September 23 if the position hasn't worked, since the last two sessions carry the most gamma risk. With the short-term direction fighting the one-month trend, take profits early rather than pressing for the last twenty cents.
- Liquidity note: the $170 puts quoted $1.15/$1.59 (44¢ wide) and the $187.50 calls $1.35/$1.56 (21¢); the wings are thinner still. Slippage is the real cost here — use a package limit near the mid and walk it, don't chase.
- Analyze this position →
If you lean bullish: Sep 25 $172.50/$167.50 put credit spread
- Trade: Sell the September 25 $172.50 put, buy the September 25 $167.50 put.
- Credit: about $1.15 · Max profit: $115 · Max loss: $385 · Break-even: $171.35
- Why it fits: the short strike sits $2.50 below the $175 put wall and above both the 20-day average at $172.27 and the swing shelf at $172.12 — three separate reasons for price to hesitate before it gets there. The 7-to-30-day sentiment bucket reads +31, and 25-delta calls still price 3.1 vol points over puts, which is not how a chain behaves when it expects a breakdown.
- Makes sense only if: you think the $175 shelf holds and Friday's put buying was hedging into an intact monthly uptrend rather than conviction positioning.
- Invalidated if: QCOM closes below $175.00.
- Managing it: take 50–60% of the credit if it comes quickly; if the stock closes through $175, close the spread rather than hoping for a bounce, because the remaining distance to the short strike is less than one average daily range at current realized volatility.
- Liquidity note: the $172.50 puts quoted $1.91/$2.32 (41¢ wide, about 19% of mid); the $167.50 puts are much worse at $0.70/$1.24. Expect to give up real edge on the wing — price the spread as a whole.
- Analyze this position →
If you lean bearish: Sep 25 $177.50/$170 put debit spread
- Trade: Buy the September 25 $177.50 put, sell the September 25 $170 put.
- Debit: about $2.73 · Max profit: $477 · Max loss: $273 · Break-even: $174.77
- Why it fits: a debit spread means you pay up front and profit if price falls toward the lower strike. This is the structure that sides with the chart models — the 6-day target of $173.50 sits between the break-even and the short strike, and selling the $170 put finances the trade at exactly the level where the technical scenarios put their downside objective.
- Makes sense only if: you weight Friday's distribution signals and the fresh bearish momentum crossover above the flat options positioning. One caution: at a 69th-percentile premium over delivered movement, you are buying options that have been on the rich side of this stock's own recent norm, so the move has to come promptly to beat the decay.
- Invalidated if: QCOM closes above $182.00 — the chart models' own reclaim level, and the point at which the bearish technical case is off.
- Managing it: this is a six-day trade, not a position. Take profit into any test of $173–$174 rather than holding for the full width, and use the September 22 checkpoint as the first decision point — if the stock is flat or higher by then, the thesis has already failed on time.
- Liquidity note: the $177.50 puts quoted $3.75/$4.45 (70¢ wide, about 17% of mid) and the $170 puts $1.15/$1.59. That combined slippage is a meaningful share of the $2.73 debit — pay attention to the fill.
- Analyze this position →
If none of these: no trade
There is a real case for standing aside here, and it is not the usual one about cheap volatility. Premium is rich enough to sell — 8.2 vol points over delivered movement, richer than about 69% of this stock's recent readings — so the argument against selling it has to be about execution and timing rather than value. On both counts the case holds up. Weekly QCOM contracts are quoting 10% to 50% of mid in bid-ask spread, which means a condor collecting $1.40 could surrender 20–30 cents of that to the market on entry and exit alone. And the premium cushion that made selling attractive a week ago has already halved in a single session, because realized movement is catching up to implied fast — five-day realized volatility is running about 1.6× the twenty-day pace. Selling premium into accelerating realized movement with wide spreads is how a statistically sound edge turns into a losing month. Waiting for either the spreads to normalize post-expiration or for realized volatility to settle back down is a legitimate fourth choice.
6 · Quick FAQ
What is QCOM's expected move into September 25? About ±$10.98, or ±6.18%, giving a $166.74–$188.70 range around the $177.72 close — per the options market's straddle pricing as of September 18.
Is QCOM expected to go up or down over the next six days? Options positioning as of September 18 reads neutral: front-end sentiment is flat at −3, the longer buckets lean positive, and the leading positioning composite turned bearish — signals that genuinely cancel out. That's a read of what traders have done, not a forecast. The actionable map is the $166.74–$188.70 range and the $175 / $200 levels. Note that both technical models disagree and target a lower close, near $173.50.
Are QCOM options expensive right now? Two lenses. IV rank 30/100 says option prices are lower than 70% of the past year's range — but 68% of individual sessions in that year priced lower than today, so QCOM is only cheap against its own extremes. On top of that, options are running about 8.2 vol points above the movement the stock has actually delivered, richer than roughly 69% of its own recent readings. Net: mildly favorable for premium sellers, with a cushion that is shrinking fast as realized movement accelerates.
Where is QCOM's biggest options support and resistance? For the September 25 expiration, the put wall is $175.00 and the call wall is $200.00. Across the whole chain the put wall drops to $150.00 — that is a longer-dated hedging cluster and is not relevant to this week.
What invalidates this week's read? A close below $175.00.
Methodology & disclosures. Data: end-of-day options-chain snapshot for QCOM, 2026-09-18, generated 2026-09-19T22:11:43Z. Prices shown are midpoints and will differ from live markets. Momentum/positioning scores and volatility-premium comparisons are descriptive measurements of past option flow and past price movement — not investment advice, signals, forecasts, or guarantees. Earnings dates and reported results are from the data provider's earnings feed as of 2026-09-19T22:11:43Z; report dates can change. All trade structures are hypothetical. Every structure shown has a defined maximum loss; you can lose the entire max-loss amount. Options involve substantial risk and are not suitable for all investors.