QCOM Options Are Pricing a $20.38 Move by November 6 — Our Read Tilts Slightly Bearish
After an 11% one-day drop to $164.79, QCOM options imply a $144.41–$185.17 range into the November 6 expiration, with traders paying up for puts. Here is what the positioning shows, the levels that matter, and three defined-risk ways to trade it.
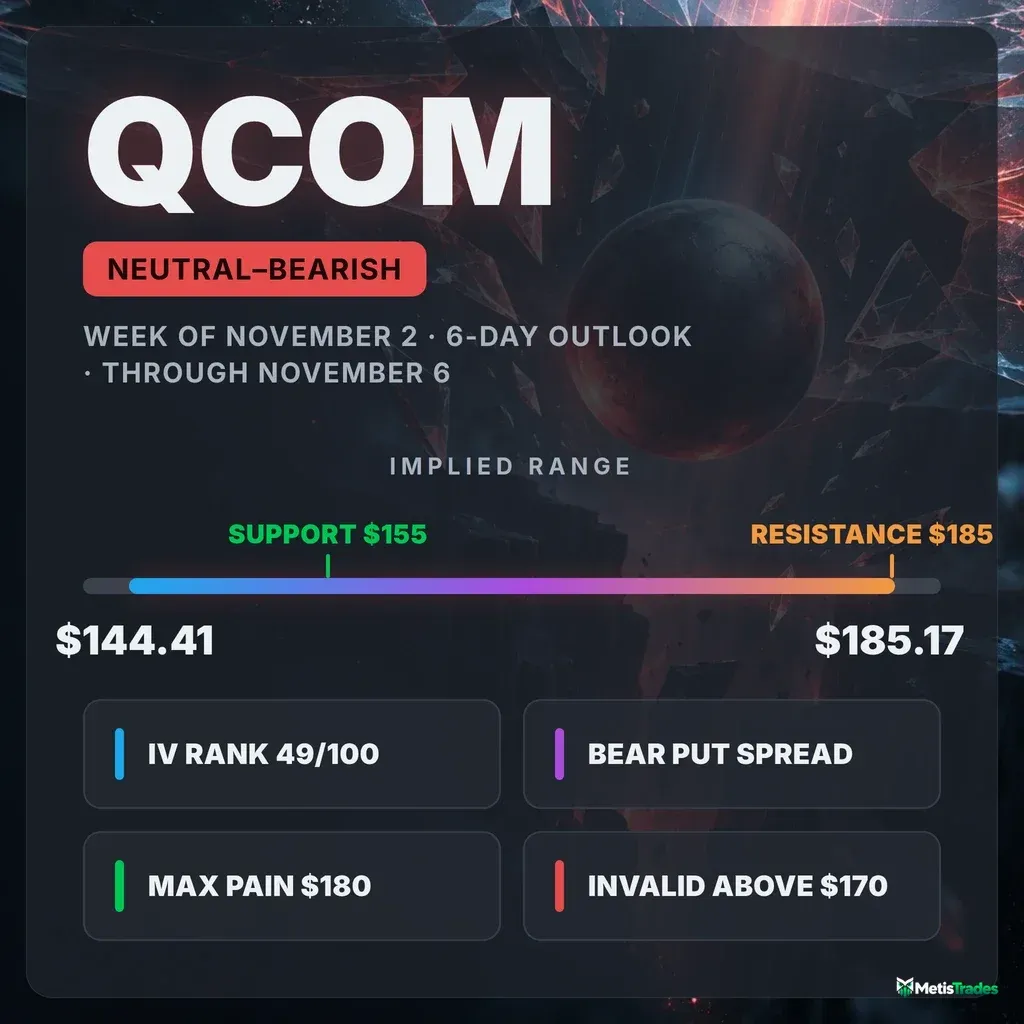
The options market implies a $144.41–$185.17 range into the November 6 expiration. Here is what's driving it and three defined-risk ways to trade it.
Published Saturday, October 31, 2026 · Data as of Friday, October 30, 2026 close
Explore the live QCOM options data in the Detailed Options Analyzer →
Quick answer
| Item | Answer |
|---|---|
| Market bias | Slightly bearish |
| Options-implied range (into November 6) | $144.41 – $185.17 (±$20.38, ±12.37%) |
| Major support | $155 (November 6 put wall) |
| Major resistance | $185 (November 6 call wall) |
| Max pain (November 6) | $180 |
| Dealer gamma regime (estimate) | Negative: hedging tends to amplify moves; flip level n/a (not computable today) |
| Volatility condition | Rising. IV rank 49.44/100 · premium fair: options priced ~7 vol pts above delivered movement (earnings-inflated) |
| Next earnings | November 4 (after close), before the November 6 expiration |
| Technical check | Confirms (bearish, 3-day target $163.20 and 6-day target $162.50) |
| Best-fitting strategy | Bear put spread (Nov 6 $165/$155), sized for earnings-gap risk |
| Analysis invalidated if | QCOM closes above $170 |
1 · What matters today
Qualcomm closed Friday, October 30 at $164.79 after opening with a gap down and falling about 11% on the day. Our read of the options market is slightly bearish. The main reason is that traders spent Friday buying put protection at a pace that is unusual for this stock: puts now cost more than calls, and put volume outran call volume.
The options market is pricing a move of about $20.38 either way by the November 6 expiration, which gives a range of roughly $144.41 to $185.17. That range is wide because the November 4 earnings report lands inside this window. The level that changes the picture is $170. A close back above it would mean the sellers have lost control.
Both chart-based technical models also lean bearish, with targets inside the options range.
2 · What the options market is pricing
What changed this week
This was a reversal week. QCOM was trading near $185 on October 29. Friday's gap and slide left it down 6.3% over five sessions and 10.9% over about a month.
The options flow turned with it:
- Put/call ratios. The put/call open-interest ratio (open interest = contracts currently held open) rose from 1.05 to 1.16 over five days, against a 7-day average of 1.03. That means 1.16 puts are now held open for every call. Since Thursday's snapshot, call open interest fell by about 36,000 contracts while put open interest grew by about 11,900.
- Biggest single build. The largest day-over-day open-interest increase was in the November 6 $155 puts, which jumped from 557 to 1,209 contracts. That build made $155 the heaviest put strike for the expiration.
- Implied volatility. At-the-money IV rose 7.1% over five sessions and 5.4% on Friday alone.
- Composite flow read. Our composite flow read swung hard to the bearish side on Friday. Its 7-day average was close to neutral, so this was a sudden shift rather than a slow grind.
The short- and medium-term trend reads now agree on the downside, while the longer roughly two-month view is flat. The bullish turn that registered on October 23 has been fully erased.
Expected move
The expected move is the move the options market is pricing in, derived from what straddles cost. For the November 6 expiration it is ±$20.38 (±12.37%) around $164.79.
| Expiration | Implied move | Range around $164.79 |
|---|---|---|
| November 6 | ±12.37% | $144.41 – $185.17 |
| November 13 | ±14.09% | $141.57 – $188.01 |
| November 20 | ±15.53% | $139.20 – $190.38 |
| November 27 | ±16.31% | $137.91 – $191.67 |
Normally, doubling the time roughly multiplies the expected move by 1.4. Here, the second week adds only about 1.7 percentage points. That tells you most of the near-term risk premium is packed into the first rung, the one that holds the earnings report.
Volatility
Implied volatility (IV) is the market's estimate of how much QCOM will move, baked into option prices.
- Level. At-the-money IV is 58.84%, above both its 30-day average (52.2%) and its 90-day average (55.4%). It is up 27.9% over 30 sessions.
- IV rank. IV rank is 49.44/100. That means today's IV sits about halfway between its 52-week low and high. On a percentile basis, it is higher than about 77% of the past year's daily readings.
- Term structure. The front-month term-structure read is unavailable today (expiry day). However, the November 6 contracts alone carry about 89% IV at the money, versus about 72% for November 13. That is a steep front-loaded kink created by the report.
- Realized movement. Compared against QCOM's own recent history, realized movement is accelerating sharply. The past week's swings run about 1.8 times the stock's 20-day pace, which is unusually high for this name.
Is premium rich or cheap? The volatility risk premium is the gap between how much movement options are priced for and how much QCOM has actually delivered. When it's positive, option sellers have been collecting more than realized movement cost them.
- Options are priced about 7 vol points above the stock's 20-day realized volatility of 51.9%.
- That gap is richer than about 54% of QCOM's own recent readings, so it is middle of the pack.
- The path matters. The gap ran near 25 points through October 29, then collapsed on Friday. That collapse is mechanical: Friday's 11% drop entered the 20-day realized window and inflated the "delivered" side.
Some of the remaining richness is the market pre-pricing the November 4 report, not free premium. Taken together, IV rank near 49 and a mid-range premium do not give a clean edge for selling options this week.
Earnings on the calendar
QCOM reports on November 4 after the close, two sessions before the November 6 expiration. Every contract in this article's window therefore carries the report. The near-90% at-the-money IV on November 6, versus about 72% a week later, is the market bracing for that overnight gap.
The July report came in a penny below expectations ($1.53 vs. $1.54). The three reports before it beat.
Skew and sentiment
Skew means puts and calls the same distance from the stock price don't cost the same. When puts are pricier, traders are paying up for crash protection.
- Skew. Puts at the 25-delta point now carry 61.8% IV versus 56.7% for calls, so puts run about 5.2 vol points over calls. Over the prior 60 days this name normally sat at −1.5, meaning calls were slightly richer. That is a swing of almost 7 points toward downside protection, and the skew is stretched well beyond its own recent norm.
- Put/call volume. The put/call ratio measures how much put activity there is relative to calls; above 1 means puts dominate. Friday's volume ratio was 1.06, against a 7-day average of 0.67 and a 14-day average of 0.57. Total option volume ran 2.1 times its 20-day average, and that put-heavy tilt is unusually extreme for QCOM.
- Short-dated sentiment. Sentiment in options expiring within 7 days is close to flat (+5), down from a 7-day average of +29. Sentiment in 7–30 day options swung to −52, from a 7-day average near +2. The overall picture is "mixed," but the conviction sits on the bearish side in the expirations that matter for this window.
The key levels map
| Level | Price | Why it matters |
|---|---|---|
| Whole-chain call wall / largest gamma strike | $200 | Heaviest call open interest across all expirations (44,432 contracts); far outside this window |
| Prior close before the gap | $185.41 | Top of Friday's unfilled gap |
| Call wall (November 6) | $185 | Biggest pile of open calls for this expiration (1,233); sits at the top of the implied range |
| Max pain (November 6) | $180 | The price where the most option value would expire worthless; expirations sometimes gravitate toward it, but it sits far above spot |
| Swing resistance | $179.71 | Prior pivot cluster |
| 50-day / 20-day moving averages | $177.83 / $176.89 | The prior trading range; now overhead supply |
| Gap open (October 30) | $174.82 | Where Friday's session opened |
| Swing resistance | $171.75 | Pivot just above the invalidation zone |
| Large gamma strike / invalidation | $170 | One of the chain's heaviest gamma strikes; a close above it breaks the bearish read |
| Swing resistance / 200-day MA | $169.81 / $169.52 | The 200-day was lost on Friday |
| Swing resistance | $165.87 | First overhead pivot, just above the $164.79 close |
| Swing support | $161.07 | Nearest structural floor |
| Large gamma strike | $160 | Second-heaviest gamma strike in the chain |
| Swing support | $156.48 | Pivot just above the put wall |
| Put wall (November 6) | $155 | Biggest pile of open puts for this expiration (1,209); the main options-based floor |
| Whole-chain put wall | $150 | Heaviest put open interest across all expirations (18,793) |
| Implied range low (November 6) | $144.41 | The lower edge of the priced-in move |
| Swing support | $142.89 | Deeper structural support |
The November 6 walls ($185 / $155) are tighter than the whole chain's heaviest strikes ($200 / $150). For this window, the November 6 levels are the ones that apply.
Positioning and unusual flow
Dealer gamma (an estimate). Market makers hedge the options they've sold. One rough estimate puts both the whole chain and the November 6 expiration in negative gamma, a regime where that hedging tends to amplify moves rather than dampen them. A gamma flip level could not be computed today.
Unusual flow worth knowing:
- November 6 $175 puts: 5,294 contracts traded against 564 open, about $7.7 million in premium. This was the single largest dollar trade in the chain, struck in the money and directly in the earnings window.
- November 6 $170, $172.50 and $177.50 calls: roughly 2,800 to 3,100 contracts each, against open interest under 150. That is about $1.0–1.7 million per strike. Open interest barely moved, so these look like same-day trading (including possible closing of call positions) rather than fresh bullish bets.
- December 18 $180 calls: 3,769 contracts on 1,609 open, about $2.7 million. Some longer-dated traders are still positioning for a recovery beyond this window.
3 · Technical check
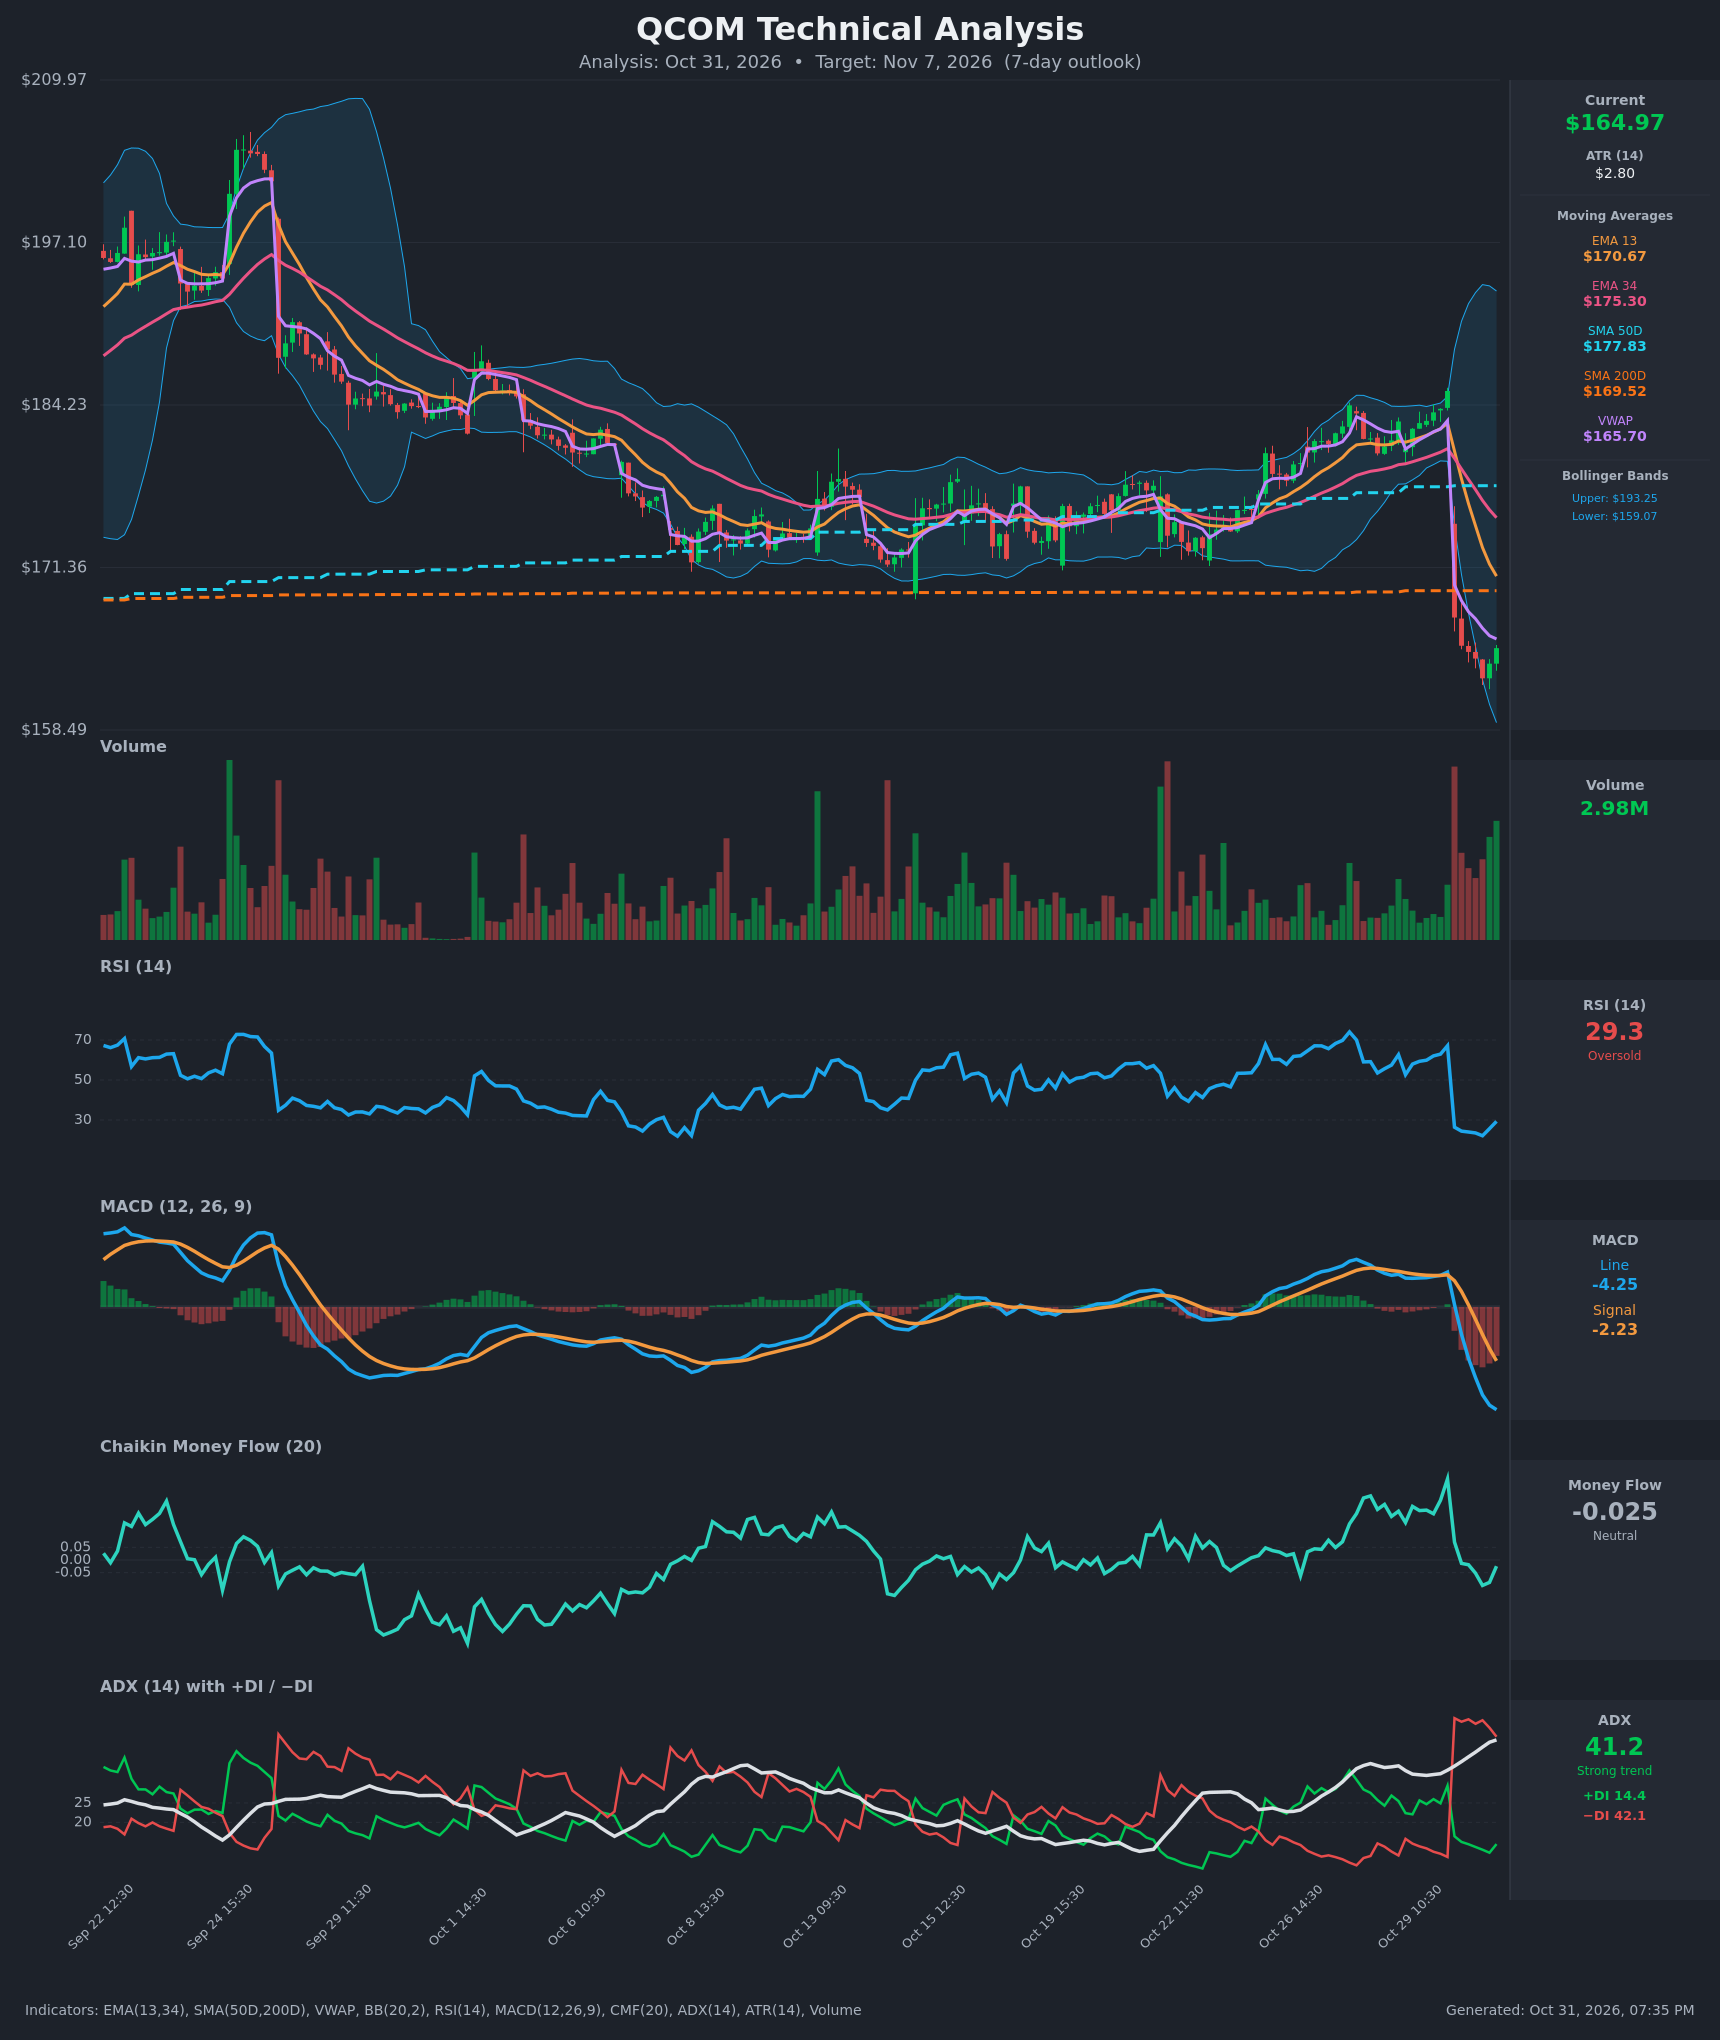
3-day model (through November 3): Confirms. The model is bearish with a $163.20 target and a projected range of $159.80 to $168.60, comfortably inside the options-implied band.
6-day model (through November 6): Confirms. It is also bearish, targeting $162.50 with a projected range of $157.50 to $169.00.
- Both write-ups lean on a strong trend reading: ADX is 41 and rising, with sellers' directional pressure far above buyers'.
- Both flag oversold RSI near 29 as the main risk of a relief bounce.
- Their key levels are support at $159.07 (lower Bollinger Band) and resistance at $169.52 (200-day). The dominant scenario in the 6-day report is invalidated by a daily close above $171.
Model vs. Market: The options market implies $144.41–$185.17 into November 6; the 6-day technical model targets $162.50. The chart model expects a modest drift lower, while options are pricing a far larger earnings swing in either direction. The report, not the trend, is the bigger risk to anyone's target.
The technical read only shaded strike selection. The bear put spread below has its break-even of about $160.73 sitting inside both models' projected ranges.
Full technical write-ups: 3-day report → · 6-day report →
4 · Three ways the next six days can go
If QCOM pushes above the call wall ($185): That would be a full reversal of Friday's gap, likely requiring a strongly received report. The heaviest November 6 call open interest at $185 tends to slow rallies. A clean break leaves thinner positioning until the whole chain's $200 strike. The bearish read would have been invalidated long before, at $170.
If QCOM drifts between the walls: Spot sits much closer to the $155 put wall than to the $185 call wall. Max pain at $180 suggests expiring open interest would exert some upward pull into November 6. That pull matters most if the post-earnings session is calm. A drift toward the $165–$170 zone would test the overhead moving averages without breaking the bearish structure.
If QCOM breaks below the put wall ($155): This is the acceleration case. With the estimated gamma regime negative, market-maker hedging tends to add to selling rather than cushion it. A post-earnings gap below $155 could carry toward the whole-chain $150 put wall and the lower edge of the implied range near $144.41.
5 · Three defined-risk structures
Prices are end-of-day midpoints as of October 30, 2026. All structures are hypothetical. Verify live prices before trading, because these will be stale by the open. Every November 6 structure spans the November 4 earnings report.
If you lean bearish: November 6 $165/$155 bear put spread
Mechanics reminder: you pay a debit to buy one put and sell a cheaper, lower-strike put, betting on a decline to the lower strike.
- Trade: Buy the November 6 $165 put ($8.325 mid), sell the November 6 $155 put ($4.05 mid).
- Debit: $4.28 ($427.50 per spread) · Max profit: $572.50 · Max loss: $427.50 · Break-even: $160.73
- Why it fits: Bearish flow, put skew stretched well past its norm, and the short strike parked at the $155 put wall. Selling the $155 put also offsets much of the inflated IV you pay on the $165 put.
- Makes sense only if: QCOM keeps failing below the $169.52–$170 zone.
- Invalidated if: QCOM closes above $170.
- Earnings exposure: Spans the November 4 report. Premium is inflated for that reason, and the position can gap through either strike overnight.
- Managing it: Take profits around 50% of max gain. Decide before the November 4 close whether you want to hold through the report. With the short- and medium-term trends aligned lower, there is little reason to extend past this expiration.
- Liquidity note: The $165 puts traded 45¢ wide (about 5.4%) and the $155 puts 30¢ wide (about 7.4%). Expect some slippage, and work the order near the midpoint.
- Analyze this position →
If you expect the range to hold: November 6 $145/$152.50/$185/$192.50 iron condor
Mechanics reminder: you collect a credit by selling a put spread below the market and a call spread above it, betting QCOM stays between the short strikes.
- Trade: Sell the $152.50 put ($3.35), buy the $145 put ($1.735), sell the $185 call ($1.87), buy the $192.50 call ($1.005). All legs expire November 6.
- Credit: $2.48 ($248) · Max profit: $248 · Max loss: $502 · Break-evens: $150.02 and $187.48
- Why it fits: The short call sits at the $185 call wall, right at the top of the implied range. The short put sits just under the $155 put wall.
- Makes sense only if: You expect the earnings reaction to come in smaller than the ±$20.38 priced in.
- Invalidated if: QCOM closes below $152.50 or above $185.
- Earnings exposure: Spans the November 4 report. The rich premium exists because of the report, and an overnight gap can blow through either short strike.
- Managing it: Close at 50% of the credit. If either short strike is breached on a close, exit rather than hope.
- Liquidity note: The legs run 19¢ to 40¢ wide, which is roughly 11–29% of each leg's mid. Four legs magnify slippage, so enter only at or near the midpoint.
- Analyze this position →
If you lean bullish: November 6 $150/$145 bull put spread
Mechanics reminder: you collect a credit by selling a put and buying a cheaper, lower-strike put, betting QCOM stays above the short strike.
- Trade: Sell the November 6 $150 put ($2.615), buy the November 6 $145 put ($1.735).
- Credit: $0.88 ($88) · Max profit: $88 · Max loss: $412 · Break-even: $149.12
- Why it fits: It plays the oversold-bounce case flagged by both technical reports without needing a rally. The short strike sits below the $155 put wall and below the chart models' lower projections.
- Makes sense only if: You believe the $155 put wall holds through the report.
- Invalidated if: QCOM closes below $155.
- Earnings exposure: Spans the November 4 report. The credit is fattened by event risk, not free premium, and the risk-to-reward is lopsided ($412 risked for $88).
- Managing it: Close at 50% of the credit. Exit if QCOM closes below $155.
- Liquidity note: The $150 puts traded 39¢ wide and the $145 puts 19¢ wide, both double-digit percentages of mid. Slippage can eat a large share of a $0.88 credit.
- Analyze this position →
If none of these: no trade
Standing aside is a legitimate choice this week, for three reasons:
- Every tradeable expiration in the window carries the November 4 report, so any position is partly an earnings bet.
- The premium over realized movement is only middle of the pack, and what richness exists is earnings-driven. Sellers are not being paid an obvious edge.
- Spreads are wide enough to cost real money on entry and exit.
If you don't want overnight gap exposure, waiting until after the report, when IV typically deflates and the walls reset, may beat all three structures.
6 · Quick FAQ
What is QCOM's expected move into November 6? ±$20.38 (±12.37%), for a range of $144.41–$185.17, per the options market's straddle pricing as of October 30.
Is QCOM expected to go up or down over the next six days? Options positioning as of October 30 leans slightly bearish, driven by heavy put buying and puts priced well above calls. That is a read of what traders have done, not a forecast. The actionable map is the $144.41–$185.17 range and the $155/$185 levels.
Are QCOM options expensive right now? Partly. IV rank 49.44/100 puts IV about halfway through its 52-week range, though above 77% of the past year's daily readings. Options are also running about 7 vol points above the movement QCOM has actually delivered, which is richer than about 54% of its own recent readings. Much of that premium reflects the November 4 report.
When is QCOM's next earnings report? November 4, after the close, two days before the November 6 expiration. That is why near-dated options carry about 89% IV versus about 72% a week later.
Where is QCOM's biggest options support and resistance? The put wall is at $155 and the call wall at $185 for the November 6 expiration.
What invalidates this read? A close above $170.
Methodology & disclosures. Data: end-of-day options-chain snapshot for QCOM, 2026-10-30, generated 2026-10-31T19:35:14.769Z. Prices shown are midpoints and will differ from live markets. Momentum/positioning scores and volatility-premium comparisons are descriptive measurements of past option flow and past price movement — not investment advice, signals, forecasts, or guarantees. Earnings dates and reported results are from the data provider's earnings feed as of 2026-10-31T19:35:14.769Z; report dates can change. All trade structures are hypothetical. Every structure shown has a defined maximum loss; you can lose the entire max-loss amount. Options involve substantial risk and are not suitable for all investors.