QQQ Options Outlook: Will the $680 Put Wall Hold Through November 6?
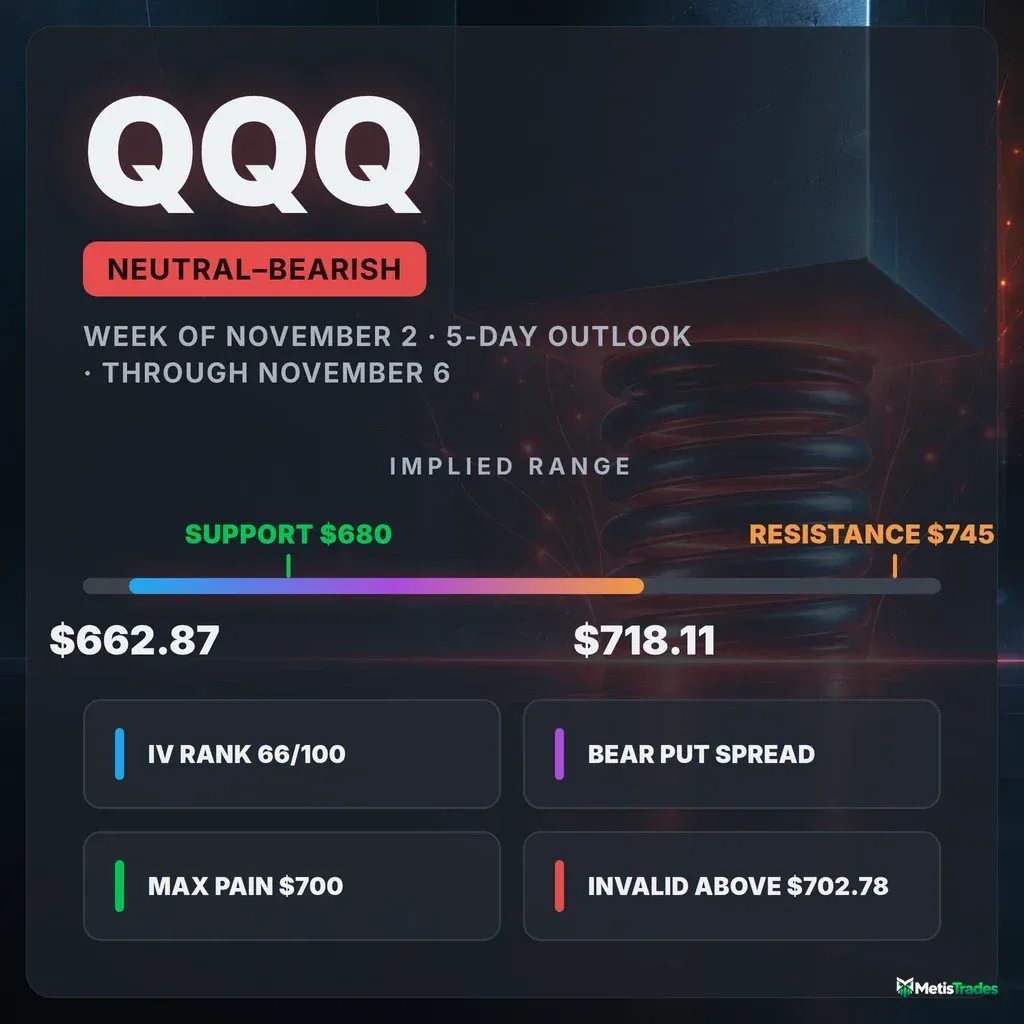
QQQ options imply a $662.87–$718.11 range into the November 6 expiration. Puts are stacked at $680, flow turned put-heavy after Friday's gap down, and our read is neutral with a bearish tilt.
Listen to this analysis — prefer audio? This QQQ outlook is also available as a podcast episode:
The options market implies a $662.87–$718.11 range for QQQ into the November 6 expiration. Below is what's driving that range and three defined-risk ways to trade it.
Published Sunday, November 1, 2026 · Data as of Friday, October 30, 2026 close
Explore the live QQQ options data in the Detailed Options Analyzer →
Quick answer
| Item | Answer |
|---|---|
| Market bias | Neutral with a bearish tilt |
| Options-implied range (into Nov 6) | $662.87 – $718.11 (±4.00%, ±$27.62) |
| Major support | $680 (Nov 6 put wall; the 200-day average at $679.52 sits just below) |
| Major resistance | $745 (Nov 6 call wall); the first overhead hurdle is $700 |
| Max pain (Nov 6) | $700 |
| Dealer gamma regime (estimate) | Negative, so hedging tends to amplify moves; flip level n/a (no estimate available) |
| Volatility condition | Rising. IV rank 66.46/100 · premium fair: options are priced ~1.8 vol pts above delivered movement |
| Technical check | Mixed (3-day model bearish, target $686; 5-day model bullish, target $696) |
| Best-fitting strategy | Bear put spread, Nov 6 $690/$680 (conditional on $700 capping rebounds) |
| Analysis invalidated if | QQQ closes above $702.78 |
1 · What matters today
QQQ closed at $690.49 on Friday, October 30, after gapping down about 2.5%. Our read of the options market is neutral with a bearish tilt.
The main reason is that traders spent Friday adding puts and closing calls. Downside protection now costs noticeably more than usual for this fund.
The options market is pricing a move of about $27.62 either way through the November 6 expiration. That gives a range of roughly $662.87 to $718.11.
The level that matters most is $680. That is where the biggest pile of open put contracts for that expiration sits, and the 200-day average is just below it.
A rebound has a nearby ceiling at $700. A close above $702.78 would undo the bearish lean.
The chart models are split: the 3-day model leans lower and the 5-day model leans toward a modest bounce.
2 · What the options market is pricing
What changed this week
Price. QQQ fell 1.97% over the past five sessions and is down 7.88% over the past 20. On Friday, October 30 it opened at $697.21, versus a $715.34 close the day before, and kept sliding.
Implied volatility. IV (implied volatility) is the market's estimate of how much QQQ will move, baked into option prices. Headline ATM IV jumped 16% in one session, to 24.7%, but is roughly flat over five days (−0.7%). The midweek bounce had drained it, and Friday's drop refilled it.
Put/call open interest. Open interest means contracts currently held open. The put/call OI ratio climbed from 2.64 to 3.87 over five sessions, against a 7-day average of 2.29. In other words, there are now nearly four puts held open for every call.
- In one session, call open interest fell by about 333,600 contracts.
- Put open interest rose by about 377,500 contracts over the same session.
- That one-day swing toward puts was unusually large for QQQ compared with its own recent history.
The cleanest build in the target expiration was in the November 6 $745 calls. They added 1,112 contracts to reach 6,467, which is now that expiration's call wall.
Flow vs. trend. Our read of options flow swung from +21 on October 28 to −41 on Friday. That is a sharp turn after a week that averaged −13.
The short- and long-term trend reads agree on direction. Both the past-week and past-month reads are bearish, and the ~50-day read is flat. That backdrop favors shorter-dated directional structures over longer bets.
Expected move
The expected move is the move the options market is pricing in, derived from what straddles cost. For the November 6 expiration it is ±4.00%, or about ±$27.62 around $690.49. That puts the range at $662.87 to $718.11.
| Expiration | Implied move | Range around $690.49 |
|---|---|---|
| Nov 2 | ±1.86% | $677.65 – $703.33 |
| Nov 4 | ±3.21% | $668.33 – $712.65 |
| Nov 6 | ±4.00% | $662.87 – $718.11 |
| Nov 13 | ±5.32% | $653.76 – $727.22 |
| Nov 30 | ±7.14% | $641.19 – $739.79 |
The rungs do not scale smoothly with time. The November 6 contracts carry the highest at-the-money IV on the curve, about 28.9%, against roughly 20.5% for November 2 and 26.3% for November 9. In other words, the market is paying the most per day of exposure for the coming five sessions.
Volatility
IV rank and percentile. ATM IV of 24.70% gives an IV rank of 66.46/100. IV rank shows where today's IV sits within its 52-week range, so 66.46 means about two-thirds of the way from the year's low to its high. By percentile, today's IV is higher than about 82% of the past year's daily readings.
Direction. IV is up 43.5% over 30 sessions. It sits well above its 30-day average (20.0%) and its 90-day average (21.5%). The pace of that expansion is unusually fast for QQQ compared with its own recent history.
A front-month term-structure reading is unavailable today (expiry day). The ~60-day IV of 24.2% is roughly in line with the headline figure.
Realized movement. QQQ's own price swings have picked up. Ten-day realized volatility is 28.0%, versus 22.9% over 20 days. The past week's movement is running well above this fund's recent norm.
Premium rich or cheap. The volatility risk premium is the gap between how much movement options are priced for and how much QQQ has actually delivered. When it is positive, option sellers have been collecting more than realized movement cost them.
- Today that gap is only about 1.8 vol points.
- That reading sits near the middle of QQQ's own recent readings: richer than about half of them, cheaper than the other half.
- The gap was much wider recently. It peaked near 6.8 points on October 22 and collapsed to about 1.1 by October 29, as realized movement caught up with what options were charging.
IV rank 66.46 combined with a middle-of-the-pack premium gives no strong edge to either buying or selling premium this week. Premium is fair, not rich. Defined-risk structures on both sides are reasonable, and naked premium-selling is not well rewarded here.
Skew and sentiment
Skew. Skew means puts and calls the same distance from the stock price don't cost the same; when puts are pricier, traders are paying up for crash protection.
- QQQ's 25-delta puts trade at 28.4% IV versus 21.9% for the matching calls, a gap of 6.5 vol points.
- The norm for QQQ over the prior 60 days is 4.5 points, and the 14-day average is 5.7.
- So traders are paying about 2 extra points for downside protection, which is steep for this fund.
Put/call volume. The put/call ratio measures how much put activity there is relative to calls; above 1 means puts dominate. Volume put/call was 0.96, close to its 7-day average of 0.98.
Friday's trading was not a one-sided put stampede. The put tilt shows up in what traders chose to hold overnight, not in how much they traded.
Sentiment by expiration.
- Options expiring within a week read roughly flat (+3), with a slight call-side tilt in volume.
- The 7-to-30-day window reads bearish (−20). Puts there are pricier than usual and put-side volume dominates.
- That is close to its 7-day average of −21, so this isn't new. It's a persistent lean.
- Overall, the curve reads mixed.
Volatility backdrop. QQQ's IV tracks the VIX closely: their 60-day correlation is 0.82. The VIX closed at 19.42, only about a third of the way up its 52-week range. Broad-market fear is elevated but not extreme.
The key levels map
| Level | Price | Why it matters |
|---|---|---|
| 52-week high | $762.86 | Ceiling of the past year's range |
| Call wall (Nov 6) | $745 | Heaviest Nov 6 call open interest (6,467); far above this week's implied range |
| Swing resistance | $736.10 | Recent pivot cluster (heuristic) |
| 20-day average | $728.19 | QQQ is 5.18% below it |
| Swing resistance | $726.76 | Area just above the October 22 gap origin ($725.20) |
| 50-day average | $725.00 | Medium-term trend line |
| 100-day average | $719.02 | Sits just above the upper rail |
| Upper expected-move rail (Nov 6) | $718.11 | Top of the 1σ options-implied range; the Oct 30 gap began at $715.34 |
| Swing resistance | $702.78 | Nearest heuristic resistance; our invalidation level |
| Max pain (Nov 6) / heaviest chain-wide call strike | $700 | Expiration "gravity" point; the whole chain's biggest call pile (42,016) and second-largest gamma strike |
| Gamma strike | $695 | Large concentration of near-dated put open interest |
| Spot / gamma strike | $690.49 / $690 | Where QQQ sits now |
| Swing support | $686.76 | Nearest heuristic support |
| Gamma strike | $685 | Heavy put open interest across near expirations |
| Put wall (Nov 6 and whole chain) | $680 | 25,801 Nov 6 puts; 252,719 across all expirations; the chain's largest gamma strike |
| 200-day average | $679.52 | Long-term trend line, just under the put wall |
| Lower expected-move rail (Nov 6) | $662.87 | Bottom of the 1σ implied range |
| Swing support | $661.14 | Next heuristic support below the rail |
The two wall readings disagree on the call side. For the November 6 expiration, the call wall is $745. For the whole chain, the heaviest call strike is $700. For a trade expiring November 6, $700 is the practical overhead level and $745 is too far away to matter. Both readings agree that $680 is the put wall.
Positioning and unusual flow
Dealer gamma. Market makers hedge the options they've sold. In a negative-gamma regime, their hedging tends to amplify moves rather than dampen them.
- One rough estimate puts both the November 6 expiration and the whole chain in negative gamma, so the two views agree for this window.
- No gamma-flip estimate is available today, so there is no single pivot price to lean on.
- The practical read: moves of the size options are pricing could stretch rather than stall.
Notable flow (all expirations still open):
- November 6 $700 calls: 52,365 contracts, about $36.8 million in premium. That is the busiest contract in the target expiration, aimed squarely at max pain. Traders are paying for a rebound to $700, but these calls are only 1,051 contracts in open interest, so most of the trading was in and out.
- November 20 $690 puts: about 30,000 contracts, roughly $48.5 million in premium. This is large protection bought at the money a few weeks out, consistent with the steep skew.
- November 2 calls, $687 through $698: each strike traded between roughly 12,000 and 20,000 contracts on brand-new strikes. That is a cluster of very short-dated call buying near spot, someone betting on a quick snap-back to start the week.
Into Friday's expiration (settled history only): the October 30 $690 puts traded over 350,000 contracts and finished nearly worthless with QQQ closing just above that strike.
3 · Technical check
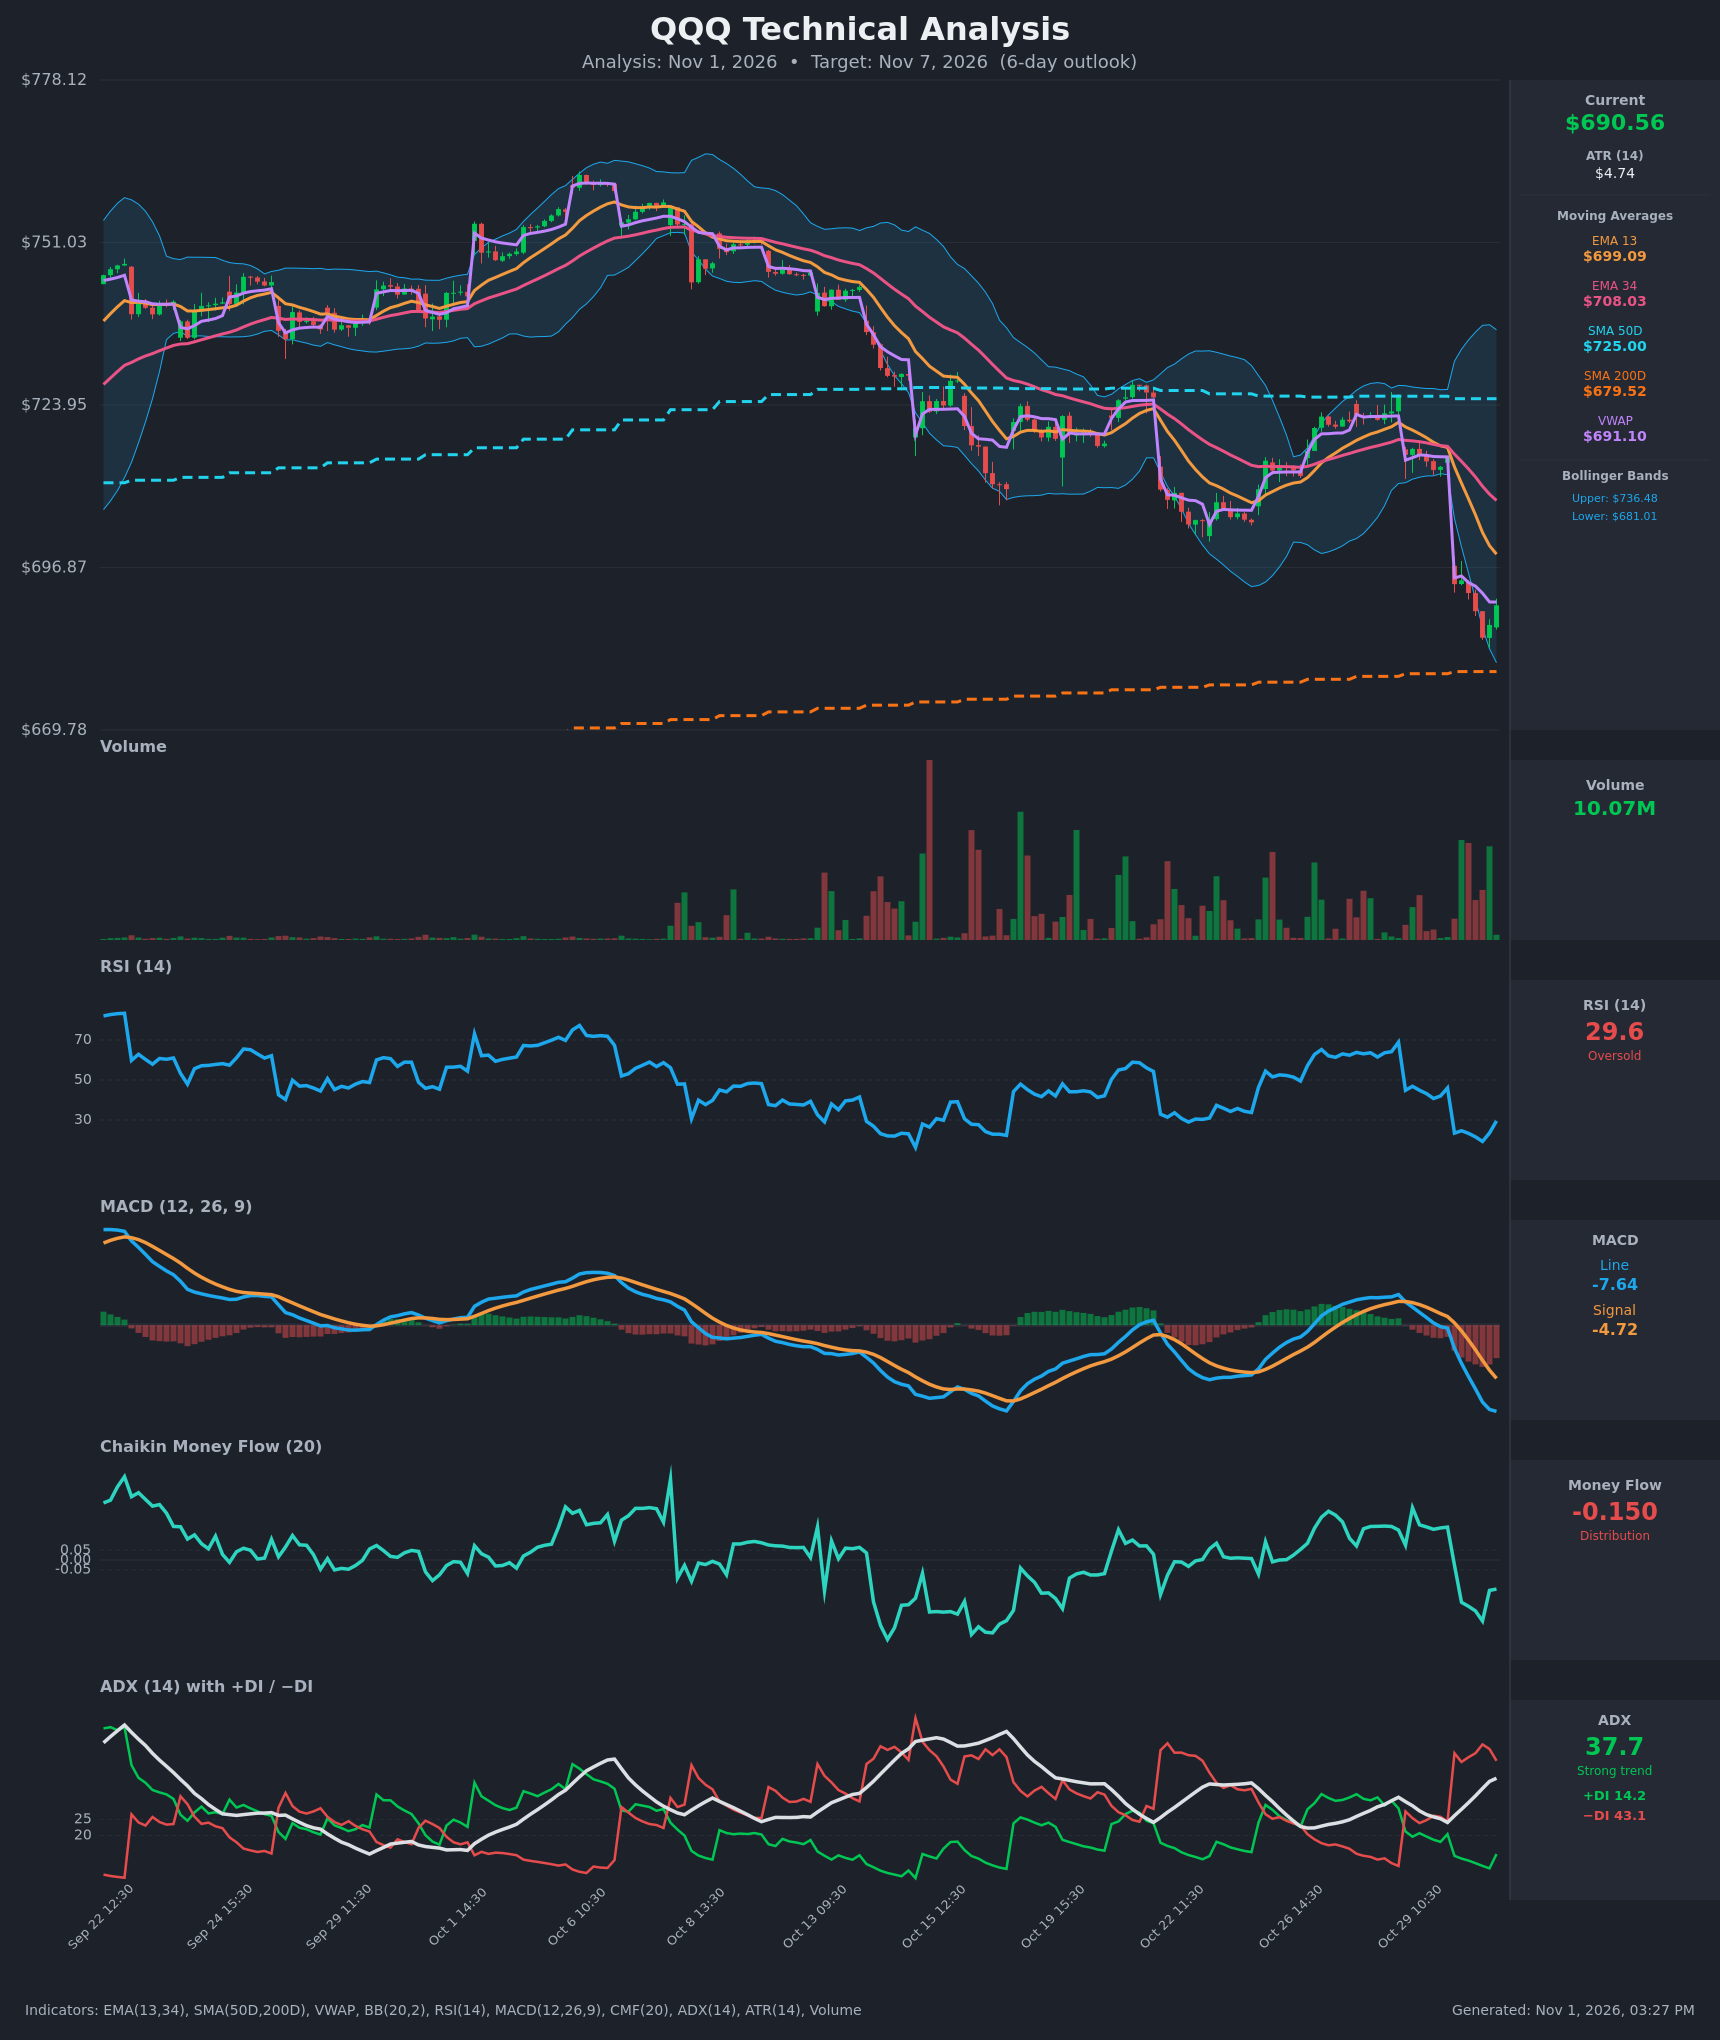
3-day model (target November 4): bearish.
- It targets $686, with a projected range of $673 to $701.
- That target sits inside the options-implied range for November 4 ($668.33–$712.65) and matches our bearish tilt, so this horizon confirms.
- Its most decisive reads: a strong downtrend reading (ADX 37.7, sellers firmly in control) and money-flow distribution behind Friday's gap.
- Its dominant scenario is invalidated by a close above $699.
5-day model (target November 6): bullish.
- It targets $696, with a projected range of $673 to $714.
- The target is inside the November 6 implied range, but the direction runs against our tilt, so this horizon diverges.
- Its case rests on deeply oversold momentum (RSI rebounding from about 19) and support at the lower band and the 200-day average ($679.52). It flags its own conviction as low.
- Its upside is capped near the 13-period average around $699, and a loss of $681 invalidates it.
Both models agree on the battleground: support in the $679.52–$681 zone and resistance near $699–$700. That is almost exactly the options map, with the $680 put wall below and $700 max pain above.
Model vs. Market: The options market implies $668.33–$712.65 into November 4; the 3-day technical model targets $686. The model's call fits comfortably inside what options are pricing. The real question is whether the 5-day model's relief bounce to $696 can reclaim $700, and a close above $702.78 would settle it in the bulls' favor.
The technical read shaped strike selection. The bear put spread's break-even ($686.33) sits right at the 3-day model's $686 target. The bullish structure's short strike ($685) sits just under swing support, with both models' support zone underneath.
Full technical write-ups: 3-day report → · 5-day report →
4 · Three ways the week can go
If QQQ pushes back above $700 (max pain and the chain's heaviest call strike):
- The biggest call pile overhead sits at $700, and swing resistance follows at $702.78.
- A close through both would flip our tilt and open thinner territory toward the gap origin near $715 and the upper rail at $718.11.
- The November 6 call wall at $745 is too distant to act as a magnet this week.
If QQQ drifts between $680 and $700:
- This is the pin case.
- Expiring open interest is concentrated at $680, $690, $695 and $700, and max pain at $700 tends to exert some pull as expiration nears.
- Negative gamma makes a clean pin less likely than usual, so expect choppy two-way swings inside the band rather than a quiet drift.
If QQQ breaks below the put wall ($680):
- This is the acceleration case.
- The $680 strike holds the chain's largest put concentration, and the 200-day average sits at $679.52.
- Losing both together would remove the main floor. In a negative-gamma regime, one rough estimate suggests market-maker hedging would add to selling rather than cushion it.
- The lower rail at $662.87 and swing support at $661.14 are the next reference points.
5 · Three defined-risk structures
Prices are end-of-day midpoints as of Friday, October 30, 2026. All structures are hypothetical. Verify live prices before trading; these will be stale by the open.
Ordering: the premium read is middle-of-the-pack, so structures are ordered by our bearish tilt. The bearish idea leads.
If you lean bearish: Bear put spread
A debit spread means you pay up front to own the closer strike and finance part of it by selling the farther one. You are betting on a move toward the short strike.
- Trade: Buy the Nov 6 $690 put, sell the Nov 6 $680 put
- Debit: $3.67 ($367 per spread) · Max profit: $633 (QQQ at or below $680 at expiration) · Max loss: $367 · Break-even: $686.33
- Why it fits: Put open interest surged and flow turned sharply put-heavy. The short $680 leg sits on the put wall and borrows the steep skew: you sell a put that is pricier than usual. The break-even lands on the 3-day model's $686 target.
- Makes sense only if: $700 continues to cap rebounds and QQQ fails to reclaim the $691–$695 area early in the week.
- Invalidated if: QQQ closes above $702.78
- Managing it: Take profits as QQQ approaches $680. Do not hold for the last dollar, because the put wall and 200-day average can produce a bounce. Close at ~60% of max profit, or exit by the November 5 close. With both the short- and medium-term trend reads pointing down, this short-dated window is where the tilt is best expressed.
- Liquidity note: The $690 puts traded 15¢ wide and the $680 puts 13¢ wide. Fills are easy.
- Analyze this position →
If you expect the range to hold: Iron butterfly
An iron butterfly sells a call and a put at the same middle strike and buys protective wings on each side. You collect a credit and profit most if QQQ finishes near the center.
- Trade: Buy the Nov 6 $680 put, sell the Nov 6 $690 put, sell the Nov 6 $690 call, buy the Nov 6 $700 call
- Credit: $8.59 ($859 per position) · Max profit: $859 (QQQ exactly at $690 at expiration) · Max loss: $141 · Break-evens: $681.41 and $698.59
- Why it fits: The wings sit exactly on the two levels that frame the week: the $680 put wall and $700 max pain. The center sits on the $690 gamma strike where QQQ closed. November 6 carries the richest at-the-money IV on the curve, so the sold straddle collects its most expensive premium.
- Makes sense only if: You expect choppy, two-way trade between the walls rather than a trend. Negative gamma makes this the lower-probability stance, which the small max loss reflects.
- Invalidated if: QQQ closes above $700 or below $680
- Managing it: Close at 25–35% of max credit. Gains come slowly and are concentrated in the final sessions. Exit if either break-even is breached on a closing basis.
- Liquidity note: The $690 calls traded 11¢ wide, the $700 calls 7¢, the $690 puts 15¢ and the $680 puts 13¢. All four legs are tight.
- Analyze this position →
If you lean bullish: Bull put spread
A credit spread means you collect premium up front by selling the closer strike and buying a farther one for protection. You are betting QQQ stays above the short strike.
- Trade: Sell the Nov 6 $685 put, buy the Nov 6 $680 put
- Credit: $1.67 ($167 per spread) · Max profit: $167 · Max loss: $333 · Break-even: $683.33
- Why it fits: It sells steep put skew just above the $680 put wall and 200-day average, the support zone both chart models name. It is the 5-day model's relief-bounce case, expressed without needing a rally: QQQ just has to hold.
- Makes sense only if: QQQ holds swing support at $686.76 early in the week.
- Invalidated if: QQQ closes below $680
- Managing it: Close at ~50% of max credit. If QQQ closes below $685, close rather than hope. Negative gamma can turn a dip into a slide.
- Liquidity note: The $685 puts traded 13¢ wide and the $680 puts 13¢ wide. Fills are easy.
- Analyze this position →
If none of these: no trade
Standing aside is a reasonable choice this week.
- The tilt is mild. Our bearish lean comes from Friday's positioning, not a long-established trend in flow. Flow was briefly positive as recently as October 28.
- Premium isn't rich enough to sell aggressively. Options are priced only about 1.8 vol points above realized movement, a middling reading for QQQ, even with IV rank at 66.46.
- Price swings are accelerating. Realized movement over the past week is running well above its own norm.
- Dealer hedging may amplify moves. Under the negative-gamma estimate, a break of either $680 or $700 could carry further than a typical week.
If you can't define what would make you wrong before entry, the $680–$700 band will likely clarify things within two or three sessions.
6 · Quick FAQ
What is QQQ's expected move this week?
About ±$27.62 (±4.00%) into the November 6 expiration, based on straddle pricing as of Friday, October 30. That implies a range of $662.87 to $718.11.
Is QQQ expected to go up or down over the next week?
Options positioning as of October 30 leans slightly bearish, because traders added puts, closed calls and paid up for downside protection. That is a read of what traders have done, not a forecast. The actionable map is the $662.87–$718.11 range, with $680 support and $700 as the first resistance.
Are QQQ options expensive right now?
IV rank 66.46/100 puts today's IV about two-thirds of the way up its 52-week range. Options are also priced only about 1.8 vol points above the movement QQQ has actually delivered, which is middle-of-the-pack for this fund. The verdict is fair, not cheap and not especially rich. Puts specifically are pricier than usual relative to calls.
Where is QQQ's biggest options support and resistance?
For November 6, the put wall is $680 and the call wall is $745. In practice, $700 (max pain and the whole chain's heaviest call strike) is the nearer resistance.
What invalidates this week's read?
A close above $702.78.
Methodology & disclosures. Data: end-of-day options-chain snapshot for QQQ, 2026-10-30, generated 2026-11-01T15:27:38.179Z. Prices shown are midpoints and will differ from live markets. Momentum/positioning scores and volatility-premium comparisons are descriptive measurements of past option flow and past price movement — not investment advice, signals, forecasts, or guarantees. All trade structures are hypothetical. Every structure shown has a defined maximum loss; you can lose the entire max-loss amount. Options involve substantial risk and are not suitable for all investors.