QQQ Options Are Pricing an $18 Move Into September 21 — The Chart Model Sees $717.50
QQQ's options market is pricing a $696.51–$733.25 range into the September 21 expiration, while both technical reports land near $717.50. Here's the positioning behind that gap, the levels that matter, and three defined-risk ways to trade it.

The options market implies a $696.51–$733.25 range into the September 21 expiration; here's what's driving it and three defined-risk ways to trade it.
Published Sunday, September 13, 2026 · Data as of Friday, September 11, 2026 close
Explore the live QQQ options data in the Detailed Options Analyzer →
Quick answer
| Item | Answer |
|---|---|
| Market bias | Neutral |
| Options-implied range (into September 21) | $696.51 – $733.25 (±2.57%, about ±$18.37) |
| Major support | $720.00 (September 21 put wall) — the whole chain's heaviest put strike sits far lower, at $705.00 |
| Major resistance | $720.00 (September 21 call wall, and the whole chain's heaviest call strike) |
| Max pain (September 21) | $715.00 |
| Dealer gamma regime (estimate) | Positive — hedging tends to dampen moves; flip level ≈ $725 |
| Volatility condition | Falling — IV rank 20/100 · premium rich: options priced about 5.2 vol points above delivered movement |
| Technical check | Mixed (bullish, 4-day and 7-day chart models) |
| Best-fitting strategy | Iron condor into September 21, conditional on the range holding |
| Analysis invalidated if | QQQ closes below $705.00 |
1 · What matters today
QQQ closed at $714.88 — essentially flat over the past five sessions and down 2.4% over the past month. Our read of options flow comes out genuinely neutral: the leading positioning score is a whisker above zero, short-dated sentiment leans mildly positive while the one-to-four-week bucket leans mildly negative, and neither side is winning. The options market is pricing a move of about $18.37 either way — roughly $696.51 to $733.25 — through the September 21 expiration. That expiration's max pain, the price where the most option value would expire worthless, sits at $715.00, basically on top of the current price.
The one thing that is not neutral: option prices are running about 5.2 vol points above the movement QQQ has actually delivered, richer than roughly 81% of this stock's own recent readings. That favors sellers of premium over buyers. Both chart models lean mildly bullish toward $716.50–$717.50. A close below $705.00 breaks the range read.
2 · What the options market is pricing
What changed this week
The headline change is in put positioning, not price. The put/call open-interest ratio — how many put contracts are held open for each call — went from 0.89 to 1.23 over five sessions, a 38% build, against a 14-day average of 1.22 and a 7-day average of 1.14. Put volume was even louder on Friday: 1.34 puts traded for every call, versus a 7-day average of 1.07 and a 60-day median near 0.94. That put-tilt in Friday's volume was unusually extreme even by this ETF's own recent standards.
The single biggest forward-looking open-interest change was the September 18 $675 put, which added 22,544 contracts to reach 43,643 open — deep, cheap downside insurance about 5.6% below spot, not a directional bet on a crash. On the other side, the September 18 $725 call appeared from nothing with 28,346 contracts of new open interest on 17,975 contracts of volume, about $4.2 million of premium changing hands. (Into the September 11 expiration that settled Friday, the $714 calls added 8,409 contracts — settled history now, not a live magnet.)
Implied volatility fell hard into the close: ATM IV dropped 11.9% on the day to 17.85%, is up 3.6% over five days, and down 27.9% over 30 days. And the trend read is flat across every horizon it can measure — the past week is −0.4%, the past month −2.4%, the past two-and-a-half months −1.3%. Nothing is trending; everything is chopping.
Expected move
Into the September 21 expiration, the options market is pricing a move of about ±2.57%, or ±$18.37 — that's the move implied by what at-the-money straddles cost, and it's a one-standard-deviation estimate, not a boundary. Around Friday's $714.88 close that maps to $696.51–$733.25.
| Expiration | Implied move | Range around $714.88 |
|---|---|---|
| September 14 | ±0.90% | $708.45 – $721.31 |
| September 18 | ±2.33% | $698.22 – $731.54 |
| September 21 (target) | ±2.57% | $696.51 – $733.25 |
| October 9 | ±4.91% | $679.78 – $749.98 |
The rungs step up smoothly with time — no kink, no hump, no single date the chain is bracing for. The three-day rung prices barely nine dollars of total movement, which is what a quiet, rangebound tape looks like in option prices.
Volatility
ATM implied volatility — the market's estimate of how much QQQ will move, baked into option prices — sits at 17.85%. IV rank is 20/100, meaning today's reading is cheaper than about 80% of the past year's; the percentile measure is lower still at 16. Current IV sits below both the 30-day average (19.7%) and the 90-day average (22.5%). The September 21 expiration's own at-the-money IV is lower again at 15.5%. The front-month term-structure read — comparing option prices across expiration dates — is unavailable today, an artifact of Friday being an expiry day, not missing data. The VIX overlay agrees with the calm: it sits near the bottom of its 52-week range (rank 13/100) and has tracked QQQ's own implied vol closely (60-day correlation 0.84).
Underneath, the stock has been unusually still: 20-day realized volatility is 12.69%, an unusually depressed reading compared against this ETF's own recent history. The 5-day-versus-20-day movement ratio is about typical at 0.88 — recent sessions have been no wilder than the month behind them, whipsaw days notwithstanding.
Premium rich or cheap. The gap between what options are priced for and what QQQ has actually delivered — the volatility risk premium — stands at about 5.2 vol points in sellers' favor, and it is richer than roughly 81% of this ETF's own readings over the past few months. Two weeks ago that gap was negative (options were priced below delivered movement); it flipped positive on September 1, peaked near 7.2 points on September 10, and eased to 5.2 on Friday as IV dropped. So the two lenses disagree in an interesting way: IV rank 20/100 says options are cheap versus the past year, while an 81st-percentile premium over delivered movement says they're expensive versus what this ETF has actually been doing lately. For a 10-day structure, the second lens is the one that gets paid — this week favors collecting premium rather than owning it, in size small enough that the absolute-cheap IV doesn't hurt if volatility snaps back.
Skew and sentiment
Puts and calls the same distance from the price don't cost the same: the 25-delta put is marked at 19.95% versus 15.12% for the equivalent call, so puts are running about 4.8 vol points over calls. That's real downside skew — traders pay up for crash protection in an index ETF as a matter of routine — but it's flatter than this ETF's own 60-day median of 5.8 points. Crash protection is a touch cheaper than usual, which our flow read scores as mild complacency rather than fear. Working against that: the same skew has steepened by about 1.2 vol points over the past five sessions, so the direction of travel is toward more put demand, not less.
Sentiment across the curve is mixed, and the file says so plainly. The 0–7 day bucket reads +23 (call open interest built by 71,867 contracts against 28,619 for puts), while the 7–30 day bucket reads −8 and the 60–120 day bucket −17, with put-side delta-weighted flow dominating both. Near-dated traders were leaning long into Friday's close; everyone further out was quietly adding downside. Against the 7-day averages (0–7d at +19, 7–30d at +9), the longer buckets have cooled noticeably.
The key levels map
| Level | Price | Why it matters |
|---|---|---|
| 52-week high | $748.65 | 4.51% above Friday's close |
| Swing resistance | $740.60 | Heuristic pivot cluster from recent swings |
| Gamma flip estimate | $725 (estimate) | One rough estimate places the dealer-hedging pivot here; also the strike where 28,346 September 18 calls were just opened |
| Swing resistance | $724.60 | Nearest heuristic pivot above spot |
| Call wall and put wall (September 21) | $720.00 | That expiration's heaviest call OI (1,396) and heaviest put OI (1,017) sit on the same strike; it is also the whole chain's heaviest call strike at 99,679 contracts |
| Upper Bollinger band (technical) | $719.86 | Resistance named by both chart reports |
| 20-day average | $715.67 | Price is 0.11% below it — dead flat |
| Max pain (September 21) | $715.00 | Where the most option value would expire worthless |
| Spot | $714.88 | Friday's close |
| 50-day average | $710.41 | Price 0.63% above; both chart models use it as their invalidation line |
| Largest gamma strike (chain) | $710.00 | Biggest total gamma·open interest concentration in the chain |
| Put wall (whole chain) | $705.00 | 110,928 puts open — the chain's single heaviest downside pile |
| Swing support | $702.77 | Heuristic pivot just under the put wall |
| Swing support | $689.46 | Next pivot down |
| 200-day average | $660.14 | 8.29% below price — the long-term uptrend is not in question |
Positioning and unusual flow
The September 21 expiration is a Monday expiry with thin open interest, and its wall structure reflects that: its heaviest call strike and heaviest put strike are the same strike, $720.00, with only 1,396 and 1,017 contracts respectively. That is a real reading, but it is a small one — the levels with mass behind them come from the full chain, where the heaviest call strike is also $720.00 (99,679 contracts) and the heaviest put strike is $705.00 (110,928). Worth naming the disagreement plainly: the September 18 monthly, one rung earlier, carries its own call wall at $710.00 (42,100 contracts) and put wall far out at $675.00 (43,643) — so the monthly's structure sits lower and wider than the target expiration's.
On dealer positioning, one rough estimate puts the whole chain in a positive-gamma regime, where market-maker hedging tends to dampen moves rather than amplify them, with the flip level around $725. The September 21 expiration's own estimate is positive as well. Note the oddity: that flip estimate sits above the current price, and spot is unusually far below it by this ETF's own standards — treat both numbers as estimates built on an assumed dealer sign convention, not observed inventory.
The loudest single-day flow was concentrated in three-day options: the September 14 $716 puts traded 48,613 contracts against 106 held open, the $714 puts 43,147 against 82, and the $717 puts 28,015 against 52 — turnover ratios in the hundreds. That's short-dated, same-week hedging and day-trading churn around the current price, about $15.1 million, $9.6 million and $10.2 million of premium respectively. It tells you where the attention is (right at the money), not where anyone thinks price is going. The more durable item is that September 18 $725 call build — someone paid roughly $4.2 million for upside two weeks out, right at the gamma flip estimate.
3 · Technical check
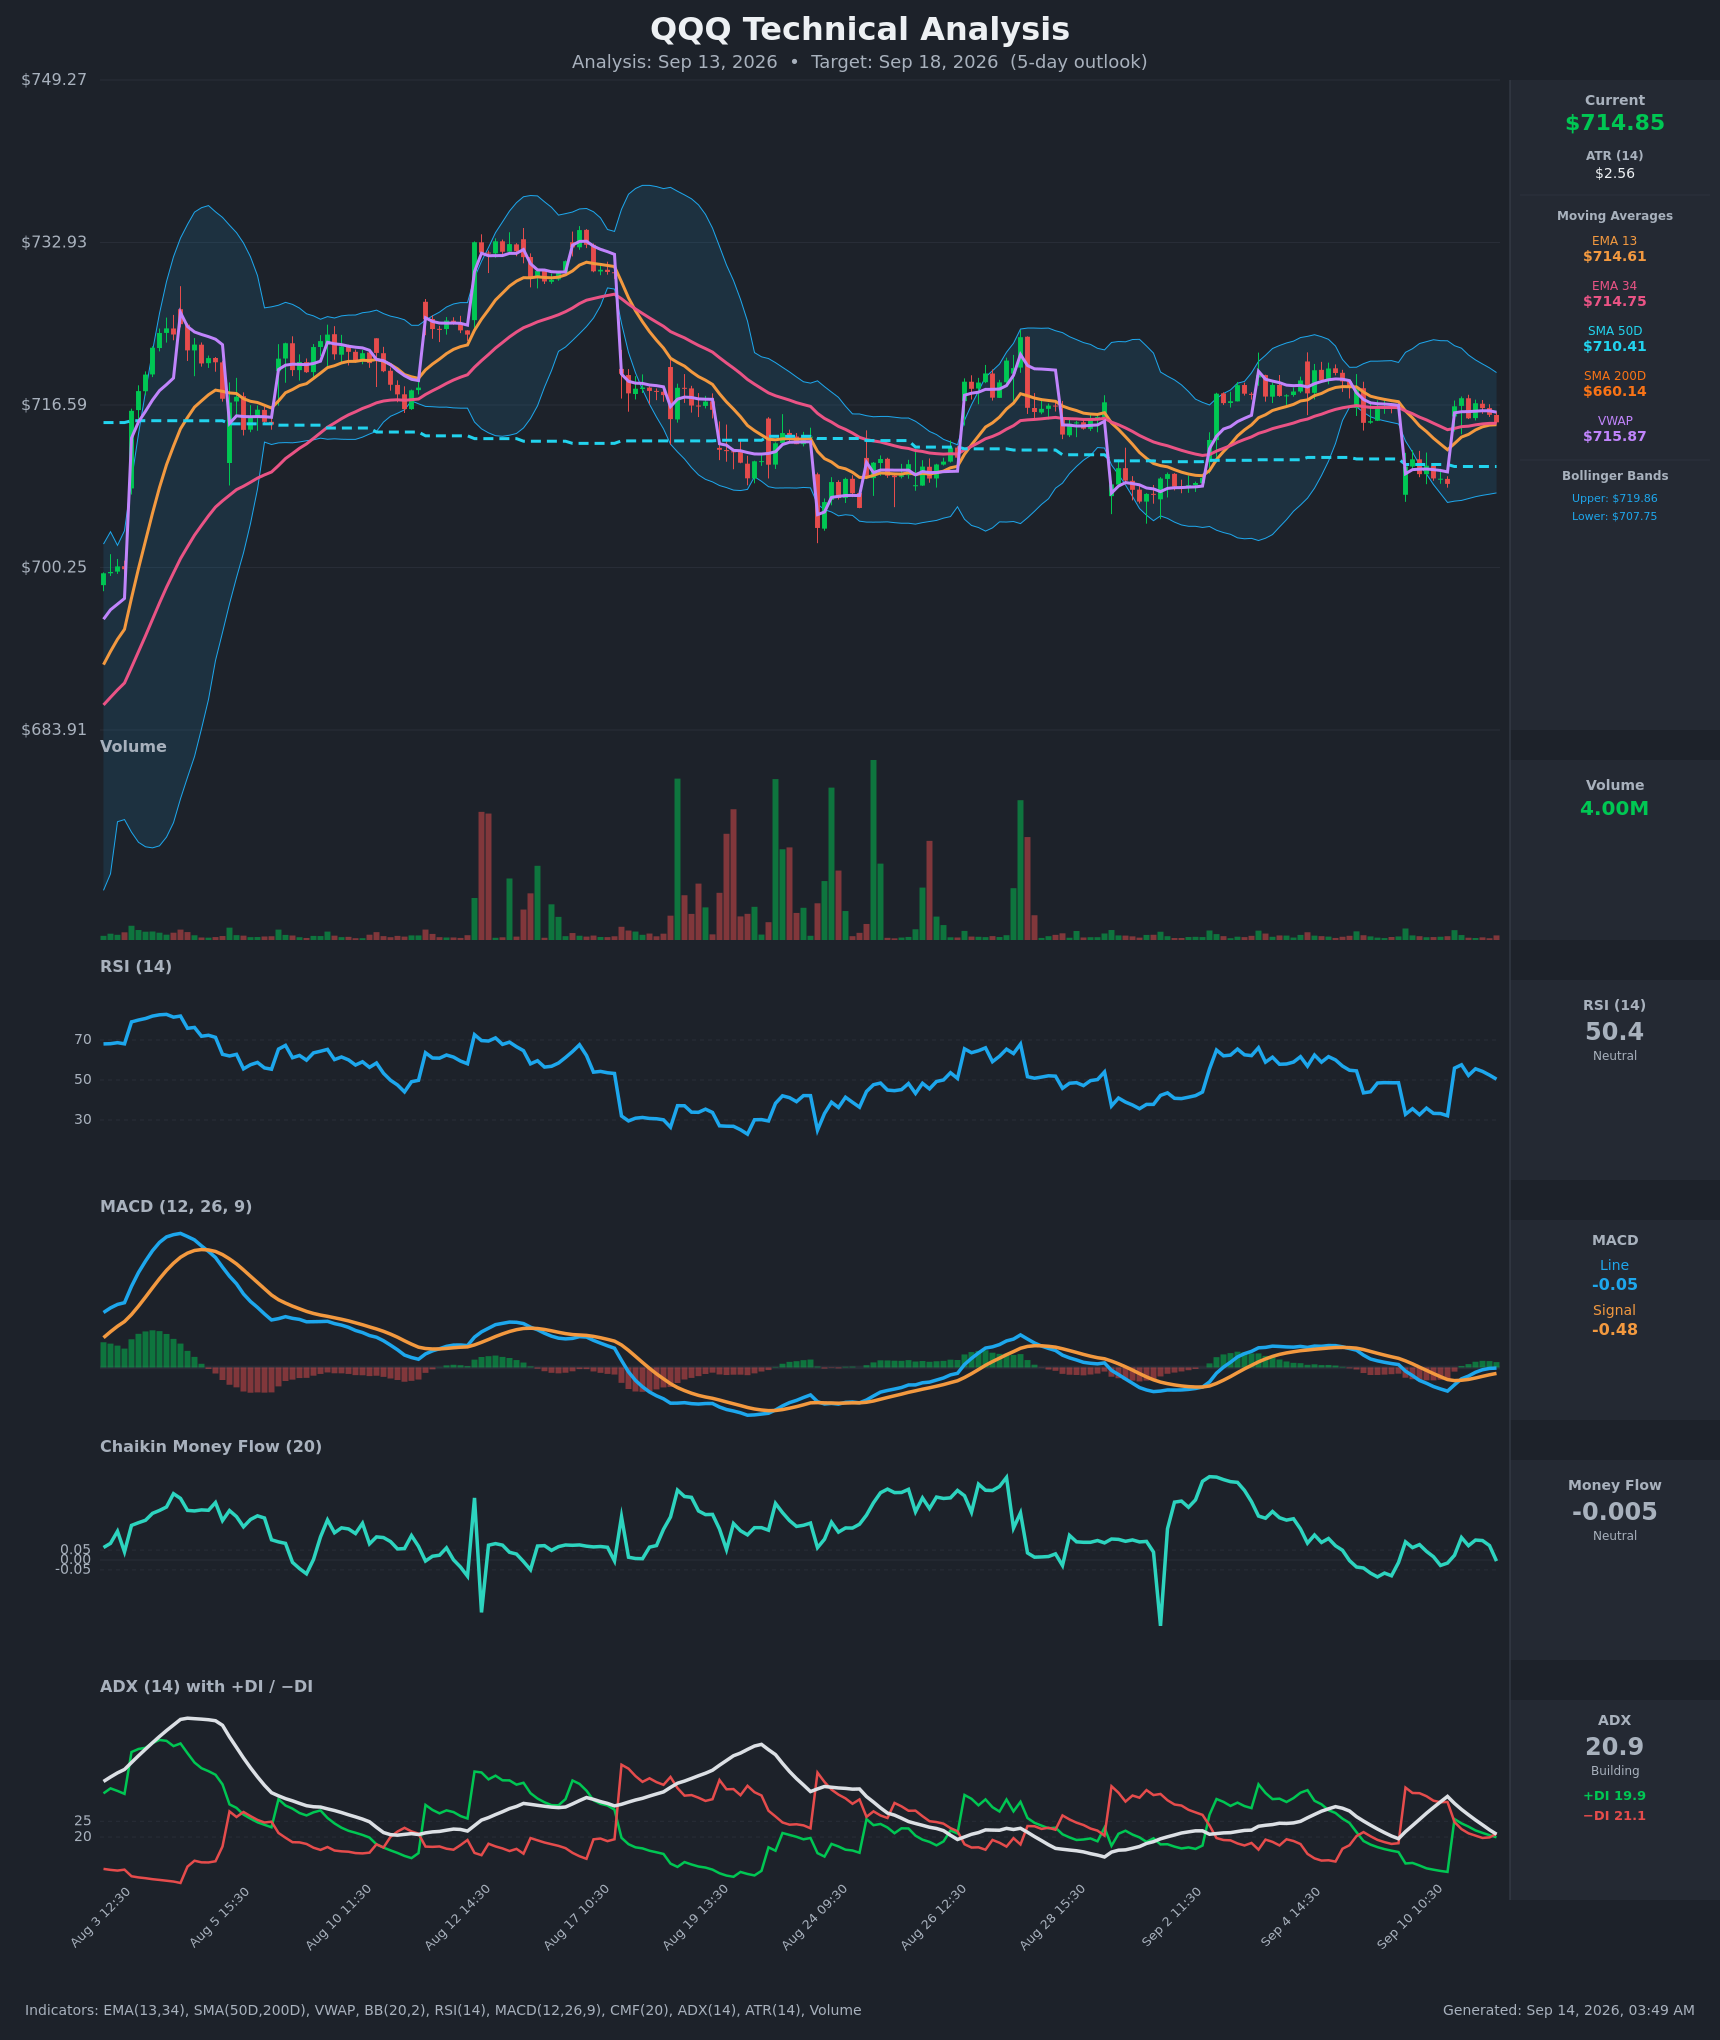
Both chart reports lean bullish, and both do it apologetically. The 4-day model targets $716.50 by September 18 with a projected range of $703.50–$726.00. The 7-day model, which lands exactly on our target expiration, targets $717.50 with a projected range of $703.50–$726.50. Its reasoning: price is holding above a rising 50-day average at $710.41 and far above the 200-day at $660.14, MACD is curling up off the September 10 low, and the short-term moving averages are re-converging after a whipsaw.
The honest read of the indicator set, though, is indecision. ADX at 20.9 is below the 25 threshold that marks a real trend, with the directional lines nearly on top of each other and −DI marginally ahead. RSI is 50.4. Money flow is essentially zero. The reports' own third scenario — continued chop between roughly $708 and $720 — is the one that squares with what the options data shows.
Classification: Mixed. Direction differs modestly (chart models bullish, options positioning flat), but both targets sit comfortably inside the options-implied range, and the chart models' projected band is narrower than the options band on both sides. That combination didn't move the bias, but it did shade strike selection: the bearish structure below sits at and above $720 rather than beneath it, because a mildly bullish technical picture argues against selling calls into the money.
Model vs. Market: The options market implies $696.51–$733.25 into September 21; the 7-day technical model targets $717.50 inside a $703.50–$726.50 band. The chart model is effectively saying "nothing happens" while the options market is charging for a $37-wide envelope — that gap is the premium a seller is being paid to collect, and the risk they are being paid to carry.
Full technical write-ups: 4-day report → · 7-day report →
4 · Three ways the next 7 days can go
If QQQ pushes above the call wall ($720.00): that strike carries the single heaviest pile of call open interest in the entire chain, and strikes like that tend to slow rallies as the hedging against them builds. Above it, positioning thins out quickly until $724.60 and the $725 gamma flip estimate, where that fresh September 18 call build sits. A clean push through $725 would take price out of the zone where, on this estimate, hedging flows have been cushioning moves.
If QQQ drifts between the walls: this is the base case the positioning describes. Max pain for September 21 is $715.00, twelve cents from Friday's close, the 20-day average is $715.67, and the estimated gamma regime is the kind that dampens rather than amplifies. Expiring open interest and hedging flows in that state tend to pull price toward the middle of the range rather than push it out of one end. The halfway checkpoint on September 18 is the tell: a close still pinned between $710 and $720 there means the pin held.
If QQQ breaks below the put wall ($705.00): that's where 110,928 puts are held open across the chain, and a break through it puts price into the $702.77 swing-support pocket with the next pivot down at $689.46. It would also take price meaningfully further below the $725 flip estimate — spot is already unusually far beneath it for this name — and on that rough estimate, the further below, the less the hedging cushion helps.
5 · Three defined-risk structures
Prices are end-of-day midpoints as of 2026-09-11. All structures are hypothetical. Verify live prices before trading — these will be stale by the open.
If you expect the range to hold: iron condor (September 21)
- Trade: Sell the September 21 $705/$700 put spread and the $722/$727 call spread (four legs, $5 wide on each side). You collect premium up front and keep it all if QQQ finishes between the short strikes.
- Credit: $2.73 · Max profit: $273 · Max loss: $227 · Break-evens: $702.27 and $724.73
- Why it fits: The short strikes sit just outside the levels with mass — $705.00 is the chain's heaviest put strike, $722 is above the $720.00 call wall — and both break-evens sit outside the options-implied $696.51–$733.25 envelope's midsection while staying inside it at the extremes. The premium justification is the volatility risk premium: about 5.2 vol points of richness at the 81st percentile of this ETF's own recent readings.
- Makes sense only if: you believe the chop continues. This loses if QQQ makes a decisive directional move in either direction inside ten days.
- Invalidated if: QQQ closes below $705.00 or above $724.60.
- Managing it: close at roughly 50% of max credit; exit the whole position by September 18 regardless of profit, since the last three days carry most of the gamma risk; if either short strike trades through, close that side rather than hope.
- Liquidity note: the $705 puts trade 8¢ wide and the $700 puts 9¢; the $722 calls 9¢ and the $727 calls 8¢. The $727 long leg has only 5 contracts of open interest — the quote is tight but you may be the only one there, so work the order.
- Analyze this position →
If you lean bullish: short put spread (September 21)
- Trade: Sell the September 21 $710 put, buy the $705 put. You collect a credit and keep it if QQQ holds above $710 at expiration.
- Credit: $1.40 · Max profit: $140 · Max loss: $360 · Break-even: $708.60
- Why it fits: The short strike sits at the chain's largest gamma concentration ($710.00) and just under the 50-day average at $710.41, which is exactly the level both chart models name as the line their bullish case dies on. The long leg buys protection right at the chain's heaviest put strike. The rich premium makes selling rather than buying the right side of this.
- Makes sense only if: you think the mildly bullish technical read is the one that resolves, and the 50-day average keeps holding.
- Invalidated if: QQQ closes below $710.41.
- Managing it: take 50% of max credit if it comes quickly; because the near-term trend read is flat rather than supportive, take profit earlier than you would in a trending tape, and exit by September 18 rather than carrying into the final sessions.
- Liquidity note: the $710 puts trade 10¢ wide (5.44/5.54) and the $705 puts 8¢ — fills are easy on both.
- Analyze this position →
If you lean bearish: short call spread (September 21)
- Trade: Sell the September 21 $720 call, buy the $725 call. You collect a credit and keep it if QQQ finishes below $720.
- Credit: $1.93 · Max profit: $193 · Max loss: $307 · Break-even: $721.93
- Why it fits: The short strike is the call wall for this expiration and the heaviest call strike in the whole chain at 99,679 contracts — the level where overhead open interest tends to slow rallies. The long leg sits at the $725 gamma flip estimate, capping the damage exactly where the character of hedging flows is estimated to change.
- Makes sense only if: you expect the September rangebound behavior to cap the upside; note that both chart models lean the other way, so this is the structure fighting the technical read.
- Invalidated if: QQQ closes above $724.60.
- Managing it: close at ~50% of max credit; if QQQ closes above $720.00 at any point, close rather than wait for the wall to do the work.
- Liquidity note: the $720 calls trade 13¢ wide on a $4.645 mid (about 2.8%) with 1,396 contracts open; the $725 calls trade 9¢ wide. Both are workable.
- Analyze this position →
If none of these: no trade
The premium here is genuinely rich against delivered movement, so standing aside means passing on the clearest edge in the data — which is exactly why it deserves an argument. Here it is: IV rank is 20/100, meaning absolute option prices are near the bottom of their yearly range, and a short premium position entered at cheap absolute levels has more room to be hurt by a volatility expansion than helped by further compression. The dollar credits above reflect that — $140 to $273 of maximum profit against $227 to $360 of risk, ratios that leave no margin for sloppy management. On top of that, the September 21 expiration is a thin Monday expiry whose own wall structure (both walls stacked on $720.00 with barely a thousand contracts each) is too small to lean on. If you can't watch the position into September 18, or if a 10-day structure with those payoff ratios doesn't clear your bar, waiting for a higher IV rank to sell into is a defensible call.
6 · Quick FAQ
What is QQQ's expected move this week? About ±$18.37, or ±2.57%, into the September 21 expiration — a $696.51–$733.25 range around Friday's $714.88 close, per straddle pricing as of 2026-09-11.
Is QQQ expected to go up or down over the next week? Options positioning as of September 11 reads neutral — the near-dated bucket leans mildly bullish while the one-to-four-week bucket leans mildly bearish, and the leading positioning score is a whisker above zero. That's a read of what traders have done, not a forecast. The actionable map is the $696.51–$733.25 range, with $705.00 below and $720.00 above.
Are QQQ options expensive right now? Two answers, and they disagree. IV rank 20/100 says option prices are lower than about 80% of the past year's readings. But they're running roughly 5.2 vol points above the movement QQQ has actually delivered over the past 20 sessions — richer than about 81% of this ETF's own recent readings. For a 10-day trade, that second lens favors selling premium; just keep size modest, because the absolute level of volatility is low enough to expand.
Where is QQQ's biggest options support and resistance? For the September 21 expiration, both the call wall and the put wall sit on $720.00 — an unusual stack at a lightly traded expiry. Across the whole chain, the heaviest call strike is $720.00 (99,679 contracts) and the heaviest put strike is $705.00 (110,928 contracts).
What invalidates this read? A close below $705.00. That breaks the chain's heaviest put strike and opens the $702.77 pocket beneath it.
Methodology & disclosures. Data: end-of-day options-chain snapshot for QQQ, 2026-09-11, generated 2026-09-14T03:49:35.190Z. Prices shown are midpoints and will differ from live markets. Momentum/positioning scores and volatility-premium comparisons are descriptive measurements of past option flow and past price movement — not investment advice, signals, forecasts, or guarantees. All trade structures are hypothetical. Every structure shown has a defined maximum loss; you can lose the entire max-loss amount. Options involve substantial risk and are not suitable for all investors.