QUBT Options Are Pricing a ±$0.65 Move Into Friday — and the Chart Model Disagrees With the Flow
QUBT's options market implies a $7.34–$8.64 range into the September 18 expiration, with call-side skew and a fresh positioning turn pointing gently higher while both technical models lean the other way. Here's the level map and three defined-risk ways to trade the gap.

The options market implies a $7.34–$8.64 range into the September 18 expiration; here's what's driving it and three defined-risk ways to trade it.
Published Sunday, September 13, 2026 · Data as of the September 11 close
Explore the live QUBT options data in the Detailed Options Analyzer →
Quick answer
| Item | Answer |
|---|---|
| Market bias | Neutral with a bullish tilt |
| Options-implied range (into Friday, September 18) | $7.34 – $8.64 (±8.12%, or about ±$0.65) |
| Major support | $10.00 — the September 18 put wall, which sits deep in the money above spot; the working floor traders are watching is $7.79 |
| Major resistance | $10.00 — the September 18 call wall |
| Max pain (September 18) | $10.00 |
| Dealer gamma regime (estimate) | Positive — hedging tends to dampen moves; flip level ≈ $15.00 (estimate) |
| Volatility condition | Falling — IV rank 7.9/100 · premium fair: options are priced roughly 0 vol points above delivered movement |
| Technical check | Diverges (bearish, 3-day and 5-day models) |
| Best-fitting strategy | Long call vertical (September 18 $8.00/$8.50), conditional on holding $7.79 |
| Analysis invalidated if | QUBT closes below $7.79 |
1 · What matters today
QUBT closed at $7.99, and the options market is pricing a move of about $0.65 in either direction over the next five days — a $7.34 to $8.64 range into Friday's expiration. That number comes from what straddles cost: it's the move the options market is pricing in, not a target.
The read from the flow tilts gently higher. Calls are far richer than puts, the leading positioning gauge turned sharply positive on Friday, and momentum flipped from bearish to bullish on the same day. That's a fresh, unconfirmed turn inside a stock that is still down 10.1% over 20 trading days — so the tilt is exactly that, a tilt.
The single level that matters: $7.79. Price has chopped above it since September 4, and both technical models treat a close below it as the breakdown trigger. Speaking of which — the chart models lean bearish here, which is the most interesting tension in this week's setup.
2 · What the options market is pricing
What changed this week
Not much happened to the price — QUBT is up 0.38% over the last five sessions — but a lot happened underneath it. Implied volatility (the market's estimate of how much QUBT will move, baked into option prices) fell another 4.2% on the day and 3.5% over the week to 62.3%, and it is now 35.5% below where it sat 30 days ago. That puts it well under its own 30-day average of 77.2% and its 90-day average of 93.1%.
Positioning shifted the other way from the price. Put volume relative to call volume came in at 0.41 — for every put contract traded, there were roughly 2.4 calls — against a 7-day average of 0.50 and a 14-day average of 0.47. That's a call-tilted day. Yet open interest (contracts currently held open) drifted the other way: puts per call held open rose to 0.59 from a 14-day average of 0.58, because the single biggest change in open interest of the day was a build of 9,995 contracts in the October 16 $9 puts, taking that line to 17,670 open. Almost the same size build landed in the October 16 $9 calls (+9,872, to 12,267) — a paired build on both sides of one strike, more consistent with a structured position than a directional bet. Total option volume ran at 0.74× its 20-day average, so this was a quiet tape.
The horizon reads disagree, and that's worth naming. The short-term trend read is flat, but the 20-day and 50-day reads are both bearish — price is down 10.1% over a month and 15.3% over roughly two and a half. Against that, Friday produced a fresh momentum crossover from bearish to bullish, the first in about three weeks. The near-term flow and the bigger trend are pointing in different directions, which is the main reason the structures below are short-dated.
Expected move
Into Friday, September 18, the market is pricing ±8.12% — about ±$0.65 around the $7.99 spot, or a $7.34 to $8.64 range. Here is the ladder:
| Expiration | Implied move | Range around $7.99 |
|---|---|---|
| Friday, September 18 (7 days) | ±8.12% | $7.34 – $8.64 |
| Friday, September 25 (14 days) | ±8.52% | $7.31 – $8.67 |
| Friday, October 2 (21 days) | ±17.15% | $6.62 – $9.36 |
| Friday, October 16 (35 days) | ±19.99% | $6.39 – $9.59 |
The ladder is not smooth: the September 25 rung prices an at-the-money volatility of just 43.5% while the October 2 rung prints 71.5%. On a sub-$10 stock with wide quotes, per-rung reads bounce around like that, and the two-week rung is the odd one out rather than a signal in itself. The cleaner takeaway is that anything past three weeks is priced for roughly double the move of this Friday.
Volatility
At-the-money implied volatility is 62.3%, with an IV rank of 7.9/100 — meaning today's IV sits cheaper than roughly 92% of the past year's readings for this name. That rank is also slightly below its own 7-day average of 9.9 and 14-day average of 10.2, so the compression is still going. The front-month read is unavailable in this snapshot (Friday was an expiration day, which makes that particular figure uncomputable), so there is no clean term-structure comparison to quote today.
Two "vs its own norm" readings are worth pulling out, both of which say the same thing: the stock has gone quiet. Twenty-day realized volatility — how much QUBT has actually been moving — is 62.3%, unusually low compared against this stock's own recent history. And the ratio of five-day to 20-day movement is 0.63, also well below its norm: the last week has been calmer than the month behind it.
Premium rich or cheap. The volatility risk premium — the gap between how much movement options are priced for and how much QUBT has actually delivered — is essentially zero right now, about 0.0 vol points, and sits at the 50th percentile versus this stock's own recent readings. Translation: option sellers are collecting almost exactly what realized movement has been costing them. That's a change from a week ago, when the same gap was about 18 vol points on September 8 and still 3 points on September 10 before draining away entirely. Combined with an IV rank of 7.9, the verdict is that neither side is being handed an edge: premium is fair, not rich, so selling it for its own sake has no cushion, and owning it is cheap in year-over-year terms but not obviously underpriced against what the stock is delivering.
Skew and sentiment
The skew here is the loudest number in the file, and it runs the opposite way to most stocks. Puts and calls the same distance from the stock price don't cost the same — and in QUBT, it's the calls that are expensive. The 25-delta call prints an implied volatility of 113.8% against 71.1% on the 25-delta put, a gap of 42.6 vol points in favor of calls, versus a 60-day norm of about 9 vol points. Traders are paying up for upside, not for crash protection, and they're doing it far more aggressively than this name's own recent history would suggest. That reading is stretched well above its norm, and the pace matters too: the put-side premium has bled off by 38.3 vol points over the last five sessions.
Sentiment across expirations is genuinely mixed rather than aligned. The shortest bucket (0–7 days) reads slightly negative at −6, driven by small put builds; the 7–30 day bucket is mildly positive at +8; the 30–60 day bucket is the most constructive at +23 on call-tilted delta-weighted flow; and the longest bucket leans −10. No single regime dominates. Meanwhile the leading positioning composite — a flow-only read built from skew, volume tilt and new open interest — jumped to +48 on Friday from around zero mid-week. Put together: short-dated flow is call-tilted and the skew is unusually complacent, while open-interest drift stays mildly defensive.
The key levels map
| Level | Price | Why it matters |
|---|---|---|
| Gamma flip (estimate) | $15.00 | One rough estimate puts the dealer-hedging pivot here — far above spot; spot is unusually far below it versus this name's own history |
| Call wall / put wall / max pain, September 18 | $10.00 | The week's heaviest call OI (11,313) and heaviest put OI (5,421) land on the same strike, which is also max pain — the price where the most option value would expire worthless |
| Whole-chain heaviest call strike | $10.00 | 25,408 calls open across all expirations — the same ceiling the week's own wall names |
| 200-day moving average | $9.45 | Close sits 15.4% below it; the long-term trend is still down |
| $9 strike | $9.00 | Second-heaviest gamma strike chain-wide and where the week's biggest open-interest build landed (October 16) |
| Top of implied range | $8.64 | Upper edge of Friday's expected move |
| 50-day moving average | $8.37 | 4.5% above the close; first trend-level resistance |
| 20-day moving average | $8.30 | 3.7% above the close |
| Technical resistance | $8.23 | Upper Bollinger band and the top of the September chop range on both chart models |
| Whole-chain put wall / heaviest gamma strike | $10.00 | 24,224 puts open across all expirations and the single largest gamma concentration — note this disagrees with the September 18 expiration's own put wall at $10.00 |
| Spot / last close | $7.99 | Where we start the week |
| Swing support | $7.80 | Heuristic swing-pivot cluster (estimate) |
| Technical support / invalidation | $7.79 | Lower Bollinger band and the floor of the September range; a close below it kills this article's read |
| Next swing support | $7.41 | Heuristic level beneath the range (estimate) |
| Bottom of implied range | $7.34 | Lower edge of Friday's expected move |
Positioning and unusual flow
One rough estimate has net dealer gamma positive for this week's expiration, meaning market makers hedging what they've sold would tend to dampen moves rather than amplify them into Friday. Treat that as an estimate built on an assumed convention, not observed inventory — and note the same estimate places its pivot at $15.00, far above spot, which is the kind of reading that arises when call open interest is piled well out of the money.
Three live flow items stood out, none of them expired:
- September 25 $9 calls: 1,087 contracts traded against 529 held open — turnover above 2× open interest, which is the cleanest "someone opened something new" print of the day, two weeks out and well above spot.
- October 16 $7 calls: 1,007 contracts and $121,343 of premium changed hands, the largest dollar figure in the chain. That strike is deep in the money, so this is closer to a stock-replacement trade than a lottery ticket.
- September 18 $8 calls: 815 traded with open interest rising 467 to 1,482 — new positioning right at the money into Friday, which is exactly where this week's gamma concentration sits.
3 · Technical check
Both chart models lean bearish, and both are fresh (generated September 13 against the September 11 data). The 3-day model targets $7.92 with a projected range of $7.78 to $8.16; the 5-day model, which lands on this article's own target date, targets $7.95 with a projected range of $7.70 to $8.25. Both of those projections are the chart tool's own forecast, not what the options are pricing.
Classification: diverges. The direction contradicts the options-flow tilt, even though both model targets and both model ranges sit comfortably inside the wider $7.34–$8.64 the options market is pricing. The models' reasoning is trend-based: price remains below the 50-day ($8.37) and 200-day ($9.45) averages, money flow has been on the distribution side all month, and the recent bounce came without a volume expansion. The most decisive indicator read is ADX at 15.8 with the directional lines essentially crossed at the same level — a textbook non-trending market, which argues that neither side has taken control. Both write-ups assign only a 35% probability to their own bearish breakdown scenario and 45% to simple range continuation.
Model vs. Market: The options market implies $7.34–$8.64 into Friday; the 5-day technical model targets $7.95 inside a $7.70–$8.25 band. The chart is saying "drift slightly lower inside a tight range" while the options flow is saying "traders are paying up for upside." The gap resolves on $7.79 — a close through it hands the argument to the chart; a close back above $8.23 hands it to the flow.
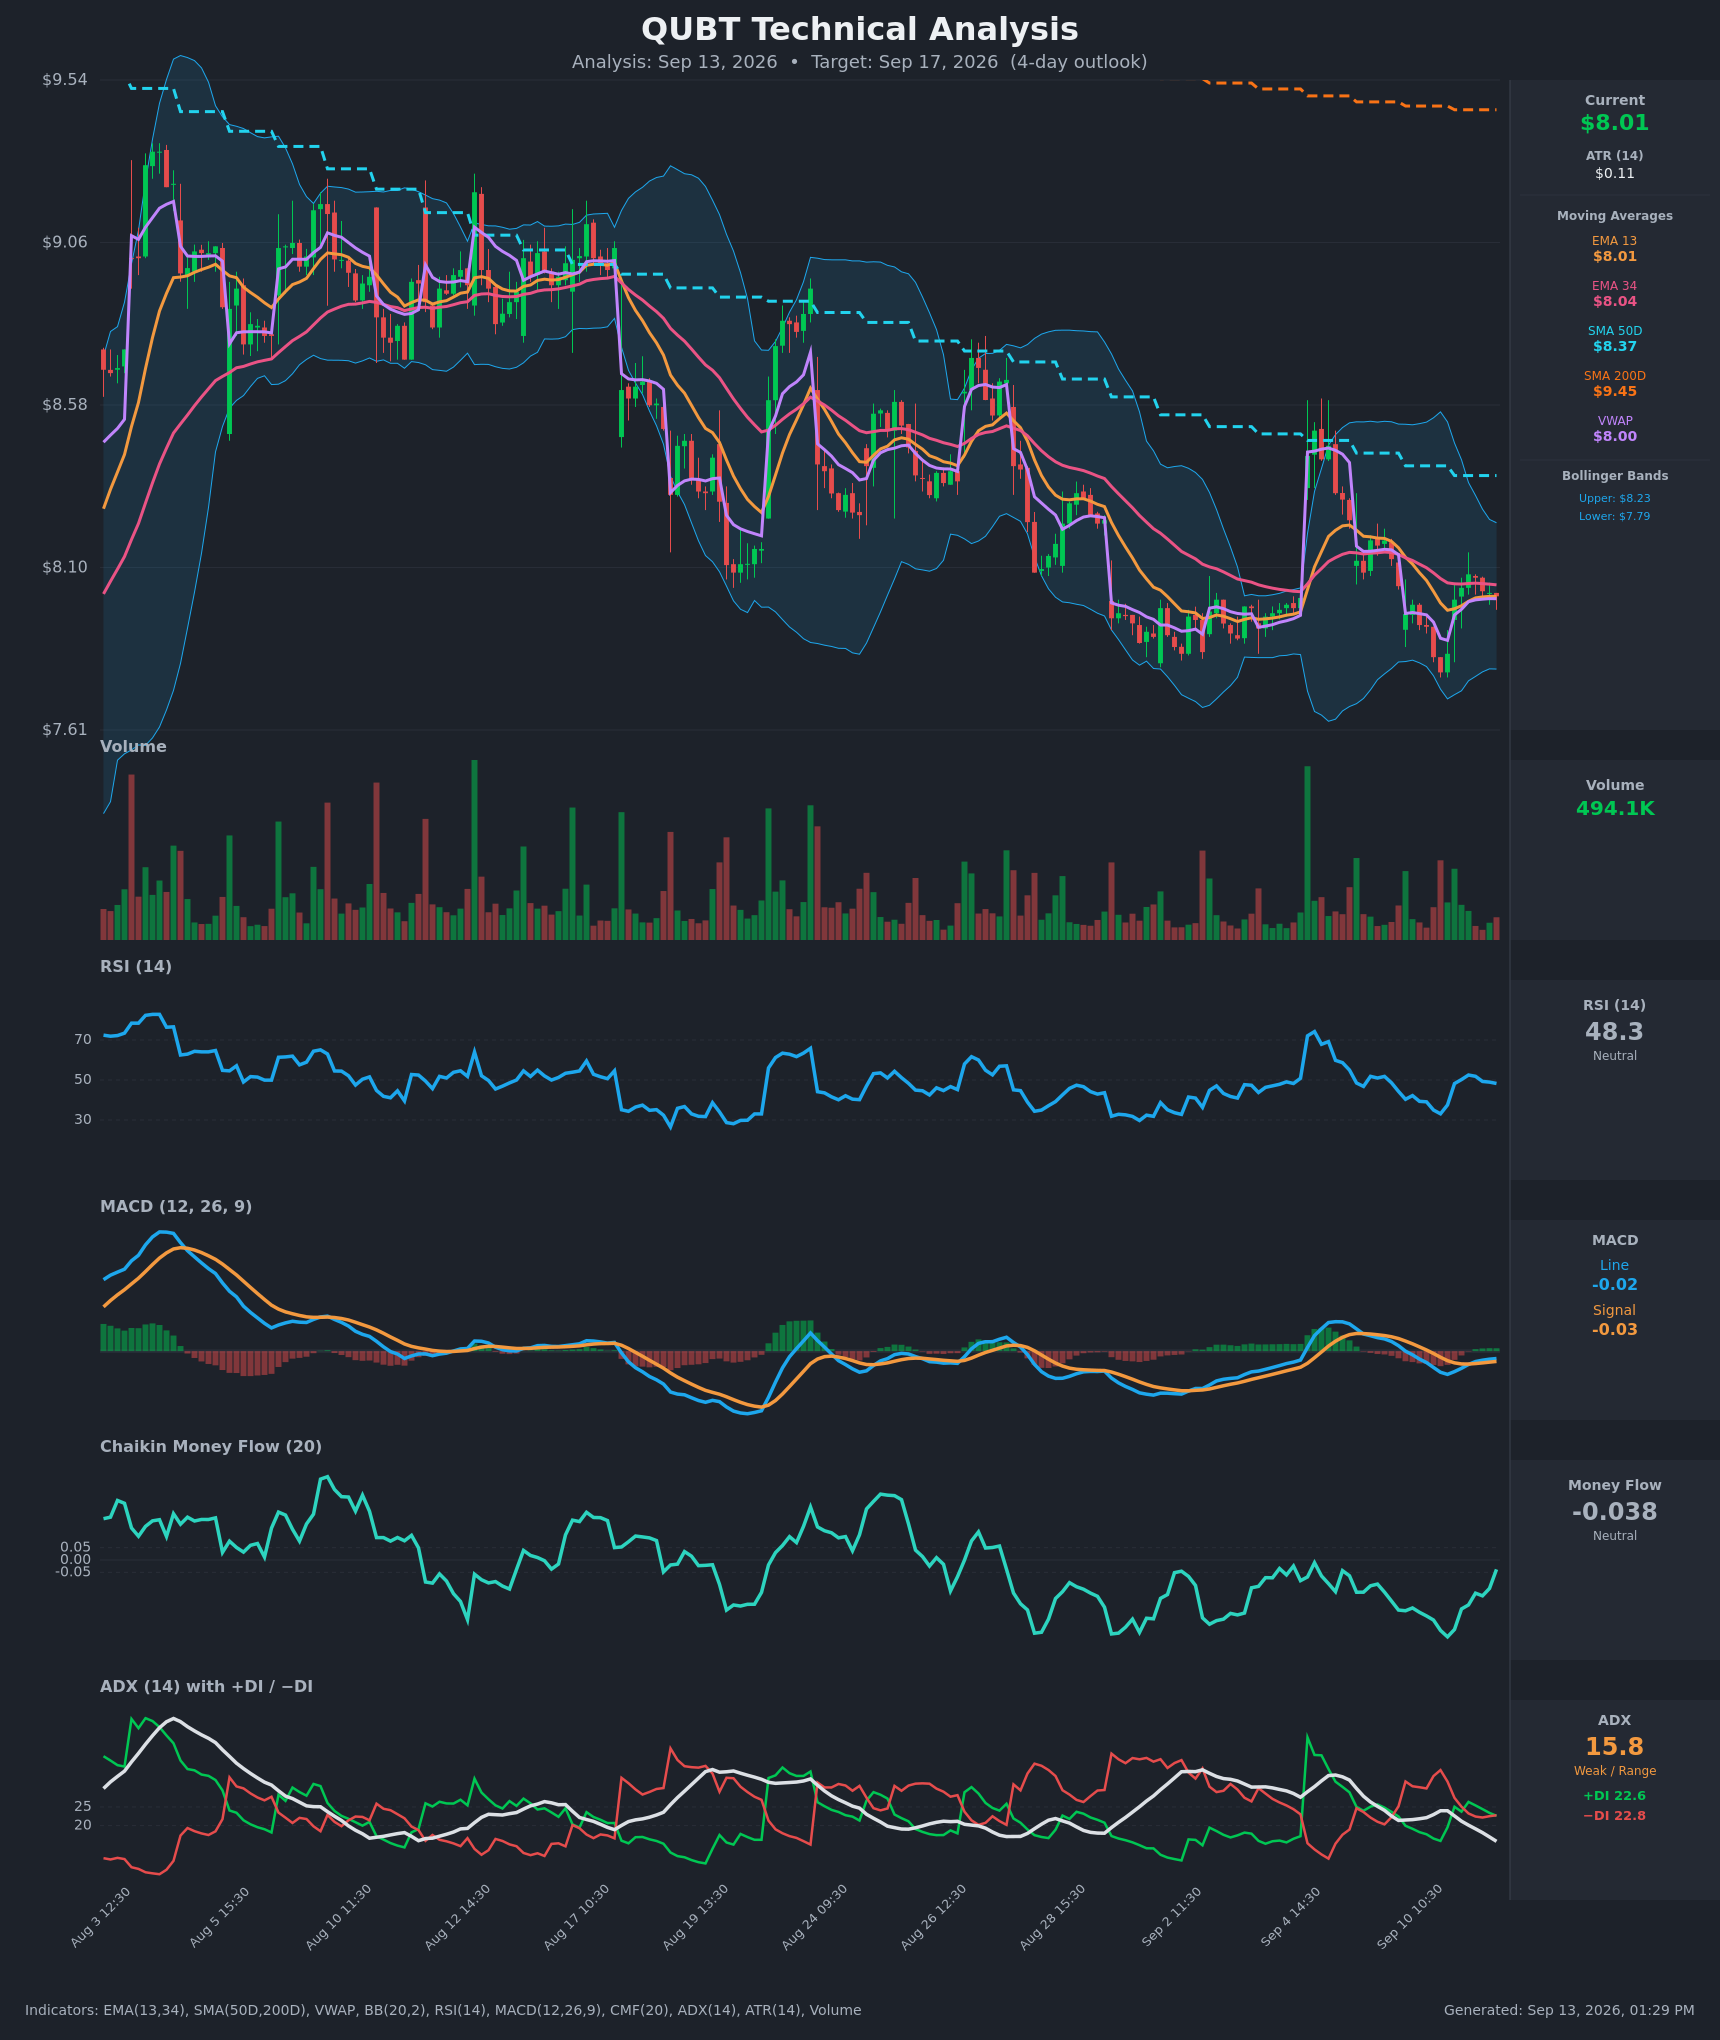
How the technicals adjusted the trades below: they didn't flip the bias, but they pulled the bullish structure's short strike in to $8.50 (just above the models' $8.25 ceiling) rather than reaching for $9.00, and they are the reason the bearish structure gets equal billing.
Full technical write-ups: 3-day report → · 5-day report →
4 · Three ways the next five days can go
If QUBT pushes toward the call wall ($10.00): it first has to clear $8.23 and then the 50-day average at $8.37, both of which sit inside the implied range. The heaviest call open interest for Friday is stacked at $10.00, well beyond the top of the expected move — so there is no meaningful overhead options barrier until the stock is roughly 25% higher. Positioning tends to cap rallies at walls; here the wall is too far away to do that job this week, which makes the $8.64 range edge the more realistic practical ceiling.
If QUBT drifts between the levels: this is the base case the positioning supports. Max pain for Friday is $10.00 — far above spot, so the usual "price gravitates toward max pain" story has no pull here; there simply isn't enough open interest below spot to drag anything. With the dealer-gamma estimate for this expiration reading positive, hedging flows would tend to dampen rather than amplify moves, and the $8.00 strike carries the largest gamma concentration in the entire chain. A quiet week that pins near $8.00 is the path of least resistance.
If QUBT breaks below $7.79: the next heuristic shelf is $7.41 and then the range floor at $7.34. Spot is sitting unusually far below the estimated gamma flip for this name, which is a reminder that the "hedging cushions the move" story is an estimate built on an assumption, not a guarantee. A volume-backed break of $7.79 is the scenario both chart models are pointing at, and it is the line that invalidates everything above.
5 · Three defined-risk structures
Prices are end-of-day midpoints as of September 11. All structures are hypothetical. Verify live prices before trading — these will be stale by the open.
If you lean bullish: long call vertical
- Trade: Buy the September 18 $8.00 call, sell the September 18 $8.50 call
- Debit: $0.15 ($15 per spread) · Max profit: $35 · Max loss: $15 · Break-even: $8.15
- Why it fits: With IV rank at 7.9/100 and the premium gap versus delivered movement sitting at zero, there is no edge in selling volatility here — so the bullish expression is a debit, not a credit. It also works with the skew instead of against it: the $8.00 call you buy carries a 53.5% implied volatility while the $8.50 call you sell carries 60.8%, so you're buying the cheaper strike and selling the richer one.
- Makes sense only if: you think Friday's positioning turn — call-tilted volume, a leading composite at +48, skew flattening 38 vol points in a week — leads price rather than lags it.
- Invalidated if: QUBT closes below $7.79.
- Managing it: This is a five-day trade with a short-term signal fighting a two-month downtrend, so take profits early rather than holding for the full $35 — if QUBT tags $8.50 before Thursday, close it. If it closes below $7.79 at any point, close for whatever's left; the thesis is gone.
- Liquidity note: Both legs traded a penny wide on Friday (the $8.00 calls 3.9% of mark, the $8.50 calls 9.5%), with 815 and 786 contracts respectively — fills are easy.
- Analyze this position →
If you expect the range to hold: iron condor
- Trade: Sell the September 18 $7.50 put / buy the $7.00 put, and sell the September 18 $8.50 call / buy the $9.00 call
- Credit: $0.115 ($11.50 per condor) · Max profit: $11.50 · Max loss: $38.50 · Break-evens: $7.385 and $8.615
- Why it fits: A credit spread pays you up front and wins if price stays away from your short strikes. Those break-evens sit almost exactly on the $7.34–$8.64 implied range edges, which is the honest definition of a fair-priced condor. The base case supports it: the dealer-gamma estimate for this expiration is positive (hedging dampening moves), realized movement over the past five days is running well below its own monthly norm, and both chart models assign their highest probability — 45% — to plain range continuation.
- Makes sense only if: you're comfortable risking $38.50 to make $11.50. With premium merely fair rather than rich, this structure is a view on quiet, not a volatility-selling edge.
- Invalidated if: QUBT closes below $7.79 or above $8.23 — either break puts a short strike in play well before expiration.
- Managing it: Close at roughly 50% of max credit rather than holding into Friday's close; if either short strike is touched, close the threatened side instead of hoping.
- Liquidity note: The short strikes are fine (the $7.50 puts and $8.50 calls both quoted a penny wide), but the wings are thin — the $7.00 puts show a $0.01/$0.03 market and the $9.00 calls $0.04/$0.05. Expect to give up a cent or two per wing on entry, which is meaningful against $11.50 of credit. Work the order as a package.
- Analyze this position →
If you lean bearish: long put vertical
- Trade: Buy the September 18 $8.00 put, sell the September 18 $7.50 put
- Debit: $0.19 ($19 per spread) · Max profit: $31 · Max loss: $19 · Break-even: $7.81
- Why it fits: This is the structure that agrees with both chart models and with the 20-day and 50-day trend reads. It also buys the cheap side of the skew — puts are priced 42.6 vol points under calls at the 25-delta, so downside protection is the discounted expression here, not the crowded one.
- Makes sense only if: you want the breakdown scenario specifically, not a drift. Be clear-eyed: the break-even of $7.81 is below both chart targets ($7.92 and $7.95), so this trade needs the 35%-probability breakdown branch to fire, not the 45% range-continuation one.
- Invalidated if: QUBT closes above $8.23 — the top of the September chop range and the models' own stated invalidation.
- Managing it: If $7.79 gives way on volume, take profits into the move toward $7.41 rather than waiting for expiration; if Friday arrives with price still above $7.90, close and accept the partial loss rather than gambling on the last session.
- Liquidity note: The $8.00 puts were the most heavily traded contract in the expiration (810 contracts, a penny wide at 3.8% of mark); the $7.50 puts traded 197 contracts, also a penny wide. Clean fills on both.
- Analyze this position →
If none of these: no trade
There's a legitimate case for standing aside this week. IV rank at 7.9/100 means credit structures collect very little, and the premium-versus-delivered-movement gap has drained to zero, so the condor above is not being paid for taking risk in any meaningful sense — it's a bet on quiet with a 3.3-to-1 loss-to-gain ratio. On the other side, the directional read is a one-day positioning turn inside a downtrend that both chart models still respect, and Friday's total option volume was only 0.74× its 20-day average, which is a thin tape to build conviction on. If you need an edge rather than a view, this setup doesn't offer one; waiting for either a close through $7.79 or a reclaim of $8.23 gives you a cleaner trade with the same capital.
6 · Quick FAQ
What is QUBT's expected move this week? ±$0.65, or ±8.12%, into the September 18 expiration — a $7.34 to $8.64 range around the $7.99 close, per the options market's straddle pricing as of September 11.
Is QUBT expected to go up or down over the next five days? Options positioning as of September 11 leans mildly bullish — calls are priced 42.6 vol points above puts and the leading positioning gauge turned sharply positive on Friday — but that's a read of what traders have done, not a forecast. The actionable map is the $7.34–$8.64 range, the $7.79 floor, and the $10.00 wall above.
Are QUBT options expensive right now? IV rank 7.9/100 says option prices are lower than roughly 92% of the past year's readings. On top of that, they're running about 0 vol points above the movement QUBT has actually delivered — right at the middle of this stock's own recent readings. Premium is cheap in year-over-year terms but fair versus reality, which favors owning defined-risk premium over selling it.
Where is QUBT's biggest options support and resistance? For the September 18 expiration, both the heaviest call open interest and the heaviest put open interest sit at $10.00, which is also max pain. Across the whole chain the picture differs: the heaviest call strike is still $10.00, but the heaviest put strike is $8.00 — right at the money, and the single largest gamma concentration in the chain.
What invalidates this week's read? A close below $7.79.
Methodology & disclosures. Data: end-of-day options-chain snapshot for QUBT, 2026-09-11, generated 2026-09-13T13:28:54Z. Prices shown are midpoints and will differ from live markets. Momentum/positioning scores and volatility-premium comparisons are descriptive measurements of past option flow and past price movement — not investment advice, signals, forecasts, or guarantees. All trade structures are hypothetical. Every structure shown has a defined maximum loss; you can lose the entire max-loss amount. Options involve substantial risk and are not suitable for all investors.