RGTI Options Are Pricing a $1.47 Move Into Friday — The Flow Leans Up, the Chart Model Leans Down
RGTI's options market implies a $13.80–$16.74 range into the September 18 expiration, with implied volatility sitting cheaper than roughly 93% of the past year. Positioning tilts mildly bullish while the 5-day chart model targets $14.95 — here's the level map and three defined-risk ways to trade the gap.

The options market implies a $13.80–$16.74 range into the September 18 expiration; here's what's driving it and three defined-risk ways to trade it.
Published Sunday, September 13, 2026 · Data as of Friday, September 11, 2026 close
Explore the live RGTI options data in the Detailed Options Analyzer →
Quick answer
| Item | Answer |
|---|---|
| Market bias | Neutral with a bullish tilt |
| Spot (Friday, September 11 close) | $15.27 |
| Options-implied range (into September 18) | $13.80 – $16.74 (±9.60%, or about ±$1.47) |
| Major support | $14.60 (swing-pivot support) |
| Major resistance | $17.00 (September 18 max pain and that expiration's heaviest put open interest) |
| Max pain (September 18) | $17.00 |
| Dealer gamma regime (estimate) | September 18 alone: positive — hedging tends to dampen moves. The all-expiration aggregate estimate is negative (amplifying); no gamma flip level could be computed today |
| Volatility condition | Low and rising off the floor — IV rank 7/100, ATM IV 72.1% · premium roughly fair: options priced about 0.6 vol points below delivered movement |
| Technical check | Mixed (3-day model neutral at $15.10; 5-day model bearish at $14.95) |
| Best-fitting strategy | September 18 $15/$17 bull call spread (conditional on holding $14.60) |
| Analysis invalidated if | RGTI closes below $14.60 |
1 · What matters today
RGTI closed Friday at $15.27, and the options market is pricing roughly a $1.47 move — up or down — over the next five days, into the September 18 expiration. That's the move implied by what straddles cost at that expiration, and it maps to a $13.80–$16.74 band.
Our read of the options flow leans mildly bullish: put activity is unusually thin relative to calls, call open interest is building faster than put open interest, and directional sentiment across every expiration bucket is positive. But that lean sits on top of a stock that is down 17.9% over the past 20 sessions and trading below every major moving average, and the 5-day chart model reads bearish. So the honest label is neutral with a bullish tilt, not a green light.
The one number that changes the picture: a close below $14.60. Above it, this is a base. Below it, the flow read is wrong.
2 · What the options market is pricing
What changed this week
The week's story is compression, not direction. RGTI finished the five sessions up just 0.59% — but that flat week sits inside a 20-day slide of 17.9%. At-the-money implied volatility (the market's estimate of how much RGTI will move, baked into option prices) rose 3.4% on Friday alone and is up 11.5% over five days to 72.1%, yet it remains 32.1% below where it was 30 days ago and sits well under both its 30-day average of 80.5% and its 90-day average of 96.7%. Volatility is bouncing off the floor, not breaking out.
Positioning turned decisively call-side. Put volume ran at 0.27 contracts for every call — against a 7-day average of 0.41 and a 14-day average of 0.44, so this was the most call-tilted session in two weeks. Open interest tells the same story more slowly: the put/call open-interest ratio has drifted from 0.86 to 0.81 over five sessions, versus a 14-day average of 0.98, meaning traders have been letting downside protection roll off rather than adding to it. Friday's day-over-day change was +6,273 call contracts against +1,194 puts. Total option volume ran 1.24× its 20-day average — active, but not a stampede.
Excluding contracts that have already settled, the largest single open-interest build was 1,016 new contracts in the October 16 $14 calls, with the September 18 $20 calls close behind at +986. Into Friday's expiration, the settled $15.50 calls traded 9,809 contracts at a penny — expiry-day exhaust, not a signal.
One tension is worth naming: the short-term trend read has flattened to neutral after Friday's flat week, but the medium (~20-day) and long (~50-day) reads are both firmly bearish, with price down 17.9% and 18.0% over those windows. The near-term flow and the bigger trend are pointing different ways, and that argues for short-dated structures and quick profit-taking rather than anything you'd want to hold for a month.
Expected move
Into September 18, the options market is pricing about ±9.60% — roughly $1.47 in either direction from $15.27, giving a $13.80–$16.74 band. That figure comes from what at-the-money straddles cost at that expiration: it's the market's own one-standard-deviation guess, not a boundary.
| Expiration | Implied move | Range around $15.27 |
|---|---|---|
| September 18 (7 days) | ±9.60% | $13.80 – $16.74 |
| September 25 (14 days) | ±13.60% | $13.19 – $17.35 |
| October 2 (21 days) | ±15.05% | $12.97 – $17.57 |
| October 16 (35 days) | ±21.84% | $11.94 – $18.61 |
The rungs scale smoothly with time — there is no single expiration where the priced move jumps out of line with its neighbors, which means the chain is not bracing for any one dated event inside the next five weeks.
Volatility
At-the-money implied volatility is 72.1%, which sounds enormous until you measure it against RGTI's own year: IV rank is 7/100, meaning today's reading is cheaper than roughly 93% of the past year's readings, and the percentile figure is lower still at 3.6. This is a stock whose options have spent most of the last twelve months priced far more expensively than they are now. The front-month read is unavailable today — Friday was itself an expiration date, so the near-tenor volatility number can't be interpolated from a same-day-expiring contract, and the term-structure comparison sits out this week.
Two "vs its own norm" readings stand out — that is, compared against this stock's own recent history rather than the broader market. Twenty-day realized volatility (how much RGTI has actually been moving) is 72.7%, which is unusually low for this name. And the ratio of the last week's realized movement to the last month's is 0.60 — also well below its own norm, meaning the past five sessions have been notably quieter than the month behind them. That's the statistical fingerprint of the tight range both chart models describe.
Premium rich or cheap. The gap between how much movement options are priced for and how much RGTI has actually delivered — the volatility risk premium — currently sits at about negative 0.6 vol points. In plain terms, option sellers have recently been collecting slightly less than the stock's actual movement cost them. That gap sits at the 54th percentile of this stock's own recent readings, so it is squarely ordinary: neither the rich-premium setup that rewards sellers nor the fire-sale that rewards buyers. The path matters more than the level here — that gap has climbed from roughly −31 vol points three weeks ago to about flat now, as realized movement cooled faster than implied volatility fell. Combined with an IV rank of 7/100, the verdict is: this is a better week to own defined-risk premium than to sell it, but the edge in either direction is thin.
Skew and sentiment
Skew — the fact that puts and calls the same distance from the stock price don't cost the same — is unusual here. Twenty-five-delta calls carry 72.8% implied volatility against 69.8% for the equivalent puts, so calls are about 3.0 vol points richer than puts. Traders are paying up for upside, not for crash protection. That said, the recent norm for this name is even more call-rich: the 60-day median gap is 3.5 vol points and the trailing 7-day average is 5.4, so the call premium has faded slightly over the last few sessions even as it stays inverted versus a typical stock.
Flow ratios say the same. Put volume at 0.27 per call is the most call-tilted reading in two weeks and is unusually call-heavy against this stock's own baseline. Three call contracts cleared the peer-relative unusual-volume bar on Friday against zero puts. Directional sentiment bucketed by expiration is positive right across the curve — +30 in the 0–7 day bucket and +31 in the 7–30 day bucket, which the regime read summarizes as broadly bullish, with no single bucket carrying the whole score.
That is a genuinely one-sided flow picture. What keeps it from becoming a firm bullish call is context: this kind of call-heavy chase has shown up repeatedly during the last month's decline without stopping it, and the medium- and long-term trend reads remain bearish.
The key levels map
| Level | Price | Why it matters |
|---|---|---|
| Call wall, September 18 | $27.00 | The strike with the biggest pile of open call contracts at this expiration (8,748) — but it sits 77% above spot, so it's lottery-ticket open interest, not a real ceiling |
| 200-day moving average | $19.11 | Price sits 20.1% below it — the long-term trend is unambiguously down |
| Whole-chain heaviest call strike | $18.00 | 21,879 calls open across all expirations — the aggregate ceiling, well above the week's action |
| Max pain + heaviest put OI, September 18 | $17.00 | The price where the most option value would expire worthless, and the expiration's put wall (21,109 contracts). It is also the single largest gamma strike on the board |
| Top of implied range | $16.74 | The upper rail of what the options market prices for Friday |
| 20-day / 50-day moving averages | $16.24 / $16.14 | Price is 6.0% and 5.4% below them — the first real overhead barrier on a recovery |
| Swing resistance | $16.12 | Heuristic pivot cluster from recent price action — descriptive, not a guaranteed reaction zone |
| Chart-model resistance | $15.79 | Upper Bollinger Band; both technical reports name it as the breakout trigger zone |
| Nearest swing resistance | $15.56 | The lid on the past week's range |
| Last close | $15.27 | Sitting almost exactly mid-range |
| Chart-model range floor | $14.90 | Both technical reports use a close below this as their breakdown trigger |
| Swing support | $14.60 | Nearest pivot support — and this article's invalidation level |
| Bottom of implied range | $13.80 | The lower rail of what the options market prices for Friday |
| Deeper swing supports | $13.41 / $13.13 | Where the pivot structure thins out below the range |
| 52-week low | $12.53 | Price sits 21.9% above it and 73.7% below the 52-week high of $58.15 |
One quirk deserves a plain explanation. The September 18 put wall — the strike with the biggest pile of open put contracts — sits at $17.00, above the stock. That is not a floor beneath the market; it's a large block of in-the-money puts. When the heaviest put open interest sits above spot, it stops acting like a magnet holding price up and starts acting like a strike price gravitates toward as those contracts get worked out. It is also why the aggregate walls differ from this week's: across all expirations combined, the heaviest call strike is $18.00 and the heaviest put strike is $16.00 — both different from the September 18 row, which is the one that governs this week.
Positioning and unusual flow
Dealer gamma — market makers hedge the options they've sold, and in some regimes that hedging dampens moves while in others it amplifies them — reads differently depending on which slice you look at. Scoped to September 18 alone, one rough estimate puts the regime as positive, meaning hedging around this week's expiration tends to cushion moves. Scoped across all ten covered expirations, the same estimate flips negative (amplifying). For a five-day trade, the September 18 read is the relevant one, but treat both as estimates built on an assumed dealer-inventory convention, not observed positioning. No gamma flip level could be computed today.
Three non-expired flows stand out:
- September 18 $17 calls — 5,463 contracts traded against 7,492 open, roughly $68,300 of premium, and the tightest quote on the board at a penny wide. That is the market putting real money on a move to max pain by Friday.
- September 18 $20 calls — 2,017 traded and open interest up 986 to 8,411, clearing the 100th percentile against peer contracts. At a delta of 0.03 these are pure upside lottery tickets, which is exactly what a call-chasing tape looks like.
- October 16 $18 calls — 2,186 contracts and about $121,300 of premium, the largest non-expired dollar-premium print in the file. Someone is positioning for a recovery over a month, not a week.
3 · Technical check
The two chart models split. The 3-day model (target date September 16) reads neutral, projecting $15.10 with a range of $14.80–$15.60. It leans on a 14.9 ADX with +DI and −DI essentially tied, a flat MACD hugging zero, and RSI at 46.9 — a genuinely non-trending market coiling inside a $14.90–$15.70 rectangle. Against the options-implied band, that target sits comfortably inside and contradicts nothing, but it doesn't confirm the bullish tilt either. Call it neutral-to-mixed.
The 5-day model (target date September 18, matching our expiration) reads bearish, projecting $14.95 with a range of $14.35–$15.75. It weights the same compression differently: price below the EMA13/EMA34 cluster at $15.38/$15.40, below the 50-day at $16.14 and the 200-day at $19.11, with money flow still mildly negative — a bear-flag pause rather than a base. Its dominant scenario is a breakdown on a close below $14.90 toward $14.30–$14.50, invalidated on a reclaim above $15.55. That directly diverges from the options read.
Model vs. Market: The options market implies $13.80–$16.74 into September 18; the 5-day technical model targets $14.95. Both agree the coming week is a small move by RGTI standards — they disagree only on which side of $15.27 it lands. What resolves it is the $14.90–$15.55 band: a close above $15.55 kills the chart model's bearish case, and a close below $14.90 kills the flow read.
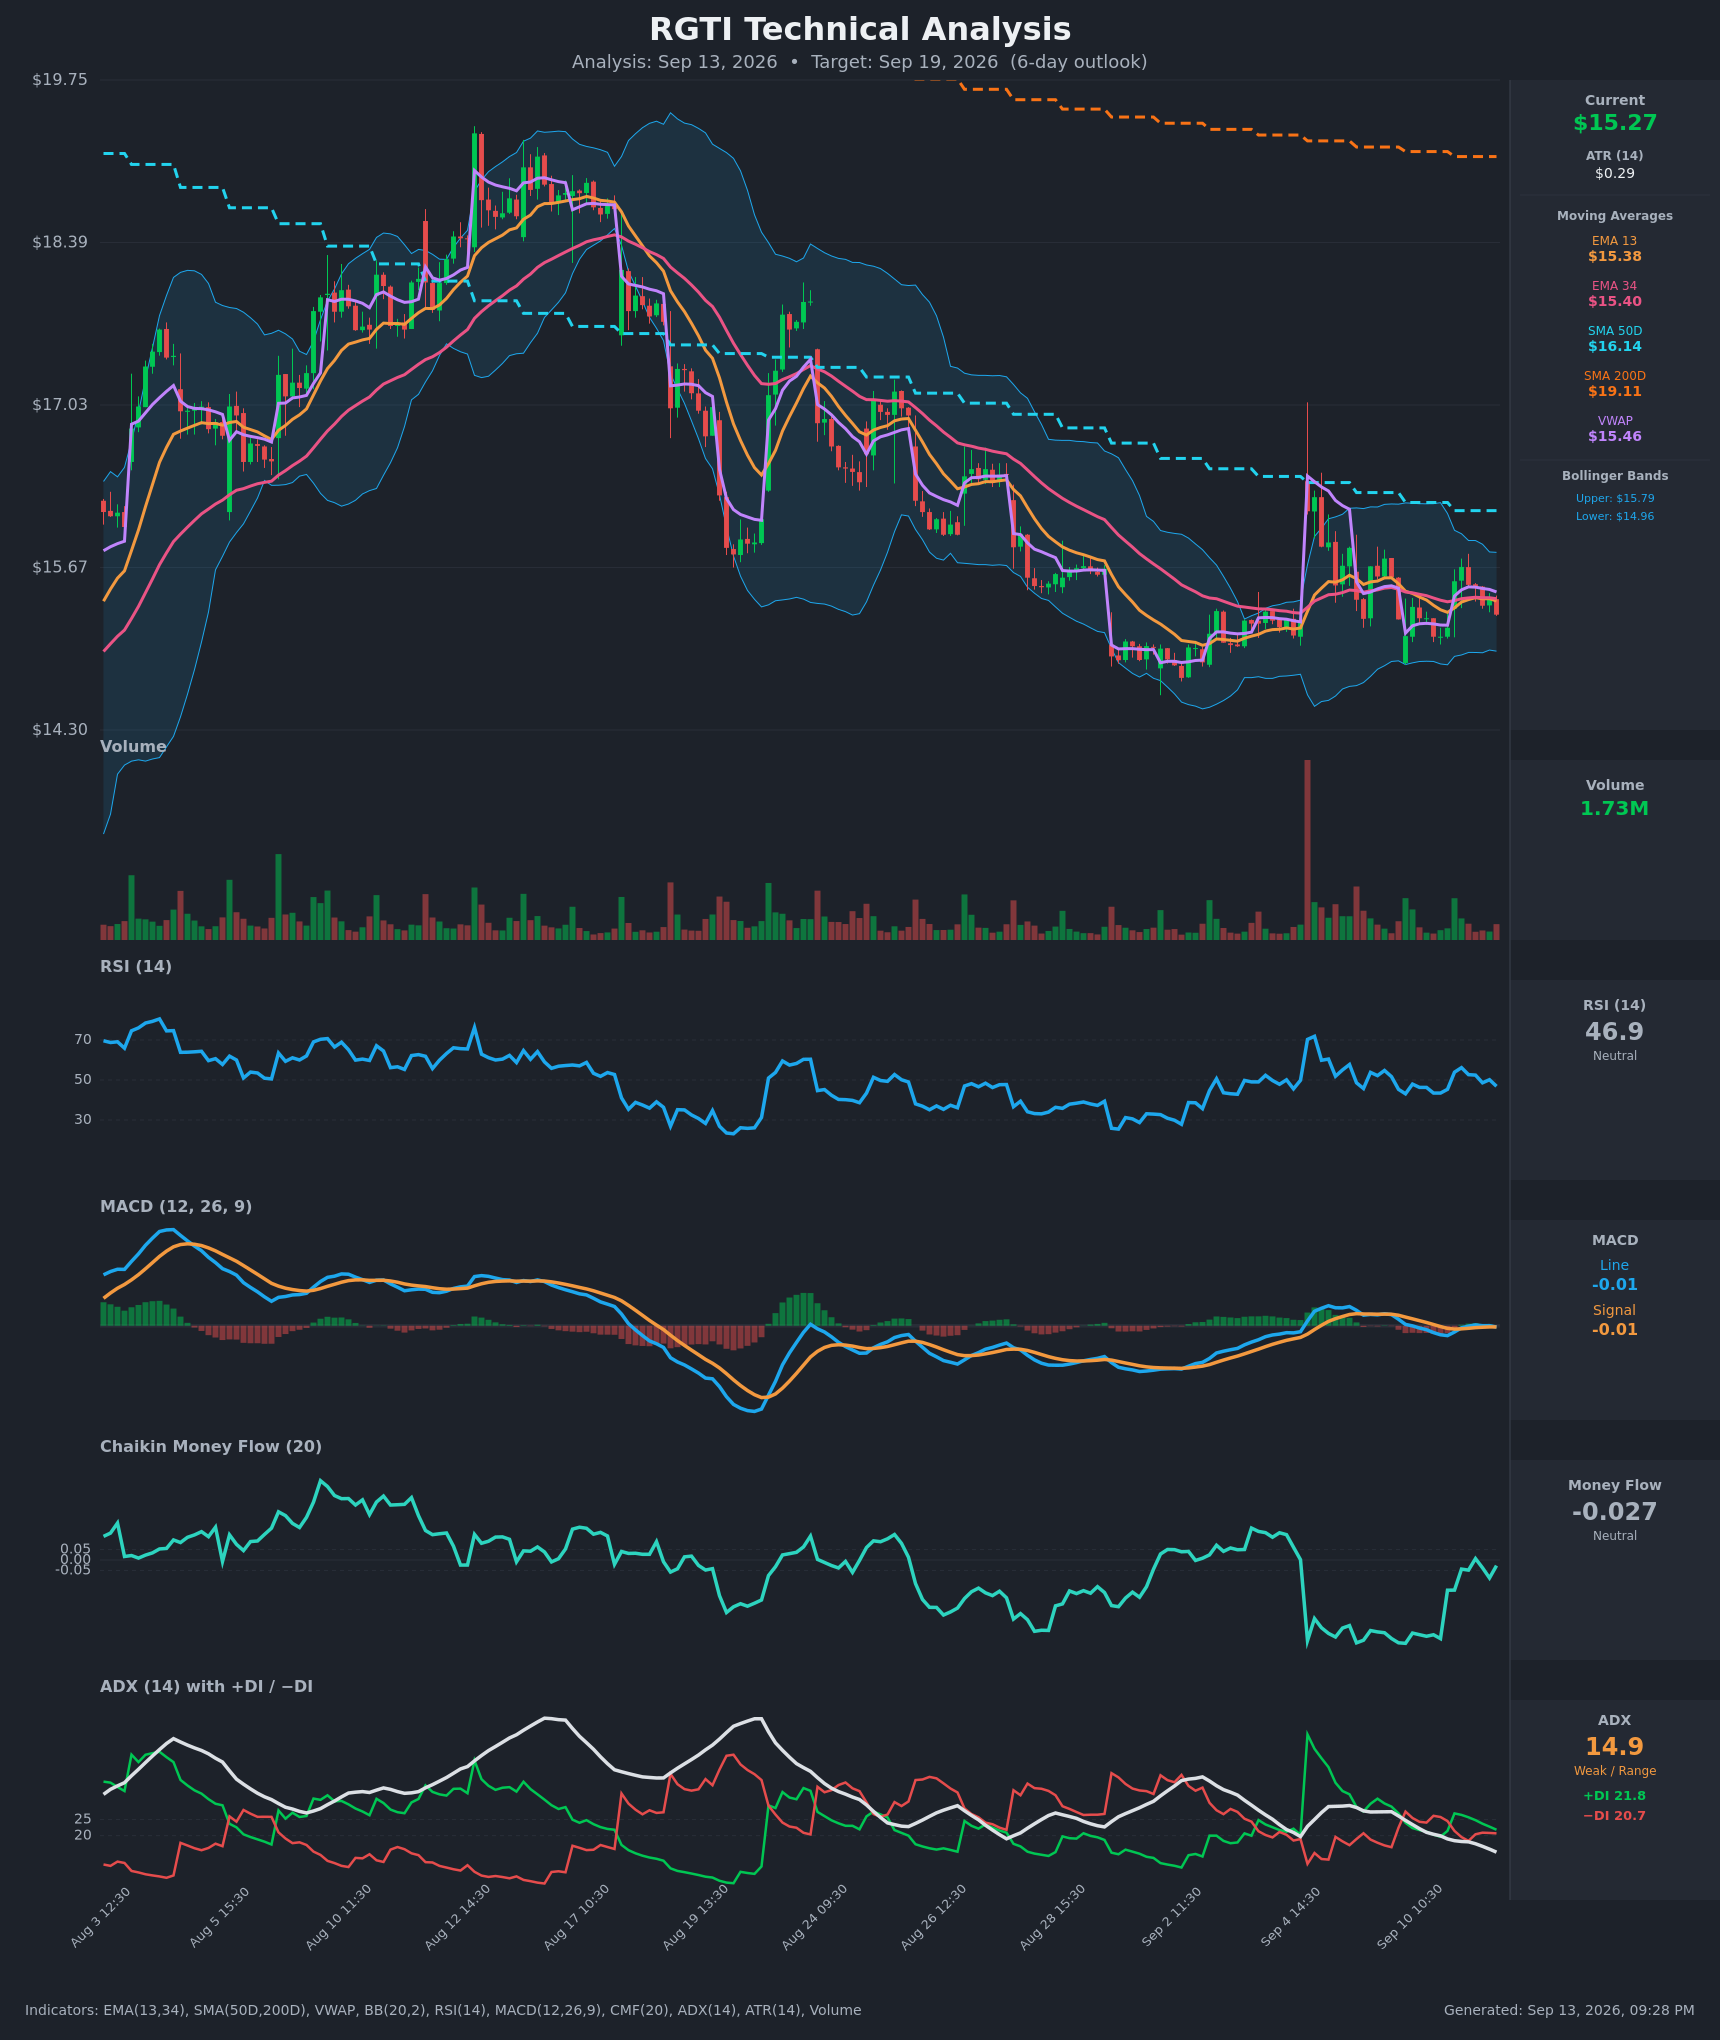
The divergence shaped the strikes below in one specific way: the bearish structure is built around the 5-day model's $14.95 target rather than a deeper breakdown, and the bullish structure's long strike sits at $15 rather than out-of-the-money, so it doesn't need a breakout to have value.
Full technical write-ups: 3-day report → · 5-day report →
4 · Three ways the next five days can go
If RGTI pushes above $16.74: the top of the implied range gives way and the next real cluster is $17.00 — max pain, the heaviest gamma strike on the board, and the September 18 put wall all stacked at one price. Positioning that heavy tends to slow a rally rather than accelerate it, because the market makers hedging those contracts sell into strength. Above $17, the chain thins quickly until $18, where the whole-chain call open interest piles up.
If RGTI drifts between $14.90 and $16.12: this is the base case, and it's the one both chart models rank highest. Max pain sitting at $17.00 — 11% above spot — is worth noting but not worth trading around: expirations sometimes gravitate toward max pain, but not across an 11% gap in five sessions. With the September 18 gamma estimate reading positive, hedging flows into Friday tend to compress rather than extend whatever move develops, which favors the range holding.
If RGTI breaks below $14.60: the flow read is wrong. The chart-model floor at $14.90 goes first, then swing support at $14.60, and below that the pivot structure thins out toward $13.80 — the bottom of the implied range — with $13.41 and $13.13 the next markers. No gamma flip estimate could be computed from today's chain, so there's no modeled level at which hedging is expected to turn from cushioning to amplifying; treat a break below $14.60 as a plain structural failure rather than a mechanical cascade.
5 · Three defined-risk structures
Prices are end-of-day midpoints as of Friday, September 11, 2026. All structures are hypothetical. Verify live prices before trading — these will be stale by the open.
If you lean bullish: September 18 $15/$17 bull call spread
- Trade: Buy the September 18 $15 call, sell the September 18 $17 call. You pay a net debit and profit if RGTI rises; your maximum outcome is capped at the short strike.
- Debit: $0.61 ($0.73 paid − $0.125 collected) · Max profit: $139 per spread · Max loss: $61 · Break-even: $15.61
- Why it fits: IV rank of 7/100 and a slightly negative volatility risk premium mean you're buying option premium that is cheap versus both the past year and versus what the stock has actually been delivering — the rare condition where paying a debit is the structurally cleaner expression. The short strike sits exactly at max pain and at the heaviest gamma strike, which is where a rally would most likely stall anyway.
- Makes sense only if: you believe the call-heavy flow and the fading put open interest are real positioning rather than noise, and RGTI holds the $14.90–$15.27 shelf.
- Invalidated if: RGTI closes below $14.60.
- Managing it: with the short-term trend flat against a firmly bearish two-month trend, take profits early rather than holding for the full width — close at roughly 50–60% of maximum value if $16.50 trades, and exit by Wednesday, September 16 if the stock is still sitting at $15.20 (the debit bleeds fastest in the last two sessions).
- Liquidity note: the $15 calls quoted 4¢ wide ($0.71/$0.75, about 5.5% of mid) on 968 contracts; the $17 calls quoted a penny wide on 5,463 contracts and were the most-traded line on the board. Fills should be straightforward on the spread.
- Analyze this position →
If you expect the range to hold: September 18 $13.50/$14.50/$17/$18 iron condor
- Trade: Sell the $14.50 put and buy the $13.50 put; sell the $17 call and buy the $18 call, all September 18. You collect a credit up front and keep it if RGTI finishes between the short strikes.
- Credit: $0.27 · Max profit: $27 per condor · Max loss: $73 · Break-evens: $14.23 and $17.27
- Why it fits: both chart models rank sideways chop as the single most likely outcome, realized movement over the past week has run well below this stock's own monthly norm, and the September 18 gamma estimate reads positive — hedging that tends to dampen rather than extend moves. The short strikes bracket the implied range's rails.
- Makes sense only if: you're genuinely indifferent to direction. One health warning: you're selling premium that hasn't been rich lately — the priced-versus-delivered gap is about 0.6 vol points negative, so this structure is paid for range, not for expensive options.
- Invalidated if: RGTI closes outside $14.60–$16.74 — at that point the range thesis is done regardless of where the break-evens sit.
- Managing it: close at roughly 50% of the credit collected; exit the whole position on Thursday, September 17 regardless, since the last day carries the worst gamma-to-theta trade-off on a $1-wide condor.
- Liquidity note: the $14.50 puts traded 2¢ wide ($0.23/$0.25) on 651 contracts and the $17 calls a penny wide on 5,463. The wings are thinner — the $13.50 puts quoted $0.04/$0.05 and the $18 calls $0.04/$0.06 — so a penny of slippage on each wing is a meaningful fraction of a $27 credit. Work the order.
- Analyze this position →
If you lean bearish: September 18 $15.50/$14.50 put debit spread
- Trade: Buy the September 18 $15.50 put, sell the September 18 $14.50 put. You pay a debit and profit as the stock falls, capped at the lower strike.
- Debit: $0.45 ($0.69 paid − $0.24 collected) · Max profit: $55 per spread · Max loss: $45 · Break-even: $15.05
- Why it fits: this is the 5-day chart model's thesis expressed with defined risk — its $14.95 target sits just below the break-even and its $14.35 range floor sits below the short strike. It also fits the trend picture: price below every major moving average with the 20-day and 50-day trend reads both bearish.
- Makes sense only if: you're willing to fade the call-heavy options flow — this structure fights the positioning read on purpose.
- Invalidated if: RGTI closes above $15.56 (the nearest swing resistance, and near the chart model's own $15.55 invalidation).
- Managing it: the short-term trend is flat, not falling, so don't wait for the full width — take profits at roughly 60% of maximum if $14.60 trades, and cut it if the stock is above $15.40 into Wednesday, September 16.
- Liquidity note: the $15.50 puts quoted 8¢ wide ($0.65/$0.73, about 12% of mid) on 588 contracts — that's the slippage risk in this trade; the $14.50 puts were 2¢ wide. Use a limit at or inside the spread mid rather than paying up.
- Analyze this position →
If none of these: no trade
There is a real case for standing aside. A seven-day expiration on a stock that has already fallen 17.9% in a month, where the flow read and the price structure point opposite ways, and where the premium is neither rich enough to reward selling nor cheap enough to make buying a bargain, is close to a coin flip with transaction costs attached. The credit structure here collects $27 against $73 of risk on premium that hasn't been rich lately — that ratio only works if you're confident in the range, and "both chart models say chop" is a thinner edge than it sounds. The disciplined alternative is to wait for a close outside $14.90–$15.56 and trade the resolution with a real level behind you rather than guessing at the coil.
6 · Quick FAQ
What is RGTI's expected move this week? About ±$1.47 (±9.60%) into the September 18 expiration, per the options market's straddle pricing as of the September 11 close — a $13.80 to $16.74 band around $15.27.
Is RGTI expected to go up or down over the next five days? Options positioning as of September 11 leans mildly bullish — call volume is running at its most one-sided in two weeks and put open interest is thinning — but that's a read of what traders have already done, not a forecast, and the 5-day chart model reads the other way at $14.95. The actionable map is the $13.80–$16.74 range with $14.60 as support and $17.00 as the overhead cluster.
Are RGTI options expensive right now? IV rank 7/100 says option prices are lower than roughly 93% of the past year's readings; on top of that, they're running about 0.6 vol points below the movement RGTI has actually delivered over the past 20 sessions, which is right in the middle of this stock's own recent range at the 54th percentile. Verdict: cheap versus the year, fair versus recent reality — a better week to own defined-risk premium than to sell it.
Where is RGTI's biggest options support and resistance? For the September 18 expiration, the call wall is $27.00 (8,748 contracts, far enough out of the money that it caps nothing) and the put wall is $17.00 (21,109 contracts) — which sits above the stock, so it reads as an overhead magnet rather than a floor. The usable downside level is the $14.60 swing support.
What invalidates this week's read? A close below $14.60.
Methodology & disclosures. Data: end-of-day options-chain snapshot for RGTI, 2026-09-11, generated 2026-09-13T21:28:01Z. Prices shown are midpoints and will differ from live markets. Momentum/positioning scores and volatility-premium comparisons are descriptive measurements of past option flow and past price movement — not investment advice, signals, forecasts, or guarantees. All trade structures are hypothetical. Every structure shown has a defined maximum loss; you can lose the entire max-loss amount. Options involve substantial risk and are not suitable for all investors.