RKLB Options Price a $6.56 Move Into October 9: Positioning Says Range, Charts Say Breakout
Rocket Lab options imply a $67.36–$80.48 range into the October 9 expiration, with heavy call open interest capping the top at $80 and max pain sitting at $70. The chart model leans bullish, but the positioning read is neutral. Here's the map and three defined-risk ways to trade it.
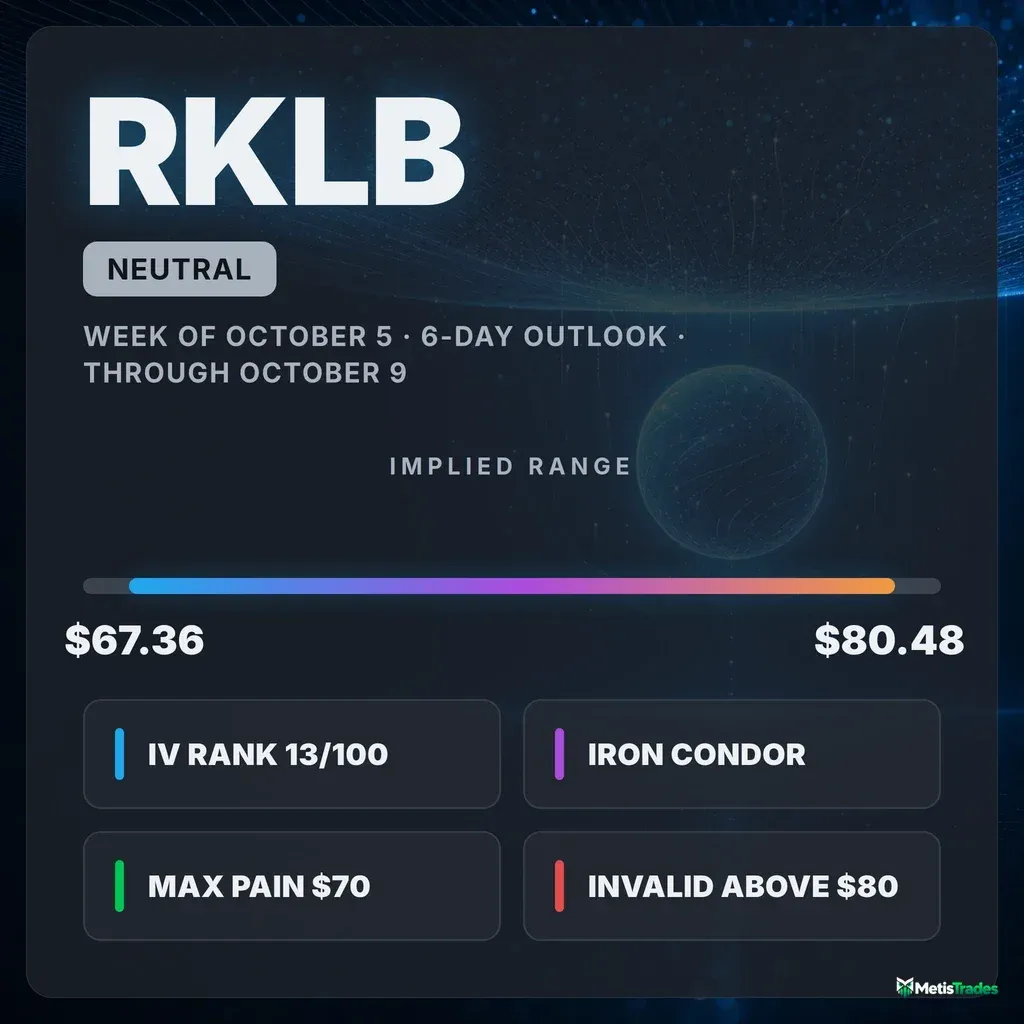
The options market implies a $67.36–$80.48 range for RKLB into the October 9 expiration. Below: what's driving that range, where the key levels sit, and three defined-risk ways to trade it.
Published Saturday, October 3, 2026 · Data as of Friday, October 2, 2026 close
Explore the live RKLB options data in the Detailed Options Analyzer →
Quick answer
| Item | Answer |
|---|---|
| Market bias | Neutral |
| Options-implied range (into October 9) | $67.36 – $80.48 (±8.87%, ±$6.56) |
| Major support | $54 (October 9 put wall); nearer structure at $70 max pain and $72.94 swing support |
| Major resistance | $80 (October 9 call wall, which is also the whole chain's heaviest call strike) |
| Max pain (October 9) | $70 |
| Dealer gamma regime (estimate) | Positive: hedging tends to dampen moves. Flip level ≈ $30 |
| Volatility condition | Neutral. IV rank 13/100. Premium rich: options are priced ~13 vol pts above delivered movement |
| Technical check | Mixed (bullish, 6-day model target $75.20, inside the implied range) |
| Best-fitting strategy | October 9 iron condor ($66/$68 puts, $80/$82 calls), conditional on RKLB staying under the $80 call wall |
| Analysis invalidated if | RKLB closes above $80 |
1 · What matters today
Our read of options positioning on Rocket Lab is neutral for the six days through October 9. RKLB closed at $73.92 on Friday after gapping higher. The options market is pricing a move of about $6.56 either way by October 9, which works out to roughly $67.36 to $80.48. That figure is the expected move, meaning the move the options market is pricing in, derived from what straddles cost.
The single most important level is $80. It holds the biggest pile of open call contracts for that expiration, and strikes like that often act like barriers. Below spot, the strike where the most option value would expire worthless (max pain) sits at $70.
Options are cheap compared with their own past year, but they're still priced for more movement than RKLB has actually delivered lately. That nudges the playbook toward defined-risk premium selling inside the range. The chart model leans bullish, but its target sits comfortably inside that range. A close above $80 breaks this read.
2 · What the options market is pricing
What changed this week
RKLB went nowhere in net terms over five sessions: down 0.04%. The path was anything but flat. The stock slid from about $73.95 on September 25 to $69.68 by September 30, then gapped up two days running to close Friday at $73.92. That V-shaped round trip happened inside a stock that is still up 15.8% over the past month.
The multi-horizon trend read agrees with that picture:
- The roughly one-month view is bullish.
- The past week and the roughly two-month views are flat, with no fight between them.
Our options-flow momentum gauge has cooled. It printed +5 on Friday, against a 7-day average of +13 and a 14-day average of +15. A short-term momentum crossover turned bearish on October 1, just before Friday's pop. Near-term flow lost steam even as price bounced.
Implied volatility (IV) is the market's estimate of how much RKLB will move, baked into option prices. It was essentially unchanged over five days (+0.3% relative) and slipped 2.1% on Friday alone.
Put activity picked up. The put/call volume ratio measures how much put activity there is relative to calls; above 1 means puts dominate. It rose to 0.51 on Friday, against a 7-day average of 0.36. Calls still outnumber puts roughly two to one, but the ratio climbed well above its recent baseline.
Open interest (OI) is the number of contracts currently held open. Friday saw one of the bigger one-day OI rotations for this name: call OI grew by about 19,970 contracts while put OI shrank by about 19,288. That pace of net call-side building is unusually heavy compared with RKLB's own recent history.
Into Friday's expiration (now settled), the October 2 $72 calls added 2,470 contracts of open interest. That's history now, not a live level.
Expected move
Straddle pricing for October 9 implies ±8.87%, or ±$6.56, around the $73.92 chain-snapshot price. That points to a one-standard-deviation range of $67.36 to $80.48. Here's how the ladder steps out:
| Expiration | Implied move | Range around $73.92 |
|---|---|---|
| October 9 | ±8.87% | $67.36 – $80.48 |
| October 16 | ±12.89% | $64.39 – $83.45 |
| October 23 | ±14.64% | $63.10 – $84.74 |
| October 30 | ±18.60% | $60.17 – $87.67 |
The rungs widen smoothly with time, with no sudden jump that would flag a scheduled event inside the next month. The ATM IV for the October 9 expiration itself is 64.1%, a bit below the 68.30% headline figure, so the very front of the curve is the cheapest part of it.
Volatility
RKLB's at-the-money IV is 68.30%. That's high in absolute terms, as it always is for this stock, but low by RKLB's own standards.
IV rank shows where today's IV sits versus the past year. At 13/100, current IV is cheaper than 87% of the past year's range. On the percentile measure, today's IV is higher than only about 5% of the past year's daily readings.
IV sits slightly below its 30-day average of 68.9% and far below its 90-day average of 87.5%. Over 30 sessions it is down 2.2% in relative terms. Options got markedly cheaper over the summer and have stayed cheap.
Term structure means comparing option prices across different expiration dates. The front-month read is unavailable today (expiry day). Expiration by expiration, though, the curve slopes gently upward: from about 64% for October 9 to about 75–76% by mid-November, with the ~60-day IV at 75.4%. That's a normal, calm shape. Near-dated options aren't bracing for anything special.
On the realized side, RKLB's 20-day realized volatility is 54.9%. Compared against this stock's own recent history ("unusual" here means unusual for RKLB, not versus the broader market), that's quieter than its recent norm. The 10-day figure of 58.5% shows movement picking up only modestly.
Premium rich or cheap? The volatility risk premium is the gap between how much movement options are priced for and how much RKLB has actually delivered. When it's positive, option sellers have been collecting more than realized movement cost them. Right now options are priced about 13 vol points above what RKLB has actually delivered over the past 20 days.
The VRP percentile shows where today's gap sits versus this stock's own recent readings. At 76/100, today's gap is richer than about three-quarters of them.
The gap has been narrowing. It ran near 30 points in mid-September and around 19 points as recently as September 30. Friday's rebound in delivered movement trimmed it.
Put the two measures together:
- IV rank of 13 says premium is cheap versus the past year.
- A 76th-percentile gap over delivered movement says premium is still rich versus what the stock is actually doing.
That combination mildly favors collecting premium through defined-risk structures. The edge is thin in absolute dollars, though, because cheap IV means small credits. No scheduled report sits close enough to distort this comparison.
Skew and sentiment
Skew describes how puts and calls the same distance from the stock price don't cost the same. When puts are pricier, traders are paying up for crash protection. RKLB runs the other way, with calls usually richer than puts. Today 25-delta puts trade at 68.1% IV versus 70.8% for calls, so puts are about 2.7 vol points cheaper. The 60-day norm for this name is 2.8 points, so skew sits right at typical.
The interesting part is the path. Over the past seven sessions, calls carried an average premium of about 5.2 points. Skew has steepened by roughly 3.4 points in five sessions, which means put demand has rebuilt from unusually complacent levels back to normal. Traders aren't panicking, but they stopped ignoring the downside.
The put/call open-interest ratio is 0.71, below its 7-day average of 0.75. Held positions remain call-heavy.
Sentiment in short-dated options remains constructive:
- The 0–7 day expiration group scores +32 and the 7–30 day group +23, both leaning bullish.
- Their 7-day averages are +28 and +30.
- Every expiration group leans the same way, giving a "broadly bullish" read across the curve.
That sounds more decisive than it is. The leans are mild, and the near-term flow gauge and positioning-setup read are flat. The term-structure tilt is one input among several, and it's being outvoted.
The key levels map
| Level | Price | Why it matters |
|---|---|---|
| 200-day moving average | $81.41 | Major overhead trend line; the long-term trend is still down |
| Upper implied-move rail (October 9) | $80.48 | Top of the one-standard-deviation range options are pricing |
| Call wall (October 9) / largest-gamma strike | $80 | 5,435 calls open for October 9; also the whole chain's heaviest call strike (46,890 contracts across all expirations); swing resistance sits here too |
| Technical resistance (October 2 high) | $75.60 | The chart model's breakout trigger |
| Swing resistance | $75.46 | Top of the late-September range |
| Large-gamma strike | $75 | Heavy combined call and put OI just above spot; tends to slow price nearby |
| Spot (Friday close) | $73.92 | Reference price |
| Swing support | $72.94 | Nearest price-structure floor |
| Short EMAs (technical) | $72.88 / $72.12 | The chart model's first supports; a close under $72.10 is its bearish trigger |
| Unfilled gaps | $70.46 – $72.08 | Two up-gaps on October 1–2 left air below |
| Max pain (October 9) / large-gamma strike | $70 | Where the most October 9 option value expires worthless; heavy OI on both sides |
| 50-day moving average | $69.76 | Medium-term trend line, now below price |
| 20-day moving average | $67.80 | Price is 9% above it, a sign of the recent run |
| Swing support | $67.70 | Next price-structure floor |
| Lower implied-move rail (October 9) | $67.36 | Bottom of the priced range |
| Large-gamma strike | $65 | Big combined OI cluster |
| Put wall (all expirations) | $60 | Whole chain's heaviest put strike (28,355 contracts) |
| Put wall (October 9) | $54 | Largest October 9 put OI (2,613); far below the action |
| 52-week low | $37.57 | Year's floor |
| Gamma flip (estimate) | ≈ $30 | One rough estimate of where hedging would turn from cushioning to amplifying |
The October 9 put wall ($54) and the aggregate put wall ($60) disagree. Both sit far below the priced range, so neither is a live floor for this window. The practical downside markers are $70 and the $67.36 rail.
Positioning and unusual flow
Dealer gamma describes how market makers hedge the options they've sold. One rough estimate puts RKLB in a positive-gamma regime, where their hedging tends to dampen moves rather than amplify them. That holds both across the whole chain and for the October 9 expiration specifically.
The gamma flip level is the price below which market-maker hedging tends to accelerate selling rather than cushion it. The estimate for RKLB is around $30. Spot sits unusually far above that flip compared with this stock's recent norm, which describes a cushioned, not fragile, setup.
Three items stand out in the flow:
- October 9 $75 calls: 5,526 contracts traded, roughly $1.17 million in premium, and open interest grew by 1,309. That's fresh money at the strike just above spot.
- October 9 $80 calls: 7,903 contracts traded, about $609,000 in premium, and OI rose by 561 to 5,435. More contracts are piling up at the wall itself.
- October 30 $68 puts: open interest jumped from 149 to 1,001. Someone is paying for a few weeks of protection just under the lower rail.
Big call volume near the money plus a growing pile at $80 fits a market that wants upside but has drawn its ceiling in one place.
3 · Technical check
Both chart-model reports lean bullish, and both targets sit well inside what options are pricing.
- 3-day report (checkpoint October 6): targets $75.00, with a projected range of $71.80–$77.20.
- 6-day report (through October 9): targets $75.20, with a projected range of $71.40–$76.20.
Against our neutral options read, that's a mixed verdict: the direction diverges, but the magnitude agrees. The chart model calls for a gain of about $1.28, smaller than the $6.56 the options market prices in either direction.
The model's case rests on a strong trend gauge. ADX sits near 39, with the bullish directional line far above the bearish one, alongside a fresh bullish MACD crossover on October 2. Its own caution is that money-flow readings slipped slightly negative during the gap-up session, so the rally wasn't backed by clear accumulation. The dominant bullish scenario needs a close above $75.60 to trigger and is invalidated by a close below $72.10.
Model vs. Market: The options market implies $67.36–$80.48 into October 9; the 6-day technical model targets $75.20. The chart sees drift higher, while the options market sees a wide, two-way range capped near $80. A clean close above $75.60 would tilt the question toward the model; a close back under $72.10 would hand it to the $70 max-pain magnet.
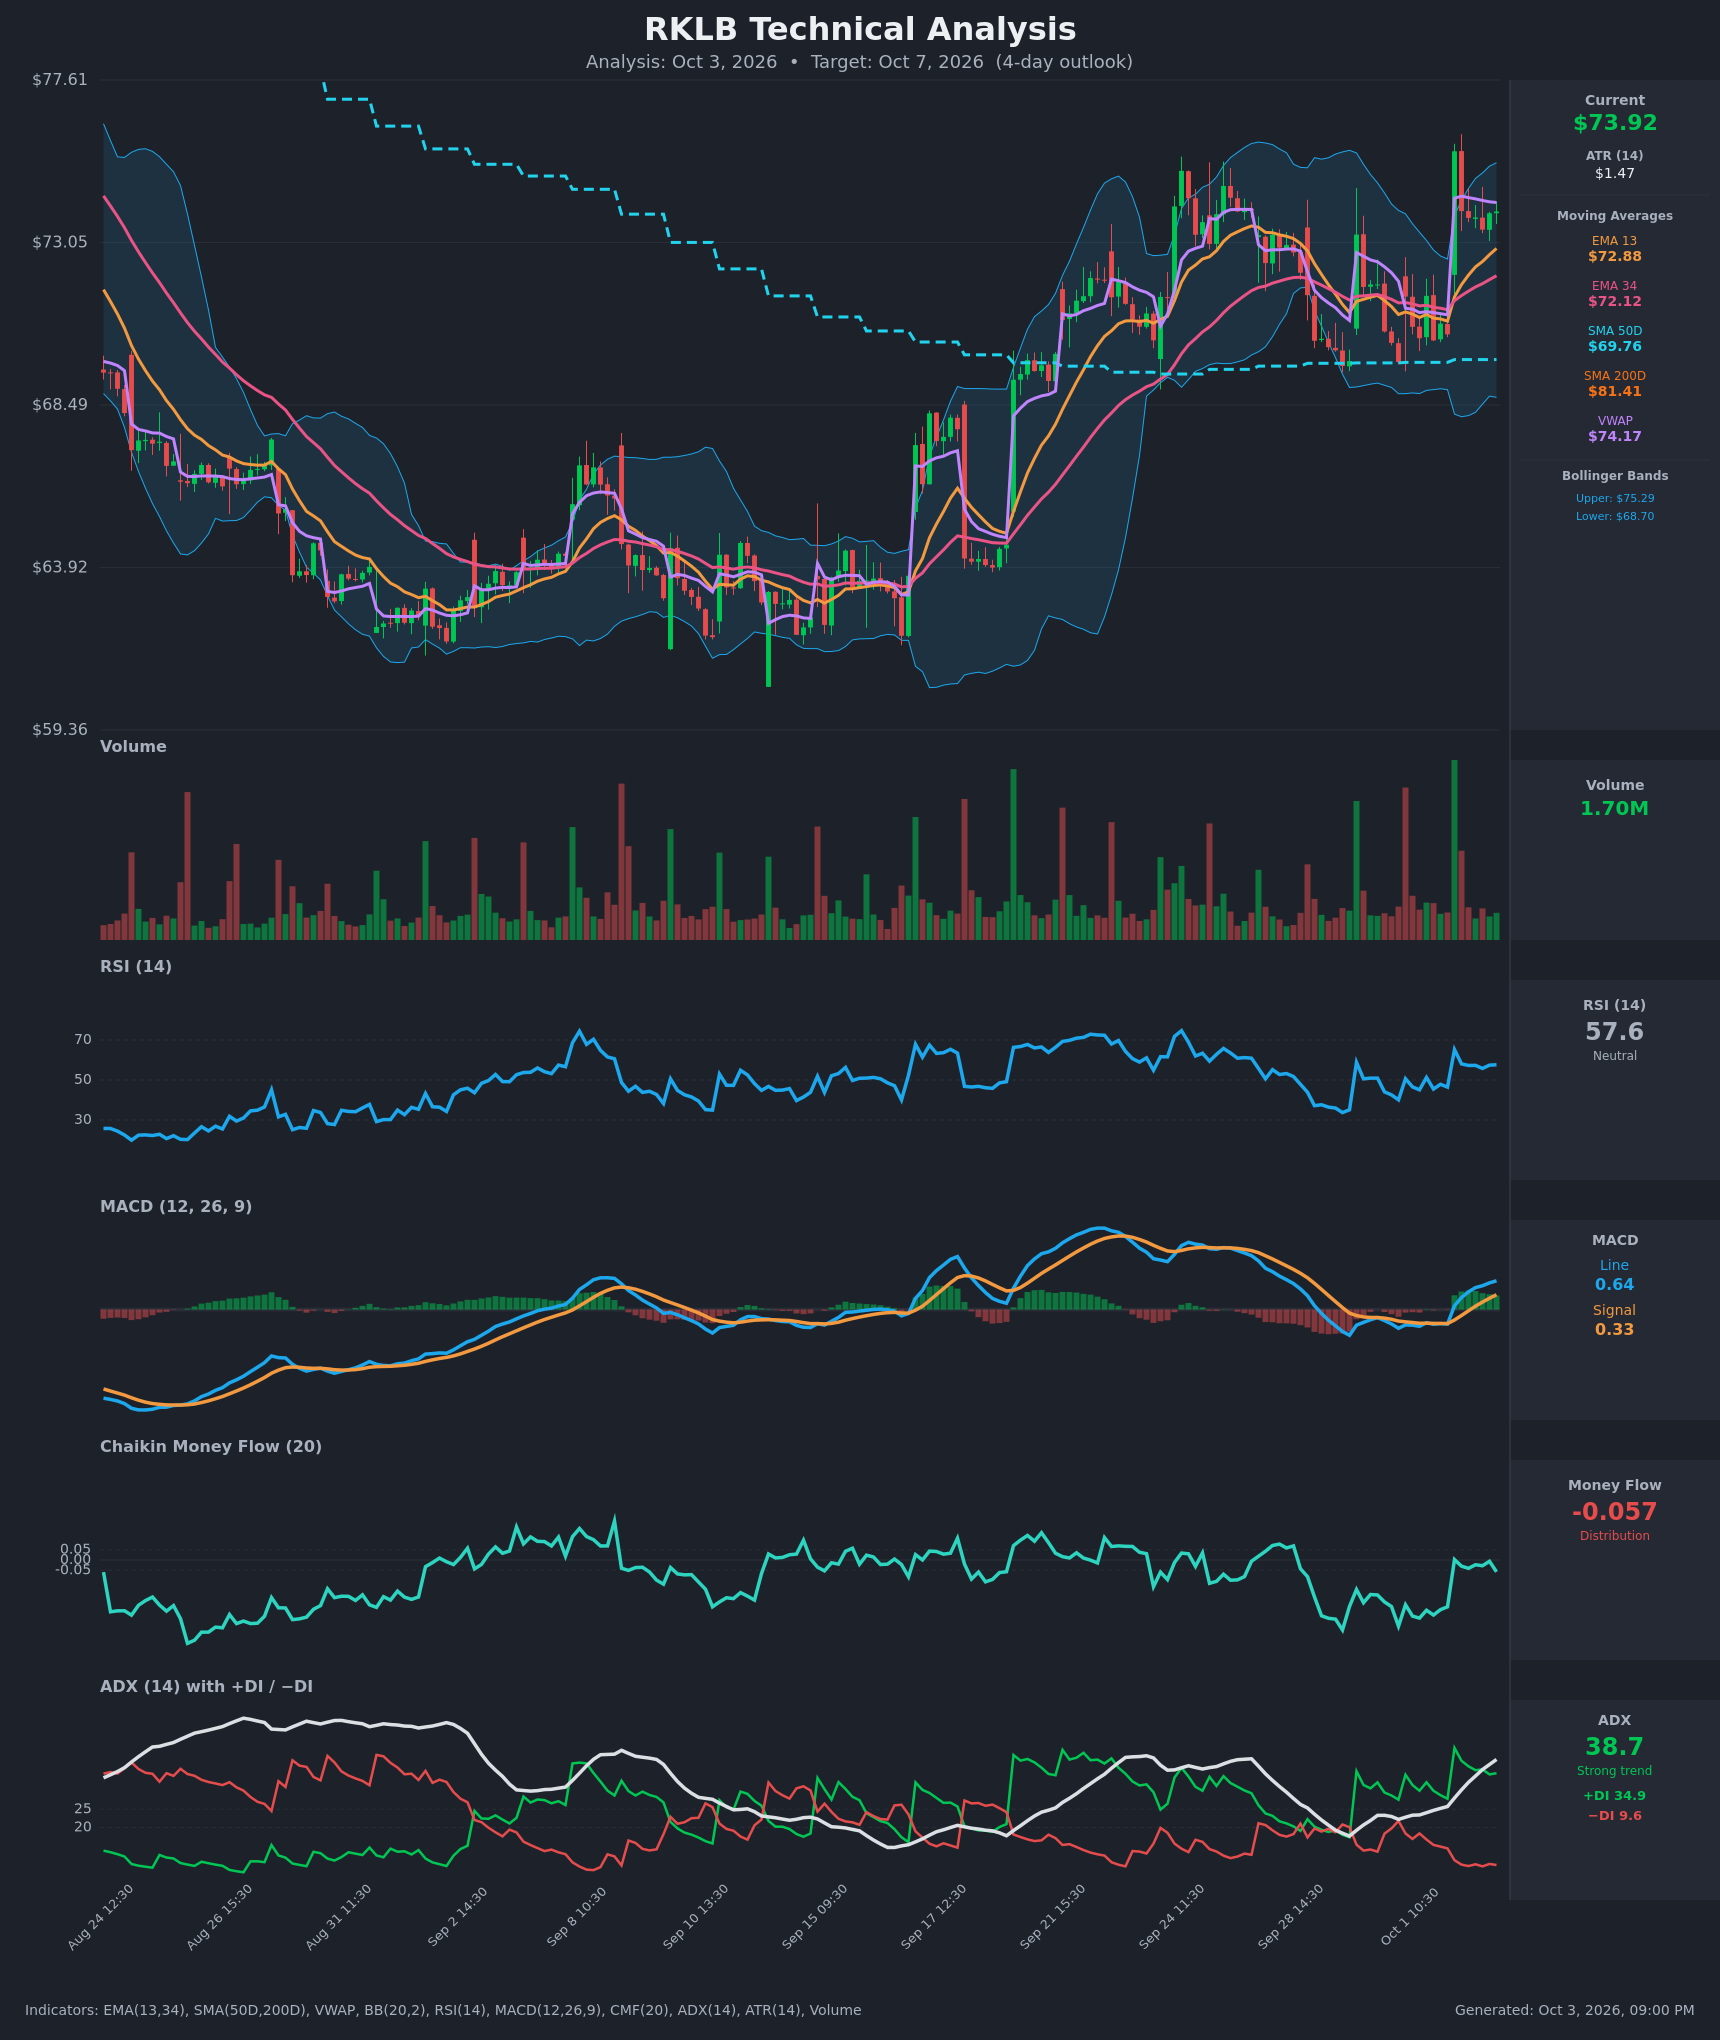
The technical read shaped strikes below in two ways:
- The condor's short call stays at $80, above the model's flag-breakout target zone ($77–$79).
- The bullish spread's short put sits at $70, beneath the model's $72.10 invalidation line.
Full technical write-ups: 3-day report → · 6-day report →
4 · Three ways the next six days can go
If RKLB pushes above the call wall ($80): The heaviest call OI for October 9 sits right there, and in a positive-gamma regime that kind of concentration tends to slow rallies as hedging leans against them. A clean close through $80 would also clear the upper implied rail at $80.48. That leaves the falling 200-day average at $81.41 as the next overhead marker, and it would mean the options market's range was too narrow. That's this article's kill switch.
If RKLB drifts between the walls: This is the base case. With positive dealer gamma and October 9 max pain at $70, hedging flows and expiring OI tend to pull price back toward the middle of the range rather than launch it. The unfilled gaps from $70.46 to $72.08 sit between spot and that $70 strike, so a drift back to fill them would still be "inside the range." So would chop near $75.
If RKLB breaks down through $70 toward the lower rail: The October 9 put wall is way down at $54, so there's no big put concentration nearby to catch a slide. The 50-day average ($69.76) and the $67.36–$67.70 cluster are the next structure. Even then, one rough estimate puts the gamma flip near $30, far below, so hedging should keep cushioning rather than accelerating the move. A break would most likely be an orderly gap fill, not a cascade.
5 · Three defined-risk structures
Prices are end-of-day midpoints as of October 2. All structures are hypothetical. Verify live prices before trading; these will be stale by the open.
Because options are priced richer than RKLB's delivered movement, the premium-selling structure leads. Remember the mechanics: a credit spread collects cash up front and bets price stays on the right side of the short strike. A debit spread pays up front for a defined directional bet.
If you expect the range to hold: October 9 iron condor
- Trade: Sell the October 9 $68/$66 put credit spread and the October 9 $80/$82 call credit spread
- Credit: $0.54 · Max profit: $54 · Max loss: $146 · Break-evens: $67.46 and $80.54
- Why it fits:
- The short strikes sit almost exactly on the implied rails ($67.36 / $80.48).
- The short call is the October 9 call wall.
- Positive dealer gamma and $70 max pain both describe a pinning environment.
- Options are priced ~13 vol points above delivered movement.
- Makes sense only if: you accept a skewed risk/reward ($54 to make, $146 to lose) in exchange for a high-probability range bet. Cheap IV means small credits.
- Invalidated if: RKLB closes above $80 or below $68
- Managing it: Close at roughly 50% of max credit. If either short strike is breached on a closing basis, close rather than hope. Exit no later than the day before expiration to avoid pin risk around the strikes.
- Liquidity note: The $80 calls traded 4¢ wide and the $82 calls 4¢ wide. The $68 puts were 8¢ wide and the $66 puts 4¢ wide. That's tight in pennies but a meaningful slice of a $0.54 credit, so work the order near the midpoint.
- Analyze this position →
If you lean bullish: October 9 $70/$67 put credit spread
- Trade: Sell the October 9 $70 put, buy the October 9 $67 put
- Credit: $0.64 · Max profit: $64 · Max loss: $236 · Break-even: $69.36
- Why it fits:
- The short strike is the $70 max-pain level, so a pin there still expires the short put worthless.
- It sits below the chart model's $72.10 invalidation and the October 1–2 gap zone.
- Term-structure sentiment and the one-month trend both lean bullish.
- Makes sense only if: you believe Friday's gap holds at least partially, so RKLB stays above $70 through October 9.
- Invalidated if: RKLB closes below $70
- Managing it: Take profits at ~50% of the credit. The near-term flow gauge just turned down even as the bigger trend stays up, which argues for a short leash. Close if the $72.10 technical line fails on a closing basis.
- Liquidity note: The $70 puts traded 6¢ wide and the $67 puts 8¢ wide. Fills should come near the midpoint, with modest slippage.
- Analyze this position →
If you lean bearish: October 9 $73/$70 put debit spread
- Trade: Buy the October 9 $73 put, sell the October 9 $70 put
- Debit: $1.12 · Max profit: $188 · Max loss: $112 · Break-even: $71.88
- Why it fits:
- It targets a gap fill toward the $70 max-pain strike.
- Put demand has rebuilt (skew steepened ~3.4 points in five sessions, and put volume is running above its recent average).
- Money flow didn't back Friday's gap.
- Selling the $70 put finances the trade at the level positioning gravitates toward.
- Makes sense only if: you think Friday's pop fades and the stock revisits the $70–$72 gap zone by October 9.
- Invalidated if: RKLB closes above $76
- Managing it: Take profits near $70–$71. Exit if the chart model's breakout fires (a close above $75.60). Don't hold into the final session hoping for the last dollar.
- Liquidity note: The $73 puts traded 10¢ wide and the $70 puts 6¢ wide. That's acceptable for a $1.12 debit.
- Analyze this position →
If none of these: no trade
Premium is rich versus delivered movement, so standing aside needs a reason. Here it is: rich-versus-realized doesn't make premium big. With IV rank at 13, the condor collects $54 to risk $146, and the bullish spread collects $64 to risk $236.
A single close beyond either short strike wipes out several winning trades. RKLB has just gapped twice in two sessions, and the chart model is openly watching for a breakout toward $78–$79. On top of that, the signals disagree:
- Bullish term sentiment and chart trend
- A cooling flow gauge
- A fresh bearish momentum crossover
If you can't size the condor small enough that a full loss is irrelevant, waiting for a better-paid setup is a legitimate choice. That could be a rebound in IV rank, or a decisive close through $75.60 or $72.10.
6 · Quick FAQ
What is RKLB's expected move this week? About ±$6.56 (±8.87%) into the October 9 expiration, a range of $67.36 to $80.48, per straddle pricing as of the October 2 close.
Is RKLB expected to go up or down over the next week? Options positioning as of October 2 is neutral. Bullish term-structure sentiment is offset by cooling flow and a heavy call wall at $80. That's a read of what traders have done, not a forecast. The actionable map is the $67.36–$80.48 range, with $70 max pain and the $80 call wall as the key levels.
Are RKLB options expensive right now? Two lenses give different answers:
- IV rank of 13/100 means option prices are lower than 87% of the past year's range.
- They're still running about 13 vol points above the movement RKLB has actually delivered, richer than about 76% of this stock's own recent readings.
The net verdict: modestly favorable for defined-risk premium selling, but credits are small.
Where is RKLB's biggest options support and resistance? For October 9, the call wall is $80 and the put wall is $54. Across all expirations, the heaviest put strike is $60. Max pain for October 9 is $70.
What invalidates this week's read? A close above $80, the October 9 call wall.
Methodology & disclosures. Data: end-of-day options-chain snapshot for RKLB, 2026-10-02, generated 2026-10-03T21:00:08.188Z. Prices shown are midpoints and will differ from live markets. Momentum/positioning scores and volatility-premium comparisons are descriptive measurements of past option flow and past price movement — not investment advice, signals, forecasts, or guarantees. All trade structures are hypothetical. Every structure shown has a defined maximum loss; you can lose the entire max-loss amount. Options involve substantial risk and are not suitable for all investors.