RKLB Options Are Pricing a $5.37 Swing Into September 18 — But the Chart Model Sees $61.70
Rocket Lab options imply a $57.58–$68.32 range into the September 18 expiration, with premium running about 26 vol points above what the stock has actually delivered. Here's the positioning map, the levels that matter, and three defined-risk ways to trade it.

The options market implies a $57.58–$68.32 range into the September 18 expiration; here's what's driving it and three defined-risk ways to trade it.
Published Sunday, September 13, 2026 · Data as of Friday, September 11, 2026 close
Explore the live RKLB options data in the Detailed Options Analyzer →
Quick answer
| Item | Answer |
|---|---|
| Market bias | Neutral with a bullish tilt |
| Spot (Friday, September 11 close) | $62.95 |
| Options-implied range (into September 18) | $57.58 – $68.32 (±$5.37, ±8.53%) |
| Major support | $45.00 — the September 18 expiration's own put wall (see the caveat below; the practical floor is $60.00) |
| Major resistance | $100.00 — the September 18 expiration's own call wall (practical ceiling is $70.00) |
| Max pain (September 18) | $69.00 |
| Dealer gamma regime (estimate) | Negative — one rough estimate suggests market-maker hedging amplifies moves rather than cushioning them; no flip level is estimable from today's chain |
| Volatility condition | Falling — IV rank 13/100 · premium rich: options priced about 26 vol points above delivered movement |
| Technical check | Diverges (bearish on both the 3-day and 5-day chart models) |
| Best-fitting strategy | Short put spread — sell the September 18 $60/$57 put spread while $60 holds |
| Analysis invalidated if | RKLB closes below $60.00 |
1 · What matters today
Rocket Lab closed Friday, September 11 at $62.95 after a brutal month — down about 21% over twenty sessions — but the options chain has quietly stopped screaming. Our read of options flow lands at neutral with a slight bullish tilt: short-dated sentiment is modestly call-leaning, call open interest is still building faster than put open interest, and 25-delta calls are actually more expensive than 25-delta puts, which is the opposite of the crash-protection bid you normally see in a stock that just fell a fifth.
The options market is pricing a $5.37 move in either direction through Friday's expiration — a $57.58–$68.32 band. The level that decides everything is $60.00, the strike carrying the heaviest put open interest across the whole chain. Above it, this is a range story. Below it, the positioning read is dead. Both chart models disagree with the tilt and look lower — more on that tension below.
2 · What the options market is pricing
What changed this week
Price barely moved: RKLB is down 1.35% over the past five sessions, a rounding error against the 21.4% it shed over the past twenty. Implied volatility — the market's estimate of how much RKLB will move, baked into option prices — did the same nothing: ATM IV finished at 67.9%, flat over five days (+0.04%) but down 35% over thirty. That is a chain that has fully exhaled after August.
Positioning got slightly more two-sided on Friday. Put volume ran at 0.51 per call — for every 100 calls that traded, about 51 puts changed hands — against a 0.36 pace over the trailing seven sessions, so relative put participation picked up even though calls still dominated. Open interest tells the calmer story: 0.81 puts held open per call, versus a 1.01 average over the past fourteen sessions. Traders have been closing downside protection, not adding it. Total option volume ran 1.34× its 20-day average.
The biggest genuine open-interest build among still-live contracts was in the October 2 $54 puts, which went from 219 contracts open to 1,729 (+1,510) — someone reaching for cheap far-out-of-the-money insurance a month forward. Closer in, the September 18 $70 calls added 873 contracts on 4,045 of volume. Into Friday's now-settled expiration, the $64 and $65 calls traded 6,924 and 7,465 contracts on their final day — settled history, not a live level.
One tension worth naming: the short-term and long-term trend reads point different ways. Over the past week the flow-and-price read is essentially flat, while the two-month and ten-week reads are firmly down (price −21.4% and −36.8% respectively). A stabilizing near-term tape inside an intact downtrend argues for short-dated structures and early profit-taking, not for planting a flag.
Expected move
The expected move is the move the options market is pricing in — derived from what straddles cost. Into September 18, that is ±8.53%, or ±$5.37 around $62.95, giving a $57.58 to $68.32 band. That rung prices off 61.6% ATM implied volatility on that specific expiration.
| Expiration | Implied move | Range around $62.95 |
|---|---|---|
| September 18 (7 days) | ±8.53% | $57.58 – $68.32 |
| September 25 (14 days) | ±12.32% | $55.19 – $70.71 |
| October 16 (35 days) | ±20.95% | $49.76 – $76.14 |
The ladder widens roughly with the square root of time — there is no step-up or kink anywhere in it, which means the chain is not bracing for any dated event inside this window. It is pricing generic Rocket Lab volatility, nothing more.
Volatility
ATM IV sits at 67.9% with an IV rank of 13/100 — where today's IV sits versus the past year, so 13 means cheaper than 87% of the past year's readings. The percentile read is even more extreme: only about 2% of the past year's sessions closed with cheaper options than Friday's. Current IV is well under both its 30-day average (79.4%) and its 90-day average (92.1%), and it fell 3.0% on the day. The front-month read is unavailable today because Friday was itself an expiration day — a calendar artifact, not missing data.
Underneath that, the stock has gone unusually quiet for itself: 20-day realized volatility is 41.6% annualized, which is dramatically below this name's own recent norm. Five-day realized movement is running at about 1.06× the 20-day pace, so the quiet is not accelerating away yet.
Premium rich or cheap: the volatility risk premium — the gap between how much movement options are priced for and how much RKLB has actually delivered — sits at roughly 26 vol points (67.9% implied against 41.6% delivered). That is richer than about 94% of this stock's own recent readings, and the snapshot read of the same gap confirms it is stretched well above normal for this name. So the two lenses genuinely disagree: options are cheap versus their own 52-week history, and expensive versus what the stock has been doing. The path matters here — three weeks ago the gap was negative (about −7 vol points on August 24). The flip is largely mechanical: August's violent sessions have been rolling out of the 20-day realized-volatility window, dragging the realized leg down while implied volatility drifted. Mechanical or not, the current combination — IV rank 13 with a 94th-percentile premium over delivered movement — favors collecting premium rather than owning it, provided you keep the risk defined.
Skew and sentiment
Skew measures whether puts and calls the same distance from the stock price cost the same. Here they emphatically do not — and not in the usual direction. The 25-delta put prices at 65.9% IV against 68.6% for the 25-delta call, so calls run about 2.7 vol points richer than puts, against a 60-day norm of 2.5 vol points for this name. Traders are paying up for upside, not for crash protection — which is a genuinely unusual footprint one month into a 21% drawdown. That said, the call-richness has flattened from the past two weeks, when the same measure averaged roughly 4.5 vol points.
Sentiment in short-dated options is mildly constructive across the curve: the 0–7 day bucket scores +19, the 7–30 day bucket +16, the 30–60 day bucket +26, and the 60–120 day bucket +32 — the model labels that a "bullish recovery" pattern, with positioning building further out than near-term. But all four are cooler than their seven-session averages (+35/+35/+34/+44), so the constructive lean is fading at the margin rather than intensifying.
The key levels map
A note before the ladder: the September 18 expiration's own biggest open-interest strikes are $100 on the call side (9,291 contracts) and $45 on the put side (7,377). Those are the technically correct walls for that expiration, but they are relics from when RKLB traded far higher — a 52-week high of $151 will do that — and neither is a practical rail for a $62.95 stock this week. The whole chain's heaviest strikes are far more useful: $70 calls (35,212 contracts open) and $60 puts (29,570). Where the expiration-specific and chain-wide walls disagree this sharply, trade the chain-wide ones.
| Level | Price | Why it matters |
|---|---|---|
| Call wall, September 18 expiration | $100.00 | Heaviest call open interest on that expiration (9,291) — a legacy strike, not a live ceiling |
| 200-day moving average | $79.91 | Price sits 21.2% below it |
| Swing resistance / heavy call OI | $80.00 | 22,121 calls open chain-wide; fourth-largest gamma cluster |
| 50-day moving average | $72.31 | Price sits 12.9% below it |
| Call wall (whole chain) | $70.00 | 35,212 calls open, 8,318 of them on September 18 — the practical ceiling |
| Max pain (September 18) | $69.00 | The price where the most option value would expire worthless; expirations sometimes gravitate toward it |
| 20-day moving average | $68.38 | Price sits 7.9% below it |
| Top of implied range | $68.32 | 1σ upper bound into September 18 |
| Swing resistance | $64.51 | Recent pivot cluster; the chart models put resistance at $64.60–$64.95 |
| Last close | $62.95 | Friday, September 11 |
| Swing support | $61.45 | Recent pivot cluster; chart models mark $61.00 |
| Put wall (whole chain) | $60.00 | 29,570 puts open, 6,029 on September 18 — the practical floor and the kill switch for this read |
| Swing support | $58.20 | Next pivot below the put wall |
| Bottom of implied range | $57.58 | 1σ lower bound into September 18 |
| Heavy put OI | $55.00 | 20,751 puts open chain-wide, 6,052 on September 18 |
| Put wall, September 18 expiration | $45.00 | 7,377 puts, but far out of the money — tail insurance, not a shelf |
The five largest gamma clusters in the chain sit at $65, $60, $70, $55 and $80 — three of the top four are stacked inside the implied range, which is why the $60–$70 corridor is the map for this week.
Positioning and unusual flow
The dealer-gamma read is an estimate, not observed inventory, and it reads negative both chain-wide and for the September 18 expiration specifically. In that regime, market makers hedging the options they've sold tend to amplify moves rather than dampen them — sell into weakness, buy into strength. No gamma flip level can be estimated from today's chain, so treat the regime as a texture note rather than a tripwire: moves that start tend to extend.
Three live flow items stood out on Friday:
- October 9 $54 puts — 1,279 contracts traded against 152 open, about $138,000 of premium. Turnover more than eight times the existing position: fresh, cheap downside insurance being bought a month out.
- September 18 $63 calls — 2,498 contracts and roughly $535,000 of premium, the single largest dollar-premium line in the chain. At-the-money weekly calls attracting the most money is a directional-lottery footprint, not a hedging one.
- September 18 $70 calls — 4,045 contracts traded, open interest up 873 to 8,318, about $168,000 of premium at 41.5¢ a contract. Buyers are stacking right at the chain's call wall.
3 · Technical check
Both chart models disagree with the options read, and that is the most interesting thing in this article. The 3-day model (target date September 16) is bearish, targeting $61.90 inside a projected $60.70–$64.40 band. The 5-day model (target date September 18, matching our window exactly) is also bearish, targeting $61.70 inside a projected $59.80–$65.00 band. Both classify as Diverges: the direction contradicts the options tilt, even though both targets sit comfortably inside the options-implied range.
The reasoning is consistent across both reports. Price is below the short-term EMA cluster near $63.56–$63.86, the Chaikin Money Flow read has stayed in distribution territory (−0.066) through the entire bounce-and-fade sequence, and Friday's push to $64.61 was rejected right at that EMA/VWAP band. The one countervailing signal is directional strength: ADX is ticking up around 23 with +DI (26.0) above −DI (22.2), a nascent but unconfirmed uptrend. The 5-day model's dominant scenario (45% weight) calls for a retest of $60.20–$60.50 and is invalidated by a sustained close above $64.95.
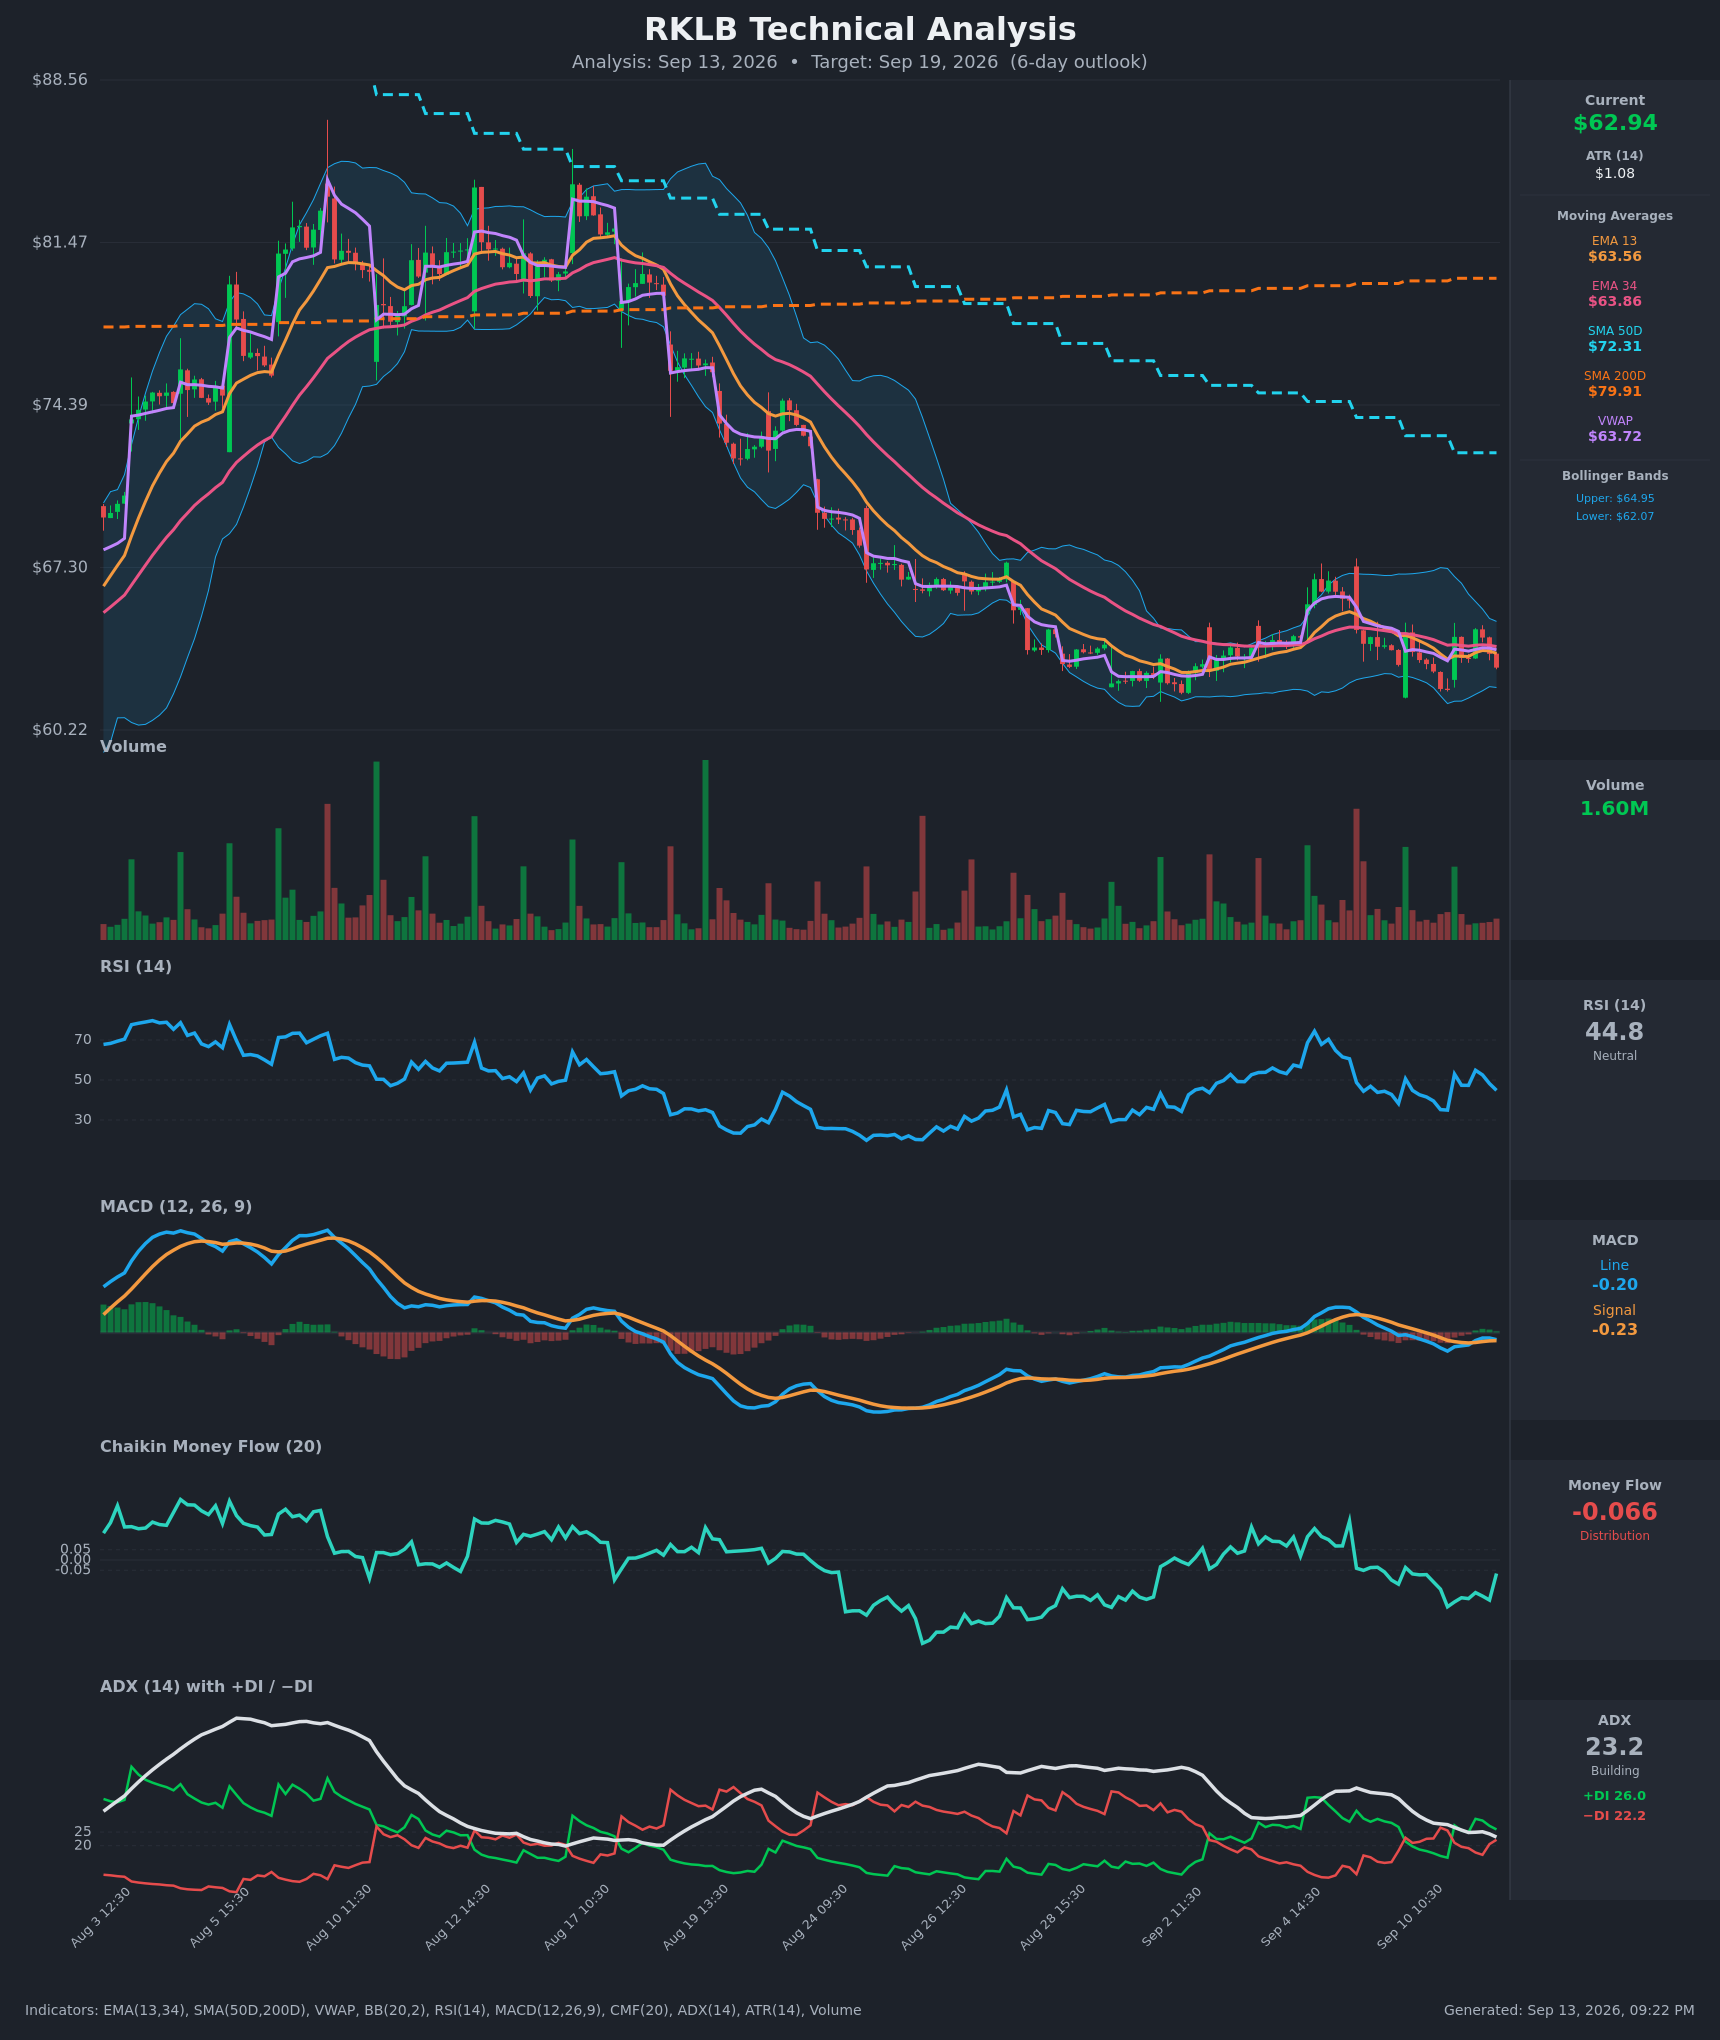
Model vs. Market: The options market implies $57.58–$68.32 into September 18; the 5-day technical model targets $61.70. The chart is calling for the lower third of a range the options market considers wide open — which means the two views are not actually incompatible, they simply disagree about where inside the band price finishes. A close above $64.95 would resolve it in the options read's favor; a close below $60.00 resolves it in the chart's.
Practically, the divergence pulled our short strikes wider rather than flipping direction: the bullish structure below sits at $60/$57 rather than hugging the money, and the range structure's short call sits all the way up at the $70 wall.
Full technical write-ups: 3-day report → · 5-day report →
4 · Three ways the next five days can go
If RKLB pushes above the call wall ($70.00): that strike carries 35,212 open call contracts chain-wide, the largest pile anywhere, and heavy overhead call open interest tends to slow rallies as dealers sell stock into strength to stay hedged. A clean break through leaves thinner positioning until $75 and then the $80 cluster. Getting there requires roughly an 11% move in five sessions — above the 1σ band, so this is the tail, not the base case.
If RKLB drifts between the walls ($60–$70): this is the base case the positioning supports. Max pain for September 18 sits at $69.00 — the point where the most option value would expire worthless — and the expiration's near-money call open interest is concentrated at $70 while its put open interest clusters at $55 and $60. With the stock at $62.95 there is more room to drift up inside that corridor than down, which is precisely where the bullish tilt in the bias comes from. Expect chop, with expiring open interest exerting a mild upward pull as Friday approaches.
If RKLB breaks below the put wall ($60.00): the 29,570 puts open at that strike stop acting as a floor and start acting as an accelerant. With the dealer-gamma estimate already negative, one rough read suggests hedging flows would amplify the selling rather than cushion it, and the next meaningful shelf is the $57.58 bottom of the implied range, then the $55 put cluster. This is also the branch the two chart models favor.
5 · Three defined-risk structures
Prices are end-of-day midpoints as of Friday, September 11, 2026. All structures are hypothetical. Verify live prices before trading — these will be stale by the open.
Premium is rich versus delivered movement (94th percentile for this name), so credit structures lead here. All three below collect premium rather than paying it.
If you lean bullish: short put spread (September 18 $60/$57)
- Trade: Sell the September 18 $60 put, buy the September 18 $57 put. A credit spread means you collect cash up front and keep it if the stock stays above your short strike.
- Credit: $0.62 · Max profit: $62 per spread · Max loss: $238 · Break-even: $59.38
- Why it fits: The short strike sits exactly on the chain's heaviest put strike ($60.00, 29,570 contracts), the break-even sits below the bottom of the 1σ implied range, and you are selling premium that is running roughly 26 vol points above what RKLB has actually delivered.
- Makes sense only if: you believe the $60 shelf holds through Friday — that is the entire thesis in one number.
- Invalidated if: RKLB closes below $60.00.
- Managing it: Close at roughly 50% of max credit; with the two-month trend still down, take profits early rather than squeezing the last dime. Re-evaluate at the September 16 checkpoint, and if RKLB closes through $60, close the spread rather than hoping into Friday.
- Liquidity note: The $60 puts quoted 8¢ wide (90¢ bid / 98¢ ask) on 1,609 contracts; the $57 puts are 4¢ wide but that is 12% of a 32¢ mid, so work the fill rather than paying the ask.
- Analyze this position →
If you expect the range to hold: iron condor (September 18 $57/$60 — $70/$73)
- Trade: Sell the $60 put and buy the $57 put; sell the $70 call and buy the $73 call, all September 18.
- Credit: $0.84 · Max profit: $84 · Max loss: $216 · Break-evens: $59.16 and $70.84
- Why it fits: Both short strikes sit directly on the chain's walls — the $60 put wall and the $70 call wall — and both break-evens sit outside the $57.58–$68.32 implied range. This is the structure that matches the bias most honestly: neutral, with the extra room to the upside coming for free.
- Makes sense only if: you accept that a negative dealer-gamma estimate means a breakout, once started, tends to run. Condors hate acceleration.
- Invalidated if: RKLB closes below $60.00 or above $70.00 — at either wall, close the threatened side.
- Managing it: Target 50% of max credit; close the whole thing by the September 16 checkpoint if price is pinned near either short strike, since gamma risk in the final two sessions is what turns a small winner into the max loss.
- Liquidity note: The $70 calls are 3¢ wide on 4,045 contracts of volume and the $73 calls 1¢ wide — the call side fills easily; the put side is the one to leg carefully.
- Analyze this position →
If you lean bearish: short call spread (September 18 $67/$70)
- Trade: Sell the September 18 $67 call, buy the September 18 $70 call.
- Credit: $0.45 · Max profit: $45 · Max loss: $255 · Break-even: $67.45
- Why it fits: This is the structure that sides with the chart models, both of which target the low $60s. The long leg sits at the $70 call wall, capping the damage right where the heaviest overhead open interest would slow a rally anyway.
- Makes sense only if: you are comfortable fighting the max-pain magnet at $69.00 and a skew that currently prices calls richer than puts — both lean against this trade. The reward is thin for the risk; size accordingly.
- Invalidated if: RKLB closes above $67.00.
- Managing it: Take 50% and leave. Given the negative-gamma estimate, a squeeze through $67 can travel fast, and a $45 credit does not survive much hope.
- Liquidity note: The $67 calls quoted 8¢ wide (82¢ / 90¢) on 1,465 contracts; the $70 calls 3¢ wide. Acceptable, but you are giving up a meaningful slice of a 45¢ credit at market.
- Analyze this position →
If none of these: no trade
Here is the honest case for standing aside even with premium this rich. The richness is partly an artifact: 20-day realized volatility has collapsed to 41.6% — unusually low for this stock — because August's violent sessions are rolling out of the measurement window, not because RKLB has become a calm name. Sell the 94th-percentile gap and you are implicitly betting that quiet persists in a stock that fell 21% in a month, inside an estimated negative-gamma regime where moves get amplified, with both chart models pointing at the lower end of the range. The credits on offer ($45 to $84 against $216 to $255 of risk) are not generous enough to be wrong twice. If you cannot watch the $60 line intraday, waiting for a decisive break of the $60–$70 corridor and trading the resolution is a perfectly respectable fourth option.
6 · Quick FAQ
What is RKLB's expected move this week? ±$5.37, or ±8.53%, into the September 18 expiration — a $57.58 to $68.32 range, per the options market's straddle pricing as of the September 11 close.
Is RKLB expected to go up or down over the next five days? Options positioning as of September 11 leans neutral with a slight bullish tilt — call-side open interest is still building, 25-delta calls price richer than puts, and the stock sits closer to the put wall than the call wall inside the $60–$70 corridor — but that is a read of what traders have done, not a forecast. The actionable map is the $57.58–$68.32 range and the $60.00/$70.00 levels. Note that both chart models disagree and target the low $60s.
Are RKLB options expensive right now? Two lenses, two answers. IV rank 13/100 says option prices are lower than 87% of the past year's readings; on top of that, they are running about 26 vol points above the movement RKLB has actually delivered — richer than about 94% of this stock's own recent readings. Cheap versus history, expensive versus reality, which on balance favors collecting premium with defined risk.
Where is RKLB's biggest options support and resistance? For the September 18 expiration itself, the walls print at $45.00 (puts) and $100.00 (calls), both legacy strikes far from the money. The levels that actually matter are the chain-wide walls: $60.00 put wall and $70.00 call wall.
What invalidates this week's read? A close below $60.00.
Methodology & disclosures. Data: end-of-day options-chain snapshot for RKLB, 2026-09-11, generated 2026-09-13T21:21:58.322Z. Prices shown are midpoints and will differ from live markets. Momentum/positioning scores and volatility-premium comparisons are descriptive measurements of past option flow and past price movement — not investment advice, signals, forecasts, or guarantees. All trade structures are hypothetical. Every structure shown has a defined maximum loss; you can lose the entire max-loss amount. Options involve substantial risk and are not suitable for all investors.