RKLB Options Are Pricing a $5.37 Move Into September 25 — Our Model Leans Mildly Higher, the Charts Lean Lower
The options market implies a $59.20–$69.94 range for Rocket Lab into the September 25 expiration, with max pain at $67 and the heaviest call open interest capping $70. Here's what the positioning says, where the chart model disagrees, and three defined-risk ways to trade the corridor.
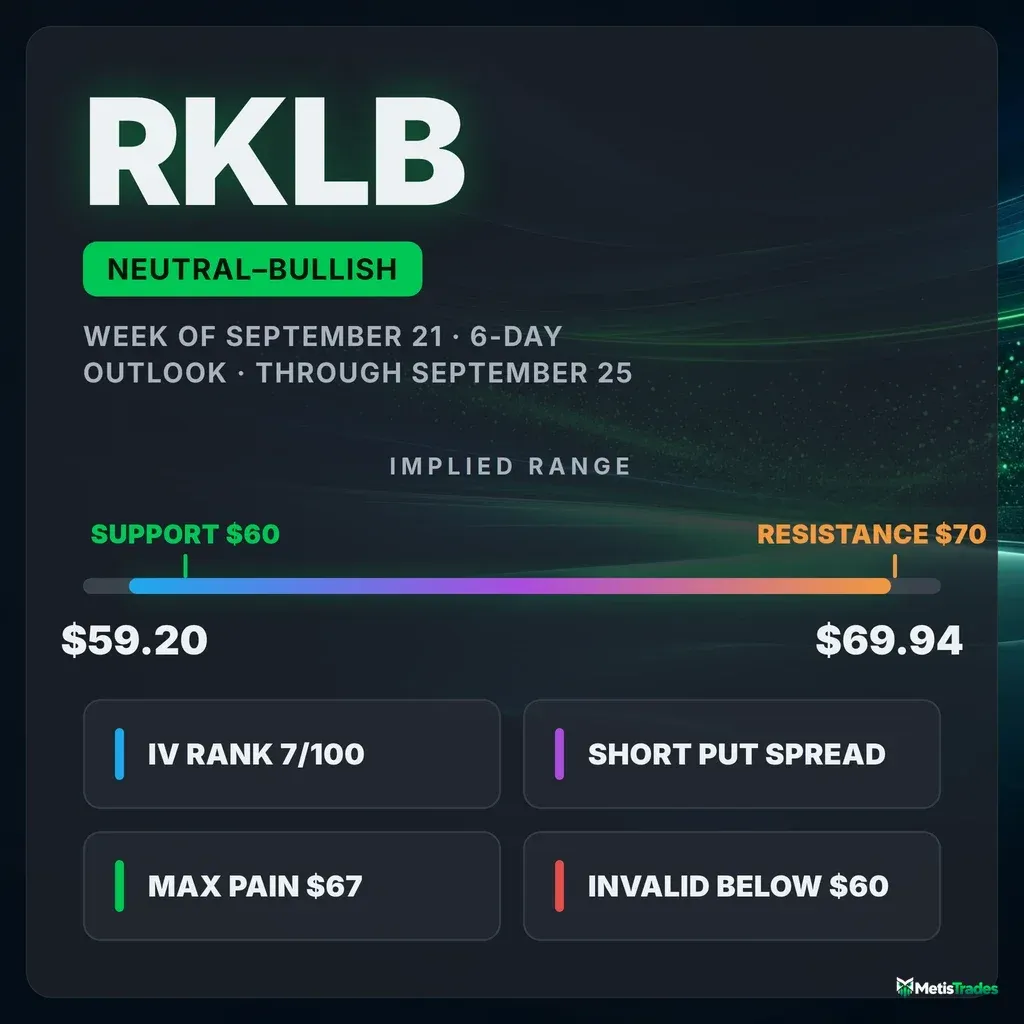
The options market implies a $59.20–$69.94 range into the September 25 expiration; here's what's driving it and three defined-risk ways to trade it.
Published Saturday, September 19, 2026 · Data as of Friday, September 18, 2026 close
Explore the live RKLB options data in the Detailed Options Analyzer →
Quick answer
| Item | Answer |
|---|---|
| Market bias | Neutral with a bullish tilt |
| Options-implied range (into Sep 25) | $59.20 – $69.94 (±8.31%, or ±$5.37) |
| Last close (Friday, September 18) | $64.57 |
| Major support | $60.00 (Sep 25 put wall) |
| Major resistance | $70.00 (Sep 25 call wall) |
| Max pain (Sep 25) | $67.00 |
| Dealer gamma regime (estimate) | Positive — hedging tends to dampen moves; flip level ≈ $30 |
| Volatility condition | Falling — IV rank 6.84/100 · premium rich: options priced ~18 vol points above delivered movement |
| Technical check | Diverges (bearish, 3-day and 6-day chart models) |
| Best-fitting strategy | Short put spread (Sep 25 $62/$58), conditional on $60 holding |
| Analysis invalidated if | RKLB closes below $60.00 |
1 · What matters today
Rocket Lab closed Friday, September 18 at $64.57 after a 2.6% gain over five sessions that interrupted a 20-day slide of 11.5%. Option positioning for the September 25 expiration is mildly constructive, not emphatically so: the market is pricing a move of about ±$5.37 either way — that's the move implied by what straddles cost — giving a $59.20 to $69.94 corridor. Inside that corridor, the heaviest put open interest sits at $60 and the heaviest call open interest at $70, with max pain — the price where the most option value would expire worthless — at $67, above Friday's close. Short-dated flow still leans call-side and 25-delta calls are pricier than the equivalent puts, which is unusual. The chart models disagree and point lower. A close below $60.00 ends this read.
2 · What the options market is pricing
What changed this week
The story of the week is collapsing volatility into a bounce that the longer trend doesn't endorse. At-the-money implied volatility — the market's estimate of how much RKLB will move, baked into option prices — finished at 65.0%, down 4.6% on the day, 4.2% over five sessions and 35.1% over thirty. That sits well under the 30-day average of 73.6% and miles under the 90-day average of 91.0%. IV rank finished at 6.84/100 against a 7-day average of 12.8 and a 14-day average of 10.9 — even by the standards of the past two weeks, option prices deflated.
Flow stayed call-tilted. Put/call volume came in at 0.47 — for every ten call contracts traded there were under five puts — against a 7-day average of 0.49 and a 14-day average of 0.42. Open interest tells a slightly more defensive story: put/call open interest is 0.78 versus 0.87 fourteen days ago, but yesterday's build was put-heavy, with put open interest adding 21,670 contracts against 7,142 on the call side. The single largest open-interest change was in the October 16 $40 puts, which grew by 6,316 contracts to 7,430 — deep-out-of-the-money disaster insurance, not a directional bet. Total option volume ran 1.67× its 20-day average. Into Friday's now-settled expiration, the $65 calls traded 11,722 contracts and shed 1,055 of open interest as they expired worthless — settled history, not a live level.
The multi-horizon trend read is openly divergent, and that tension deserves naming: the short-term read is bullish on a 2.6% five-day gain, while the medium-term read is bearish on a 11.5% twenty-day decline and the long-term read bearish on a 21.8% fifty-day decline. The past week's pop runs against a market that is still deeply underwater over two months — near-term flow and the bigger trend are pointing different ways, and that argues for short-dated structures rather than anything you have to hold for a month.
Expected move
Into the September 25 expiration, the options market is pricing a move of ±8.31%, or about ±$5.37 around Friday's $64.57 close — a $59.20 to $69.94 range. That figure comes straight from what at-the-money straddles cost at that expiration and is a one-standard-deviation approximation, not a guarantee.
| Expiration | Implied move | Range around $64.57 |
|---|---|---|
| Friday, Sep 25 (7 DTE) | ±8.31% | $59.20 – $69.94 |
| Oct 2 (14 DTE) | ±12.12% | $56.74 – $72.40 |
| Oct 16 (28 DTE) | ±18.09% | $52.89 – $76.25 |
The ladder scales roughly with the square root of time, with a mild upward kink in at-the-money IV at the October 16 monthly (65.3% versus 60.0% at September 25) — that rung carries the chain's biggest open-interest concentrations, so its pricing reflects positioning as much as calendar risk.
Volatility
Chain-wide at-the-money IV is 65.0%; the September 25 expiration's own at-the-money read is a cooler 60.0%. IV rank is 6.84/100, meaning today's implied volatility is cheaper than roughly 93% of the past year's readings — a genuinely depressed level for a name whose 90-day average IV is 91%. Front-month term-structure read is unavailable today: Friday was an expiry day, so the nearest expiration was zero days out and the front-month figure cannot be interpolated. It returns on the next trading day.
Two readings versus this stock's own recent history are worth flagging, and "unusual" here means unusual for RKLB, not versus the broader market. Twenty-day realized volatility of 47.0% is unusually depressed for this name — the past month has been quiet by Rocket Lab standards. At the same time, the ratio of 5-day to 20-day realized movement is running well above its own norm at 1.36, meaning the last week has been meaningfully livelier than the month that preceded it. Quiet month, noisy week.
Premium rich or cheap. The volatility risk premium — the gap between how much movement options are priced for and how much RKLB has actually delivered — sits at about 18 vol points (65.0% implied against 47.0% delivered over twenty days). When that gap is positive, option sellers have been collecting more than realized movement cost them. Today's reading is richer than about 88% of this stock's own recent readings, which is the opposite of what the IV rank alone suggests — implied volatility has fallen fast, but realized movement has fallen faster. The gap has been narrowing for two sessions (from roughly 31 vol points on September 16), with no sign change. Net: IV rank 6.84 says option prices are low versus the past year, but an 88th-percentile premium over delivered movement says they are still rich versus what the stock has actually been doing — a combination that modestly favors collecting premium this week rather than owning it, in defined-risk size.
Skew and sentiment
Skew measures whether puts and calls the same distance from the stock price cost the same. Here they don't — and not in the usual direction. The 25-delta put trades at 64.1% implied volatility against 68.0% for the 25-delta call, so calls are about 3.8 vol points richer than puts, against a 60-day norm of 2.4 points of call richness. Traders are paying up for upside participation, not crash protection, and by a wider margin than usual for this name. That is a complacency reading as much as a bullish one, but it is not the fingerprint of a market bracing for a fall.
Sentiment across expiration dates is positive but cooling. The 0–7 day bucket scores +16 against a 7-day average of +21; the 7–30 day bucket +15 against +23; the 60–120 day bucket is the strongest at +33. The overall regime label is "Bullish Recovery" — positioning is building further out the curve rather than in the front week. One counterweight from our leading positioning read: over the trailing ten sessions price rose about 2% while the positioning score fell sharply, and that price-versus-positioning gap is the kind of condition that has historically preceded a turn lower. It is an early, unconfirmed read by construction, and it is why this article's lean is a tilt and not a conviction call. One more "versus its own norm" observation: put-side sweeps dominated the peer-unusual set on Friday (two call contracts versus four puts) at a rate well outside this stock's recent pattern.
The key levels map
| Level | Price | Why it matters |
|---|---|---|
| Whole-chain heaviest call strike | $80.00 | 38,507 contracts of call open interest across all expirations — far overhead, not a September 25 level |
| Swing resistance | $72.94 | Heuristic swing-pivot cluster from recent price structure |
| Call wall (Sep 25) | $70.00 | 4,605 contracts — the heaviest call open interest for this expiration; also the chain's second-largest gamma strike |
| Top of implied range | $69.94 | Upper rail of the one-standard-deviation move into Sep 25 |
| 50-day moving average | $69.89 | Price sits 7.6% below it; sloping down and acting as overhead resistance |
| Swing resistance | $67.70 | Nearest structural ceiling from recent pivots |
| Max pain (Sep 25) | $67.00 | Where the most option value would expire worthless — expirations sometimes gravitate toward it |
| Largest gamma strike | $65.00 | Biggest total gamma-weighted open interest in the chain — a natural magnet |
| 20-day moving average | $64.98 | Price is 0.6% below it — effectively at the line |
| Last close | $64.57 | Friday, September 18 settlement |
| Nearest swing support | $64.51 | Immediately beneath spot |
| Swing support | $61.45 | Second structural shelf |
| Put wall (Sep 25 and whole chain) | $60.00 | 3,094 contracts at this expiration, 33,592 across the chain — the rare case where the horizon expiration and the aggregate agree |
| Bottom of implied range | $59.20 | Lower rail of the Sep 25 expected move |
| Gamma flip estimate | ≈ $30.00 | One rough estimate of where hedging flips from dampening to amplifying — far below spot, so not in play this week |
Note the disagreement worth naming: the September 25 expiration's call wall is $70, while the whole chain's heaviest call strike is $80. For this six-day window, $70 is the level that matters; $80 is where longer-dated positioning has piled up.
Positioning and unusual flow
One rough estimate of dealer gamma positioning puts the September 25 expiration in a positive regime, which under the standard (unverified) assumption that dealers are long calls and short puts implies market-maker hedging tends to dampen moves rather than amplify them into this expiration. The all-expiration estimate agrees, and puts the flip level near $30 — far enough below spot that fragility is not this week's story. Treat all of that as an estimate, not observed inventory.
Three flow items stood out among live contracts. The September 25 $65 calls were the week's busiest name-specific trade, with 2,713 contracts changing hands against 1,275 of open interest and roughly $532,000 of premium — right at the money, six days out, in the chain's biggest gamma strike. The September 25 $73 calls added 1,503 contracts of open interest to 2,380 on 972 lots of volume — cheap upside lottery tickets well above the call wall. And on the other side, the November 20 $60 puts saw 474 contracts trade on a brand-new strike for roughly $249,000 of premium, which is real money positioning for downside two months out rather than this week.
3 · Technical check
Both chart models run bearish, and both land inside the options-implied corridor. The 3-day model targets $63.20 by September 22, with a projected range of $62.20 to $65.80. The 6-day model targets $63.00 by September 25, with a projected range of $61.00 to $66.50 and key levels of support at $61.20 and resistance at $64.90. The reasoning is consistent across both: MACD crossed below its signal line on September 18 immediately after the failed push toward $68, Chaikin Money Flow is negative at −0.057 (distribution into the bounce), and −DI sits above +DI — though with ADX at 17.7 the tape is formally non-trending, so conviction is tempered by the models themselves.
Classification: Diverges on direction, contained on magnitude. The chart models point lower while the options positioning tilts mildly higher, but their targets — $63.20 and $63.00 — sit comfortably inside the $59.20–$69.94 options corridor and barely 2.4% below Friday's close. This is not a market and a model disagreeing about the size of the move; it's a disagreement about the sign of a small one.
Model vs. Market: The options market implies $59.20–$69.94 into September 25; the 6-day technical model targets $63.00 with a projected range of $61.00 to $66.50. The gap is directional, not dimensional — the chart's bear case lives entirely inside the range options are already pricing, so a resolution requires a close outside roughly $61 on one side or $66.50 on the other.
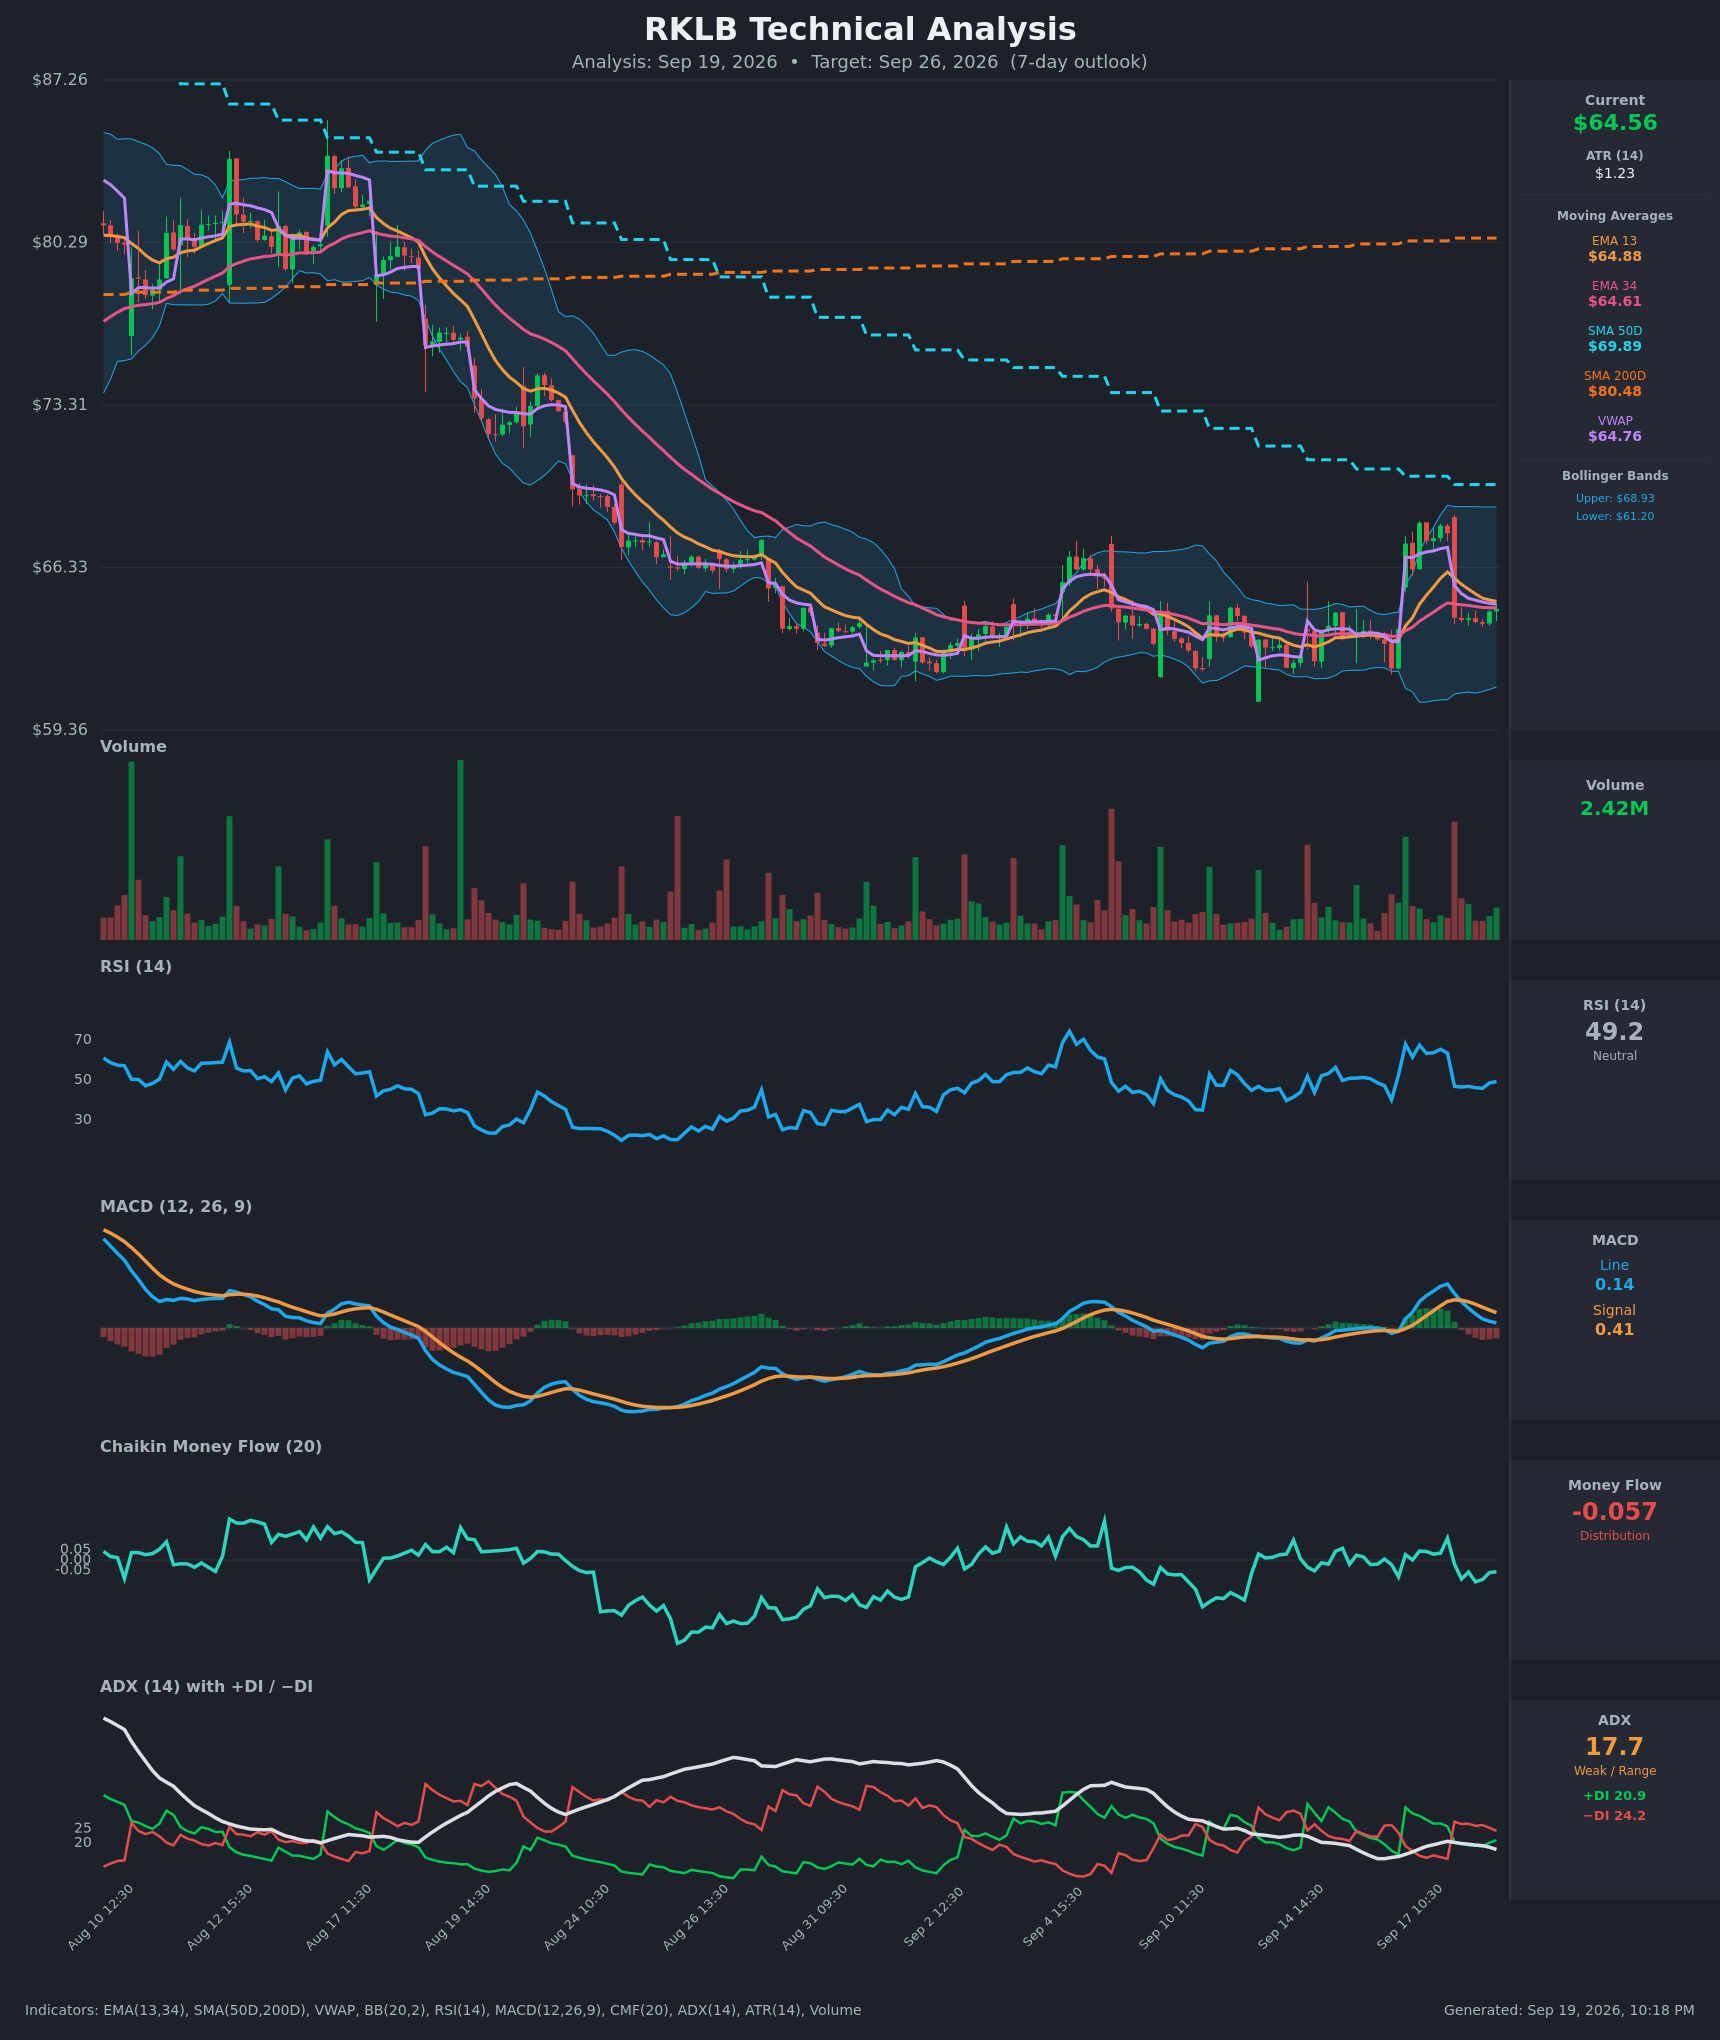
Practical effect on strikes below: the bearish technical read keeps the iron condor's short put at $61 rather than $62, and it is the reason a bear call spread appears here at all rather than being a token third option.
Full technical write-ups: 3-day report → · 6-day report →
4 · Three ways the next six days can go
If RKLB pushes above the call wall ($70.00): The heaviest call open interest for this expiration sits there, and strikes with that much stacked open interest tend to slow rallies as dealers hedge against them. $70 also coincides almost exactly with the top of the implied range ($69.94) and sits just above the declining 50-day moving average at $69.89 — three reasons a first touch is more likely to stall than to extend. A clean close through it leaves thinner September 25 positioning overhead until the $73 strike, where 2,380 contracts of call open interest have accumulated.
If RKLB drifts between the walls: This is the base case the positioning supports. Max pain for September 25 is $67, three dollars above Friday's close, and the $65 strike carries the chain's largest gamma concentration right where price is sitting. With the dealer gamma estimate in a positive regime for this expiration, hedging flows tend to cushion rather than accelerate — the mechanics favor chop between $61 and $68 with a mild upward pull toward $67 into Friday. Expirations gravitate toward max pain only sometimes and never reliably, so treat this as the shape of the distribution, not a destination.
If RKLB breaks below the put wall ($60.00): That level is the rare case where the September 25 expiration and the whole chain agree — 3,094 contracts at this expiration, 33,592 across all of them — and it sits just above the bottom of the implied range at $59.20. Losing it would take price below every structural support the recent pivots have laid down ($64.51, $61.45, $60.51). The gamma flip estimate near $30 is far enough away that the accelerant scenario isn't mechanically in play here; a break of $60 would simply mean the corridor thesis was wrong.
5 · Three defined-risk structures
Prices are end-of-day midpoints as of 2026-09-18. All structures are hypothetical. Verify live prices before trading — these will be stale by the open.
If you lean bullish: short put spread (this week's best fit)
- Trade: Sell the Sep 25 $62 put / buy the Sep 25 $58 put
- Credit: ~$0.78 · Max profit: $78 · Max loss: $322 · Break-even: $61.22
- Why it fits: You collect premium up front and win if RKLB simply stays above $61.22 for six days. The premium over delivered movement is running in the 88th percentile of this stock's own recent readings, so selling defined-risk premium is being paid better than the headline IV rank of 6.84 suggests. The short $62 strike carries a delta of roughly 0.29, and the $60 put wall — the heaviest put open interest at this expiration — sits a further two dollars below it as a second cushion. Max pain at $67 sits above spot.
- Makes sense only if: you believe the $60–$61 shelf holds through Friday and are willing to be wrong about a bounce.
- Invalidated if: RKLB closes below $60.00.
- Managing it: Close at roughly 50% of max credit; exit regardless by the Wednesday before expiration. Because the short-term trend read is fighting a bearish medium- and long-term trend, take profits earlier than you otherwise would rather than holding for the last few cents. If RKLB closes through $62, close rather than hope.
- Liquidity note: The $62 puts traded 946 contracts on 493 of open interest and quote 17¢ wide; the $58 puts traded 520 contracts and quote 3¢ wide. Work the mid — the $62 leg is the one that will leak edge on a market order.
- Analyze this position →
If you expect the range to hold: iron condor
- Trade: Sell the Sep 25 $61 put / buy the $58 put, and sell the Sep 25 $70 call / buy the $73 call
- Credit: ~$0.835 · Max profit: $83.50 · Max loss: $216.50 · Break-evens: $60.17 and $70.84
- Why it fits: Both short strikes are anchored to real positioning rather than round numbers — $70 is the September 25 call wall, and $61 sits one strike above the $60 put wall. You collect a credit and keep all of it if RKLB finishes anywhere between $61 and $70, which is most of the implied corridor. The dealer gamma estimate for this expiration is in a dampening regime, which is the environment range structures prefer.
- Makes sense only if: you're comfortable with a structure that loses on a decisive move in either direction, and you accept a max loss 2.6× the max profit.
- Invalidated if: RKLB closes below $60.00 or above $70.00.
- Managing it: Take it off at ~50% of max credit; if one side is threatened, close that vertical rather than rolling into more risk. Four-leg condors are worth exiting a day or two before expiration — pin risk around the $65 gamma strike is not worth the last $10.
- Liquidity note: The $70 calls are the most liquid leg on the board for this expiration — 4,158 contracts traded, quoted 1¢ wide. The $73 calls traded 972 contracts at 4¢ wide, the $61 puts 559 contracts at 15¢, and the $58 puts 520 contracts at 3¢. Enter as a package, not leg by leg.
- Analyze this position →
If you lean bearish: short call spread
- Trade: Sell the Sep 25 $68 call / buy the Sep 25 $71 call
- Credit: ~$0.50 · Max profit: $50 · Max loss: $250 · Break-even: $68.50
- Why it fits: This is the structure that honors the chart models, which target $63.00–$63.20 and flag the failed push toward $68 as a rejection. You collect a credit and win if RKLB stays below $68.50 — which includes the entire max-pain-at-$67 scenario as well as any drift lower. The short strike sits above max pain and below the $70 call wall, so both positioning anchors work in the position's favor.
- Makes sense only if: you weight the bearish technical read above the mildly positive options tilt, and accept $250 of risk for $50 of reward.
- Invalidated if: RKLB closes above $70.00.
- Managing it: Close at ~50% of max credit or on any close above $68. This is a counter-tilt trade against the article's own lean — size it smaller than the other two and don't add to it on strength.
- Liquidity note: The $68 calls traded 1,308 contracts on 920 of open interest, quoted 8¢ wide; the $71 calls traded 584 contracts at 7¢ wide. Both fill reasonably at the mid.
- Analyze this position →
If none of these: no trade
The honest case for standing aside this week is the conflict itself. Premium is rich against delivered movement — the 88th-percentile gap is the strongest argument for selling — but IV rank at 6.84 means absolute premium levels are near their one-year floor, so the dollar credits on six-day spreads are small relative to the width you have to risk. Selling a rich-but-cheap premium is a real edge only if you can trade it repeatedly at size; on a single six-day spread, a 4-to-1 risk/reward on a stock that just moved 9.5% in five sessions earlier this month is a thin proposition. Add a directional signal that is genuinely split — our positioning read tilts mildly higher, both chart models point lower, and the trend horizons flatly contradict each other — and the case for waiting for either a test of $60 or a rejection at $70 before committing capital is legitimate. "No trade" is the fourth structure.
6 · Quick FAQ
What is RKLB's expected move this week? ±$5.37, or ±8.31%, into the September 25 expiration — a $59.20 to $69.94 range around Friday's $64.57 close, per the options market's straddle pricing as of September 18.
Is RKLB expected to go up or down over the next six days? Options positioning as of September 18 leans neutral with a mild bullish tilt — max pain sits above spot at $67, short-dated sentiment is positive, and 25-delta calls are pricier than puts — but that is a read of what traders have already done, not a forecast. Both chart models disagree and target roughly $63. The actionable map is the $59.20–$69.94 range and the $60/$70 walls.
Are RKLB options expensive right now? Two answers that point different ways. IV rank of 6.84/100 says option prices are lower than about 93% of the past year's readings. But they are still running roughly 18 vol points above the movement RKLB has actually delivered over the past twenty days — richer than about 88% of this stock's own recent readings. Cheap versus the year, rich versus the last month of price action.
Where is RKLB's biggest options support and resistance? For the September 25 expiration, the put wall is $60.00 (3,094 contracts) and the call wall is $70.00 (4,605 contracts). Across all expirations combined, the heaviest call strike moves up to $80.00, but that is a longer-dated level, not this week's.
What invalidates this week's read? A close below $60.00.
Methodology & disclosures. Data: end-of-day options-chain snapshot for RKLB, 2026-09-18, generated 2026-09-19T22:18:24.531Z. Prices shown are midpoints and will differ from live markets. Momentum/positioning scores and volatility-premium comparisons are descriptive measurements of past option flow and past price movement — not investment advice, signals, forecasts, or guarantees. All trade structures are hypothetical. Every structure shown has a defined maximum loss; you can lose the entire max-loss amount. Options involve substantial risk and are not suitable for all investors.