SMCI Options Are Pricing a $3.73 Move Into Friday — The Chart Model Sees $41
The options market implies a $36.37–$43.83 range for Super Micro into the September 18 expiration, while the 4-day technical model targets $41.00 inside a much tighter band. Here's what the positioning actually shows, where the real levels sit, and three defined-risk ways to trade the gap.

The options market implies a $36.37–$43.83 range into the September 18 expiration; here's what's driving it, where the levels actually sit, and three defined-risk ways to trade it.
Published Sunday, September 13, 2026 · Data as of Friday, September 11 close
Explore the live SMCI options data in the Detailed Options Analyzer →
Quick answer
| Item | Answer |
|---|---|
| Market bias | Neutral with a bullish tilt |
| Options-implied range (into Sep 18) | $36.37 – $43.83 (±9.29%, or ±$3.73) |
| Spot / last close | $40.10 |
| Major support (options) | $25.00 — the Sep 18 put wall; the nearest structural support is $39.47 |
| Major resistance (options) | $36.00 — the Sep 18 call wall, which sits below spot; the whole chain's heaviest call strike is $40.00 |
| Max pain (Sep 18) | $35.00 |
| Dealer gamma regime (estimate) | Positive — hedging tends to dampen moves; flip level ≈ $36.00 (estimate) |
| Volatility condition | Flat near-term, sharply lower over a month — IV rank 24.6/100 · premium rich: options are priced about 7.9 vol points above delivered movement (earnings-inflated) |
| Next earnings | September 25, after close — after the Sep 18 and Sep 25 expirations, before Oct 2 |
| Technical check | Confirms (bullish, 2-day and 4-day models) |
| Best-fitting strategy | Sep 18 $38/$36 short put spread (defined risk, expires before earnings) |
| Analysis invalidated if | SMCI closes below $38.50 |
1 · What matters today
Super Micro closed Friday, September 11 at $40.10 after a 5.9% five-session run that reversed a sharp gap-down two days earlier. Our read of options flow leans mildly bullish — call-side volume is running well ahead of puts, calls are actually priced richer than puts (unusual for this name), and short-dated sentiment has firmed — but the composite lands inside neutral territory, so treat this as a tilt, not a conviction call.
The options market is pricing a move of about ±$3.73 into Friday, September 18 — a $36.37 to $43.83 band, derived from what at-the-money straddles cost. That is a wide envelope for four trading days, and it is the single most useful fact here. Both technical models point higher within a much narrower band. The level that changes the picture: a close below $38.50 takes the bullish tilt off the table.
2 · What the options market is pricing
What changed this week
The underlying did the heavy lifting: SMCI is up 5.89% over the trailing five sessions and just 2.48% over twenty, meaning almost the entire month's gain arrived in the last week. Implied volatility — the market's estimate of how much SMCI will move, baked into option prices — barely budged, finishing at 69.2%, up 0.2% on the day and 1.09% over five sessions, but down 31.3% over thirty. It sits well under its own 30-day average of 80.6% and 90-day average of 86.4%.
Flow was heavy and call-tilted. Total option volume ran 2.05× its 20-day average. Put/call volume — how much put activity there is relative to calls, where above 1 means puts dominate — printed 0.27, against a 7-day average of 0.31 and a 14-day average of 0.32. For every put traded, roughly four calls changed hands. Open interest tells a slightly different story: put/call open interest sits at 0.56 versus a 14-day average of 0.50, having drifted from 0.52 to 0.56 over five sessions. Traders are trading calls while quietly holding more puts than they did two weeks ago.
The biggest fresh positioning among still-live contracts: the September 18 $37 puts added 1,198 contracts of open interest (to 3,978), the September 18 $39.50 calls added 917 (to 1,829), and a brand-new 7,247-contract line appeared at the December 18 $50 calls. Into Friday's now-settled expiration, the $38.50 calls added 1,205 contracts on 6,647 of volume — that was the day's largest single open-interest change, and it is history now.
The short- and long-term trend reads agree on direction — up over the past week, up over the past two months — with the middle horizon flat. A fresh momentum crossover turned positive on September 9, two sessions before the close this article describes.
Expected move
Into September 18, the options market prices roughly ±9.29%, or ±$3.73 around $40.10 — a $36.37 to $43.83 range. That figure is the move the options market is pricing in, derived from what straddles cost, and it is a one-standard-deviation estimate, not a boundary.
| Expiration | Implied move | Range around $40.10 |
|---|---|---|
| Sep 18 (7 DTE) | ±9.29% | $36.37 – $43.83 |
| Sep 25 (14 DTE) | ±13.30% | $34.77 – $45.43 |
| Oct 2 (21 DTE) | ±16.42% | $33.52 – $46.68 |
| Oct 9 (28 DTE) | ±19.14% | $32.43 – $47.77 |
The ladder steps up almost exactly in line with the square root of time — at-the-money IV reads 67.1%, 67.9%, 68.4% and 69.1% across those four rungs. There is no dramatic kink anywhere in the curve.
Volatility
At-the-money IV of 69.2% carries an IV rank of 24.6/100 — where today's IV sits versus the past year, meaning option prices are cheaper than roughly 75% of the past year's readings. The IV percentile agrees at 21. The front-month read is unavailable today because Friday was an expiration day and front-month IV can't be interpolated from a same-day-expiring contract; that figure returns on the next trading day.
Two "vs its own norm" observations, meaning compared against this stock's own recent history rather than the broader market: 20-day realized volatility of 61.3% is unusually depressed for SMCI, sitting well below its recent norm. At the same time, the 5-day-versus-20-day realized-vol ratio at 1.25 is well above its norm — the stock's day-to-day movement has been accelerating inside a month that was, on the whole, unusually quiet by this name's standards.
Premium rich or cheap. The volatility risk premium — the gap between how much movement options are priced for and how much SMCI has actually delivered — sits at about 7.9 vol points positive. When that gap is positive, option sellers have been collecting more than realized movement cost them. Today's reading is richer than about 87% of this stock's own recent readings. But two caveats matter more than the headline. First, the series flipped sign this week, from negative on September 9 to positive on September 10 — that flip is mechanical, not a signal: the August 11 earnings gap rolled out of the 20-day realized-volatility window, and realized vol dropped without anything changing in the options. Second, with the September 25 report twelve days out, some of that richness is the market pre-pricing that report, not free premium. The honest verdict: IV rank of 24.6 says options are not expensive in absolute terms, the premium gap says sellers have recently been paid — and neither is a clean edge this week.
Earnings on the calendar
SMCI reports after the close on September 25. That lands after both the September 18 and September 25 expirations and before October 2 — so every structure below is clean of earnings-gap risk. What is notable is how little the chain is bracing for it: the step from ±13.30% (Sep 25) to ±16.42% (Oct 2) is almost exactly what pure time decay predicts, with no visible earnings hump in at-the-money IV. The last three reports came in above expectations — $1.62 against a $0.56 estimate in August, $0.84 against $0.62 in May, $0.69 against $0.49 in February — after a miss the prior November.
Skew and sentiment
Skew is the observation that puts and calls the same distance from the stock price don't cost the same. Here it runs the unusual way: 25-delta calls are priced at 72.1% implied volatility against 68.4% for 25-delta puts, so calls cost about 3.7 vol points more than puts. Against this name's own 60-day median of −2.1 vol points, today's reading is about 1.6 points flatter still — traders are paying up for upside, not for crash protection, and have been leaning that way for weeks.
Sentiment in short-dated options is split by tenor. The 0–7 day bucket scores a near-flat +4 — the front end has no conviction at all. The 7–30 day bucket reads +43 and the 30–60 day bucket +32, both solidly call-leaning. The summary phrase for that shape is a bullish recovery: positioning is building out on the curve rather than in the immediate expiration. Net new open interest — calls up 35,819 contracts against puts up 8,620 in a single session — is running well above its own norm on the call side.
The key levels map
| Level | Price | Why it matters |
|---|---|---|
| Swing resistance (far) | $51.40 | Heuristic pivot cluster; irrelevant this week but marks the next shelf |
| Call OI cluster (Sep 18) | $45.00 | 16,453 calls open for Friday — heavy, but above the implied range |
| Implied range high (Sep 18) | $43.83 | Top of the ±9.29% band the options market is pricing |
| Swing resistance | $42.31 | Second heuristic pivot above spot |
| Near-money call cluster (Sep 18) | $42.00 | 16,779 calls open — the heaviest strike above spot for Friday |
| Swing resistance | $41.53 | Nearest heuristic pivot overhead; the first real test on a push higher |
| Spot / Friday's close | $40.10 | Where the week ended |
| Whole-chain call wall | $40.00 | 62,821 calls across all expirations — also the single largest gamma strike; a magnet sitting right on spot |
| Swing support | $39.47 | Nearest heuristic support; first level bulls need to hold |
| 20-day moving average | $37.88 | Price sits 5.87% above it |
| Implied range low (Sep 18) | $36.37 | Bottom of the ±9.29% band |
| Call wall (Sep 18) / gamma flip estimate | $36.00 | 28,476 calls — but deep in the money, so it acts as a floor of hedged exposure, not a ceiling. One rough estimate puts the gamma flip here too |
| Max pain (Sep 18) | $35.00 | The price where the most option value would expire worthless — five dollars below spot |
| 50-day moving average | $32.52 | Price sits 23.3% above it |
| Whole-chain put wall | $30.00 | 35,725 puts across all expirations |
| Put wall (Sep 18) | $25.00 | 21,058 puts — a tail-hedge cluster, far outside the implied range |
Read that ladder carefully, because the Friday-specific walls do not behave the way the labels suggest. The September 18 expiration's own heaviest call strike is $36.00 — eleven percent below spot — and its heaviest put strike is $25.00, thirty-eight percent below. Neither functions as this week's ceiling or floor. The levels that actually matter for the next four days are the whole chain's $40.00 call magnet sitting directly on spot, the $42.00 near-money call cluster above it, and $39.47 beneath.
Positioning and unusual flow
The dealer gamma estimate reads positive across the chain and positive for the September 18 expiration specifically — market makers hedge the options they've sold, and in this estimated regime their hedging tends to dampen moves rather than amplify them. That is an estimate built on an assumed dealer sign convention, not observed inventory, and the flip level it implies (≈$36.00) sits about 10% below spot.
Three flow items stood out among live contracts. The September 18 $41.50 calls traded 22,759 contracts against just 2,275 of open interest — ten times turnover, and $2.1 million of premium, on a strike 3.5% above spot. The September 18 $39 calls moved $5.0 million of premium on 24,348 contracts, the single largest premium line in the chain. Against that, the October 9 $32 puts traded 2,640 contracts on 79 of open interest — a 33× turnover in a strike 20% below spot, which is what somebody buying cheap disaster insurance looks like.
3 · Technical check
Both technical reads point the same direction. The near-term model, targeting Tuesday, September 16, is bullish with a $40.65 target inside a $39.30–$41.20 band, citing RSI at 65.5, an ADX of 25.0 with positive directional movement dominant, and money flow in accumulation territory. The 4-day model, targeting Friday, September 18, is also bullish with a $41.00 target and a $38.60–$42.20 band, though it flags a mild non-confirmation: money flow sits slightly negative at −0.029 despite the price bounce, meaning buying pressure hasn't fully caught up to the rally.
Both confirm the options bias in direction, and both targets sit comfortably inside the options-implied range. The interesting gap is width, not direction: the chart model sees a $3.60 band into Friday; the options market is pricing a $7.46 band. Options are charging for roughly twice the movement the technical work expects.
Model vs. Market: The options market implies $36.37–$43.83 into September 18; the 4-day technical model targets $41.00 inside $38.60–$42.20. If the chart model is right about magnitude, defined-risk structures with short strikes outside the technical band but inside the options band are the structural expression of that gap.
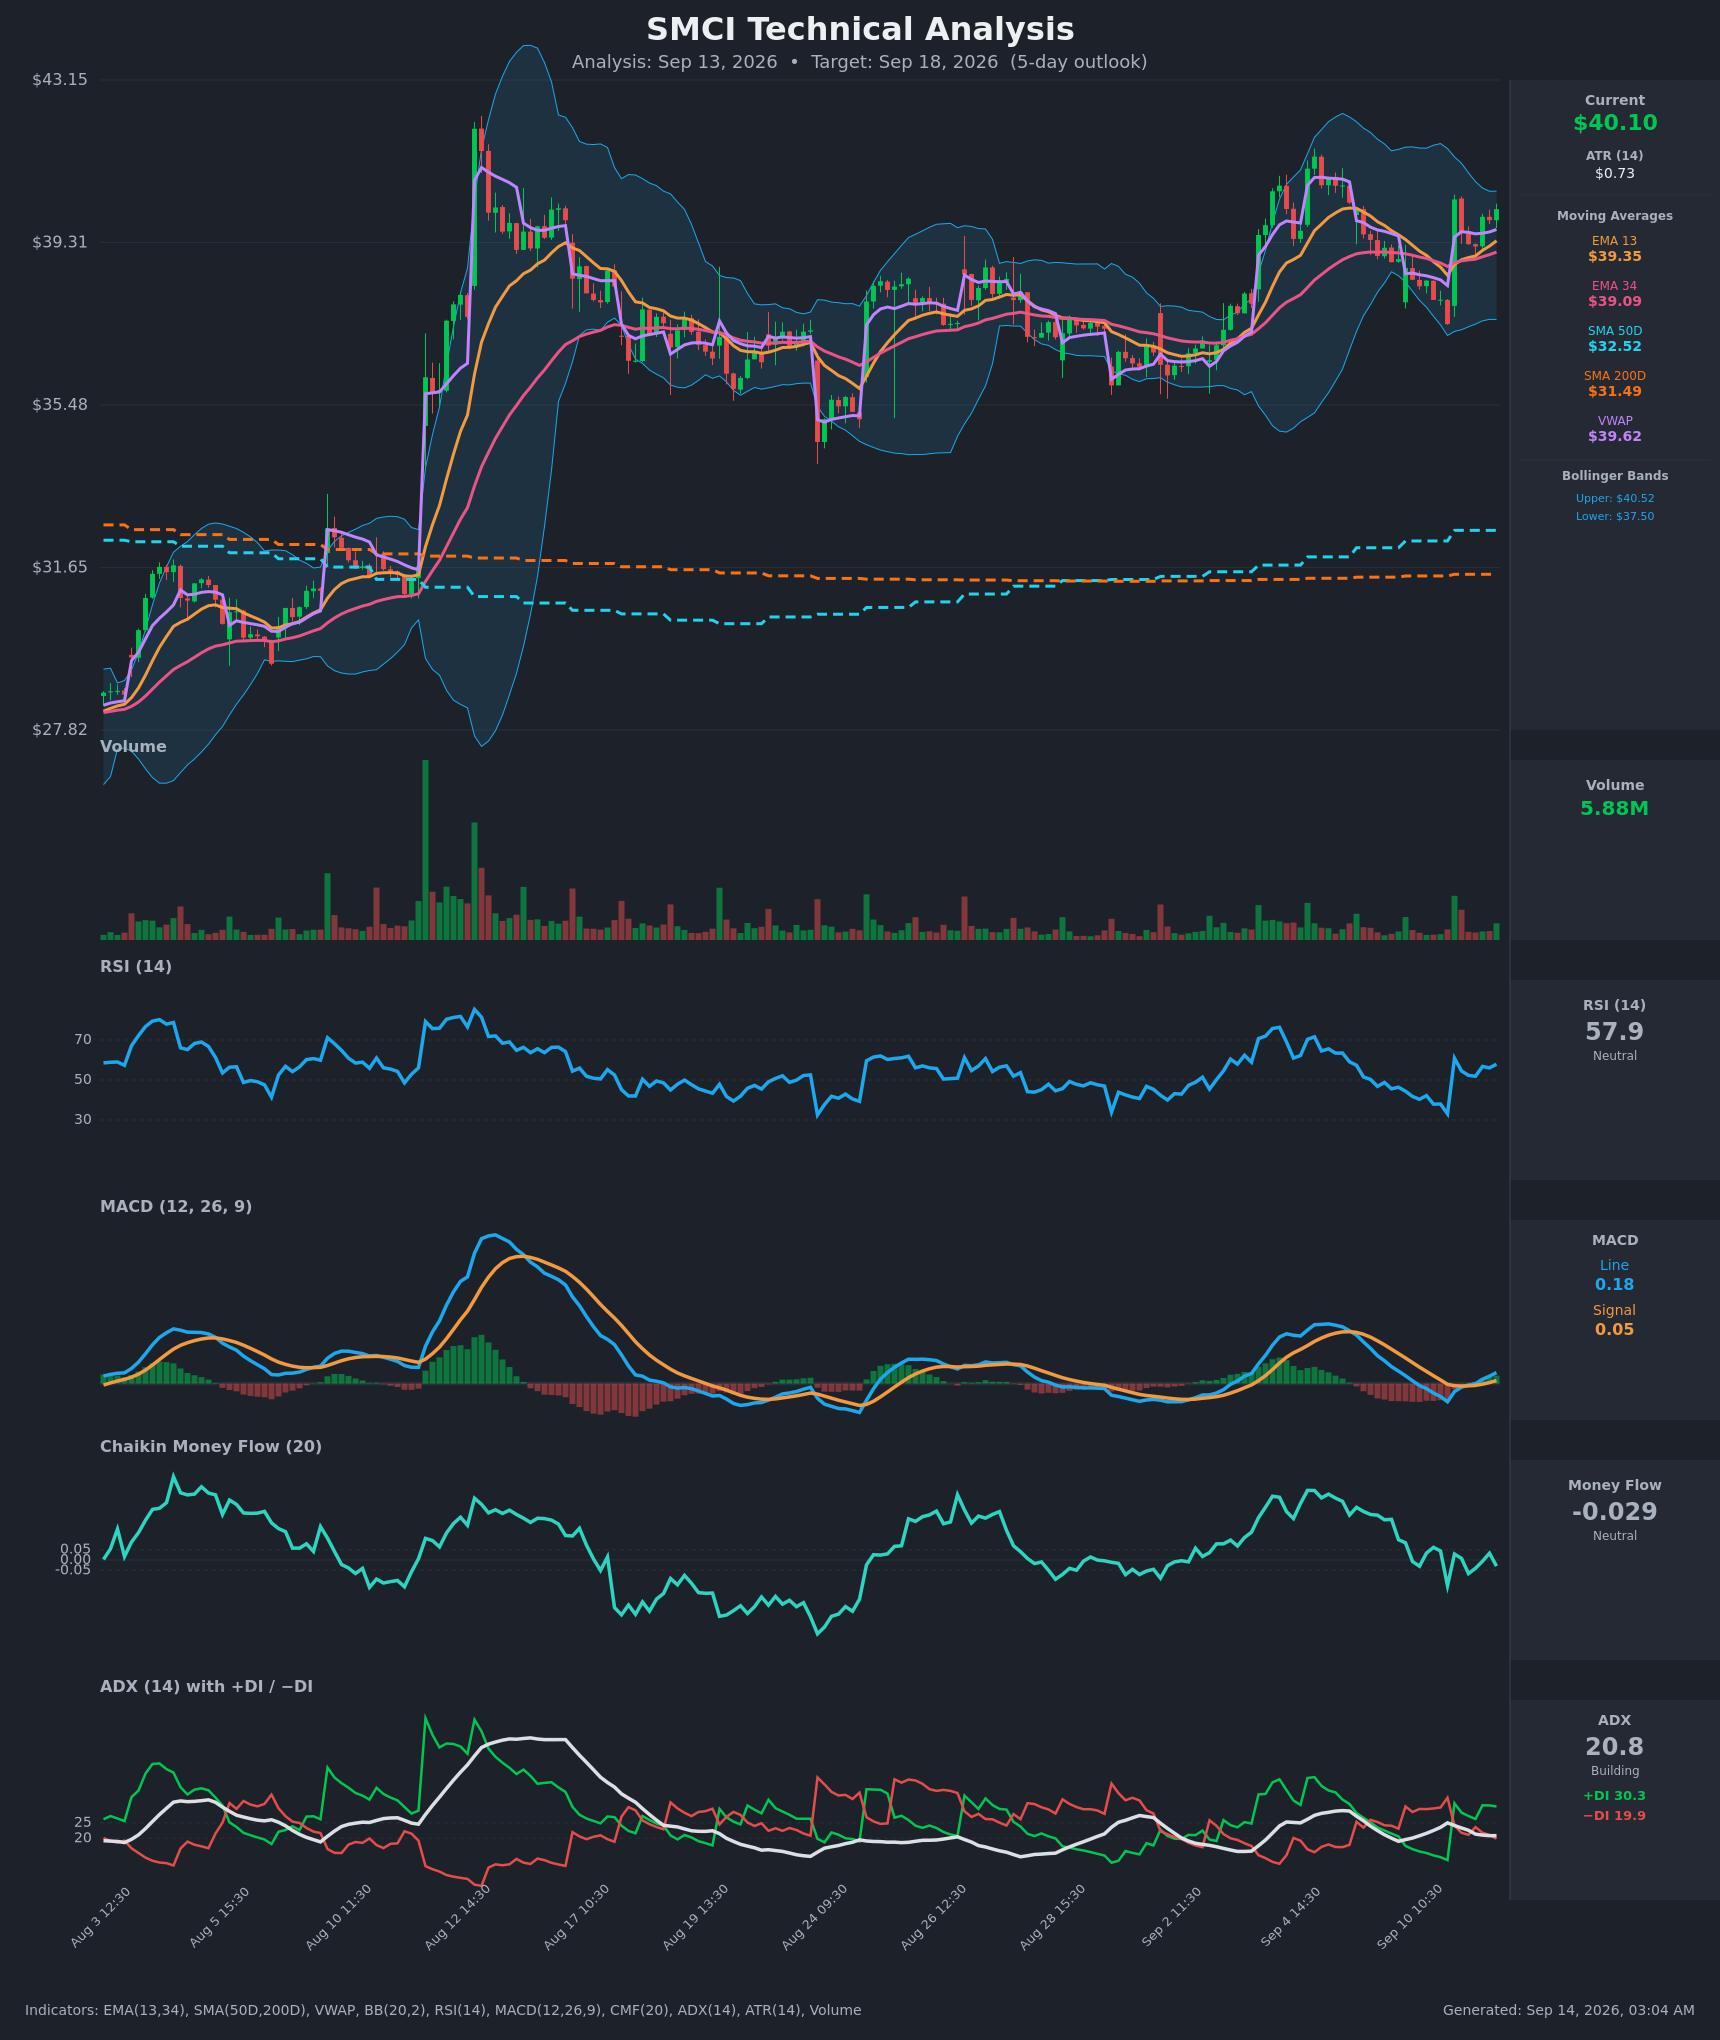
The technical work did adjust strike selection below: short strikes are shaded to sit outside the $38.60–$42.20 technical band, and the bearish structure's short call is placed at $42 rather than closer to spot.
Full technical write-ups: near-term report → · 4-day report →
4 · Three ways the next four days can go
If SMCI pushes through the near-money call cluster ($42.00): the 16,779 contracts of call open interest at that strike are the heaviest concentration above spot for Friday, and heavy call open interest overhead tends to slow rallies as it is hedged. Above it, positioning thins until $43.83 — the top of the implied range — and then $45.00. The swing pivots at $41.53 and $42.31 sit right in that zone, so the first push higher has real work to do.
If SMCI drifts between $39.47 and $42.00: this is the base case the positioning supports. The whole chain's heaviest call strike and largest gamma concentration both sit at $40.00, right on top of spot, and in a positive-gamma regime that kind of clustering tends to pull price toward it into expiration. Worth naming honestly: max pain for Friday sits at $35.00, five dollars below spot — expirations sometimes gravitate toward max pain, but when it is that far away and the positioning magnet sits at $40.00, the max-pain pull is not a meaningful force here.
If SMCI breaks below $39.47: the September 18 put wall at $25.00 is a tail-hedge cluster, not a live support level, so there is no options-based floor nearby. Structure takes over: the 20-day moving average at $37.88 and then the implied-range floor at $36.37, which coincides with the gamma flip estimate at $36.00 — below that level one rough estimate suggests market-maker hedging would begin amplifying selling rather than cushioning it. Spot currently sits about 10% above that estimate, which is about typical distance for this name.
5 · Three defined-risk structures
Prices are end-of-day midpoints as of 2026-09-11. All structures are hypothetical. Verify live prices before trading — these will be stale by the open.
If you lean bullish: Sep 18 $38/$36 short put spread
- Trade: Sell the September 18 $38 put, buy the September 18 $36 put. A credit spread: you collect premium up front and keep it if the stock stays above your short strike.
- Credit: $0.42 · Max profit: $42 per spread · Max loss: $158 · Break-even: $37.58
- Why it fits: the short strike sits below the 4-day technical model's $38.60 range floor and inside the options-implied band, and the break-even at $37.58 is beneath the 20-day moving average at $37.88. Call-side flow, call-rich skew, and the positive-gamma estimate all argue against a fast break lower.
- Makes sense only if: you accept a roughly 4-to-1 risk/reward for a high-probability structure and are comfortable that IV rank of 24.6 means you are not being richly paid in absolute terms.
- Invalidated if: SMCI closes below $38.50.
- Earnings exposure: expires seven days before the September 25 report — no earnings-gap risk.
- Managing it: close at roughly 50% of max credit; with only four trading days of life, don't hold a losing position into Thursday hoping for a reversal. If SMCI closes through $38, close rather than hope — and given the short-term move is running ahead of a flat 20-day trend, take profit early rather than squeezing the last dime.
- Liquidity note: the $38 puts traded 4¢ wide on 4,283 contracts and $274,000 of premium; the $36 puts are 3¢ wide. Fills should be straightforward.
- Analyze this position →
If you expect the range to hold: Sep 18 $34/$36/$44/$46 iron condor
- Trade: Sell the $36 put and buy the $34 put; sell the $44 call and buy the $46 call, all September 18. Four legs, one net credit, profitable if SMCI finishes between the short strikes.
- Credit: $0.33 · Max profit: $33 · Max loss: $167 · Break-evens: $35.67 and $44.33
- Why it fits: both break-evens sit outside the options-implied $36.37–$43.83 range, which is exactly the Model-vs-Market gap expressed as a structure — you get paid if the stock behaves the way the technical band suggests rather than the way the straddle is priced.
- Makes sense only if: you genuinely believe the priced move is too wide. Note the health warning: the premium gap is rich by this stock's recent standards, but part of that richness is the September 25 report being pre-priced, so don't treat it as free money.
- Invalidated if: SMCI closes above $43.83 or below $36.37 — a touch of either implied-range rail means the market is delivering the move it priced.
- Earnings exposure: expires seven days before the September 25 report — no earnings-gap risk.
- Managing it: close at ~50% of max credit; exit both sides together rather than legging out. With four days to expiration, gamma risk dominates theta — this is a hold-to-Wednesday, decide-on-Thursday trade, not a set-and-forget.
- Liquidity note: the $44 calls are 2¢ wide on 2,503 contracts, the $46 calls 3¢ wide, the $34 puts 2¢ wide on thin volume of 197. The lower put leg is the one most likely to leak edge on entry.
- Analyze this position →
If you lean bearish: Sep 18 $42/$44 short call spread
- Trade: Sell the September 18 $42 call, buy the September 18 $44 call. You collect premium and keep it if SMCI stays below $42.
- Credit: $0.41 · Max profit: $41 · Max loss: $159 · Break-even: $42.41
- Why it fits: $42.00 is the heaviest near-money call open interest for Friday (16,779 contracts) and sits just above the swing pivots at $41.53 and $42.31 — three overhead obstacles stacked in a dollar. The break-even at $42.41 also sits above the 4-day technical model's $42.20 range ceiling.
- Makes sense only if: you think last week's 5.9% run has overshot, and you accept that you are fighting both technical models and the call-tilted flow.
- Invalidated if: SMCI closes above $42.31.
- Earnings exposure: expires seven days before the September 25 report — no earnings-gap risk.
- Managing it: close at ~50% of max credit; exit regardless by Thursday's close. If SMCI trades and holds above $41.53, close rather than wait for $42 — this is the structure most exposed to a continuation of the existing move.
- Liquidity note: the $42 calls traded 4¢ wide on 10,941 contracts and $864,000 of premium; the $44 calls are 2¢ wide. Both fill easily.
- Analyze this position →
If none of these: no trade
There is a real case for standing aside. The premium gap looks rich — about 7.9 vol points above delivered movement, richer than 87% of this stock's own recent readings — but with earnings twelve days out, that richness is partly the market pre-pricing a scheduled event rather than genuine overpayment, and IV rank of 24.6 says option prices are still cheap relative to the past year in absolute terms. Selling premium here means collecting a below-average absolute price for a stock that can move 9% in four days. Add that every credit structure above risks roughly four dollars to make one, over a four-day window in which a single gap can settle the question, and waiting for the September 25 report to actually inflate the front of the curve is a defensible choice.
6 · Quick FAQ
What is SMCI's expected move this week? About ±$3.73, or ±9.29%, into the September 18 expiration — a $36.37 to $43.83 range around Friday's $40.10 close, per straddle pricing as of September 11.
Is SMCI expected to go up or down over the next four days? Options positioning as of September 11 leans mildly bullish — call-heavy volume, calls priced richer than puts, and firming sentiment in the 7–30 day tenors — but that is a read of what traders have done, not a forecast. The actionable map is the $36.37–$43.83 range and the $39.47 / $42.00 levels.
Are SMCI options expensive right now? Two lenses, two answers. IV rank of 24.6/100 says option prices are lower than about 75% of the past year's readings. On top of that, they are running roughly 7.9 vol points above the movement SMCI has actually delivered — richer than about 87% of this stock's own recent readings. Cheap by the year, rich by the month; and some of that richness is the September 25 report being pre-priced, so neither reading is a clean edge.
When is SMCI's next earnings report? September 25, after the close — after both the September 18 and September 25 expirations, and before October 2. Notably, the chain is showing almost no volatility hump for it.
Where is SMCI's biggest options support and resistance? For the September 18 expiration specifically, the put wall sits at $25.00 and the call wall at $36.00 — both far from spot, which is why the practical levels this week are the whole chain's $40.00 call magnet, the $42.00 near-money call cluster above it, and the $39.47 swing support below.
What invalidates this read? A close below $38.50.
Methodology & disclosures. Data: end-of-day options-chain snapshot for SMCI, 2026-09-11, generated 2026-09-14T03:04:48.730Z. Prices shown are midpoints and will differ from live markets. Momentum/positioning scores and volatility-premium comparisons are descriptive measurements of past option flow and past price movement — not investment advice, signals, forecasts, or guarantees. Earnings dates and reported results are from the data provider's earnings feed as of 2026-09-14T03:04:48.730Z; report dates can change. All trade structures are hypothetical. Every structure shown has a defined maximum loss; you can lose the entire max-loss amount. Options involve substantial risk and are not suitable for all investors.