SMCI Options Are Pricing a $3.58 Move Into September 25 — The Chart Model Sees Less Than Half That
The options market implies a $35.51–$42.67 range for Super Micro through the September 25 expiration, while both technical models target roughly $39.85. Here's what the positioning data shows, the levels that matter, and three defined-risk ways to trade the gap.
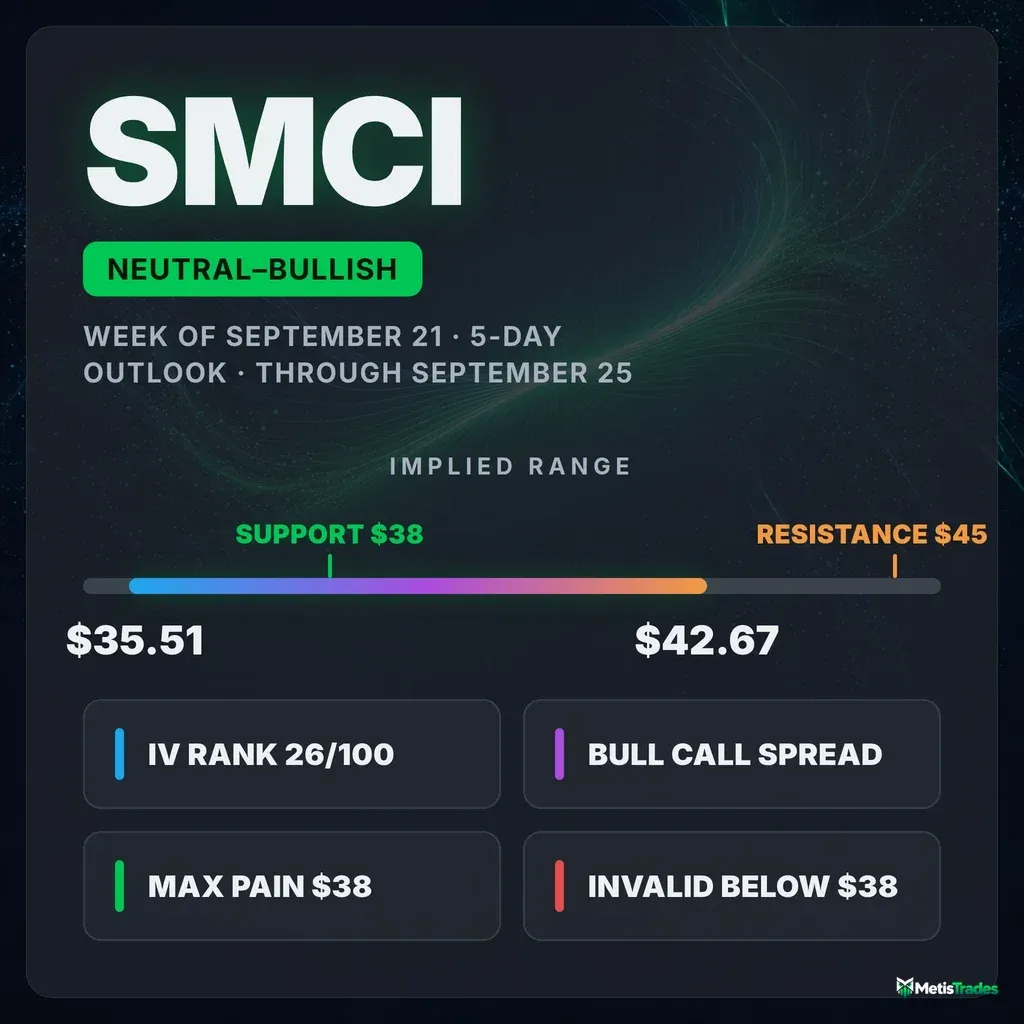
The options market implies a $35.51–$42.67 range into the September 25 expiration; here's what's driving it and three defined-risk ways to trade it.
Published Sunday, September 20, 2026 · Data as of Friday, September 18 close
Explore the live SMCI options data in the Detailed Options Analyzer →
Quick answer
| Item | Answer |
|---|---|
| Market bias | Neutral with a bullish tilt |
| Last close (Friday, September 18) | $39.09 |
| Options-implied range (into September 25) | $35.51 – $42.67 (±9.17%, or about ±$3.58) |
| Major support | $40.00 put wall for September 25 — but it sits above the close, so the working shelf below price is $38.00 |
| Major resistance | $45.00 (call wall for September 25) |
| Max pain (September 25) | $38.00 |
| Dealer gamma regime (estimate) | Positive — hedging tends to dampen moves; flip level ≈ $41.00 (estimate) |
| Volatility condition | Falling — IV rank 26/100 · premium thin: options priced roughly 8 vol points below delivered movement (the earnings window distorts this read) |
| Next earnings | September 25, after close — after the September 25 expiration settles, before October 2 |
| Technical check | Confirms (bullish at both the 3-day and 5-day horizons; targets $39.90 and $39.85) |
| Best-fitting strategy | September 25 $39.50/$41.00 bull call spread |
| Analysis invalidated if | SMCI closes below $38.00 |
1 · What matters today
SMCI closed Friday, September 18 at $39.09, down 2.5% over five sessions but still up 7.1% over twenty. Our read of the options flow lands just on the bullish side of neutral: the leading positioning signals and a call-tilted volatility surface pull up, while short-term price momentum and front-week sentiment pull down. The options market is pricing a move of about ±$3.58 — that's ±9.17%, derived from what straddles cost — into the September 25 expiration, which frames a $35.51–$42.67 range. Max pain, the price where the most option value would expire worthless, sits at $38.00. Both technical models point mildly higher, to roughly $39.85, well inside that range. The level that changes everything: a close below $38.00 breaks the constructive structure and the read goes with it.
2 · What the options market is pricing
What changed this week
The last five sessions were violent in both directions — a 8.4% drop, then a 9.5% bounce, then a 3.1% fade — and the chain's own measures show traders reacting rather than leading. Put open interest relative to calls went from 0.56 to 0.64 over five days: for every call contract held open there are now 0.64 puts, against a 14-day average of 0.56. Downside protection got added at a steady clip. Friday's volume told a different story: put volume was only 0.27 times call volume, versus a 7-day average of 0.42 and a 60-day median of 0.34 — an unusually call-heavy session for this name, on total option volume 1.75× its 20-day average. At-the-money implied volatility (the market's estimate of how much SMCI will move, baked into option prices) slipped to 68.6%, down 2.4% on the day, down 0.8% on the week, and down 31.5% over thirty sessions; it now sits below both its 30-day average (74.6%) and its 90-day average (85.1%).
Forward-looking open-interest builds skewed to calls far out the curve — the November 20 $37 calls added 8,803 contracts and the November 20 $40 calls added 7,885 — while the nearest new put build was the October 2 $38 puts, up 3,360 contracts to 3,996. As settled history: into the September 18 expiration, the $36 calls shed 13,370 contracts of open interest as they ran out of time.
The short- and long-term trend reads are openly at odds. Over the past week the trend read is bearish (price −2.5%); over the past month it's bullish (+7.1%); over the past two-plus months it's strongly bullish (+38.4%). A fast-versus-slow momentum crossover turned down on September 14. Near-term flow and the bigger trend are pointing different ways, which is exactly the setup that rewards short-dated structures and punishes conviction held too long.
Expected move
Into September 25, straddle pricing implies about ±$3.58 on a $39.09 share price — ±9.17%, or a $35.51–$42.67 range. Here is the ladder:
| Expiration | Implied move | Range around $39.09 |
|---|---|---|
| September 25 (7 days) | ±9.17% | $35.51 – $42.67 |
| October 2 (14 days) | ±13.15% | $33.95 – $44.23 |
| October 16 (28 days) | ±18.93% | $31.69 – $46.49 |
The rungs widen roughly with the square root of time rather than stepping up sharply, which tells you the chain is not bracing hard for any single dated event inside the next month — a point the earnings paragraph below returns to. (The September 18 expiration has already settled and is excluded throughout.)
Volatility
IV rank is 26/100 — today's implied volatility is cheaper than about 74% of the past year's readings, and slightly below its own 7-day average of 27. The front-month read is unavailable today (the nearest expiration in this snapshot was an expiry-day contract), so there's no clean term-structure comparison — comparing option prices across expiration dates will have to wait for the next session. Against this stock's own recent history, realized movement has actually been running below its norm for SMCI over the past twenty sessions, but the 5-day-versus-20-day realized-volatility ratio is 1.42 and well above its norm: movement is accelerating inside the month even as the month-long level cools.
Premium rich or cheap. The volatility risk premium — the gap between how much movement options are priced for and how much SMCI has actually delivered — is negative about 8 vol points: ATM implied volatility near 68.6% against 20-day realized volatility of 76.5%. When that gap is positive, option sellers collect more than realized movement costs them; here it is the buyers who are paying less than the stock has been delivering. The percentile is 69/100, meaning today's gap is still richer than about 69% of this stock's own readings over the past three months — it has usually been even more negative. The path matters: the gap flipped positive in mid-September, then swung back negative over the past two sessions as two daily moves of 8%-plus entered the realized-volatility window. That combination — IV rank 26 and a negative premium versus delivered movement — favors owning premium over selling it this week. One caveat, and it's not optional: with a scheduled earnings report five days out, the priced-versus-delivered comparison is mechanically distorted, so treat "cheap" as context, not as an edge.
Earnings on the calendar
Super Micro reports on September 25, after the close. That lands after the September 25 options settle and before the October 2 expiration — so every structure built on this week's expiration carries no earnings-gap risk, while October 2 owns all of it. What's notable is how little the chain is paying for that: the per-expiration at-the-money implied volatility rises only from 66.2% at the September 25 rung to 67.1% at October 2, about a single vol point, and the expected move steps from ±9.17% to ±13.15% largely on time alone. The last three reports came in above expectations (most recently $1.62 per share against an expected $0.56); the one before that fell short by four cents.
Skew and sentiment
Skew — the fact that puts and calls the same distance from the stock price don't cost the same — is running the unusual way here. The 25-delta put trades at 68.1% implied volatility against 71.6% for the 25-delta call: calls are about 3.5 vol points richer than the equivalent puts, versus a 60-day median gap of roughly 2.0 points. Traders are paying up for upside participation, not crash protection, and they're doing it a little more insistently than this name's own recent norm — though the five-session drift in that gap has been toward steeper put demand, so the call bid is fading at the margin.
Sentiment across expirations splits by term: the 0–7 day bucket reads −19 (puts built on Friday in the nearest expirations), the 7–30 day bucket +19, and the 60–120 day bucket +62, where call open interest grew by 18,946 contracts against 1,485 for puts. The one-phrase summary the data gives itself is "bullish recovery" — positioning building further out the curve while the front week hedges. Peer-relative flow was also unusually call-skewed for this name: 12 call contracts cleared the unusual-volume bar versus 7 puts, a reading well above its own norm.
The key levels map
| Level | Price | Why it matters |
|---|---|---|
| Call wall (September 25) | $45.00 | Heaviest call open interest at this expiration (5,189 contracts) — the ceiling the week's positioning defends |
| Top of implied range | $42.67 | Upper 1σ rail for September 25 |
| Swing resistance | $41.53 | Price-structure pivot from recent swing clustering |
| Gamma flip (estimate) | ≈ $41.00 | One rough estimate puts the hedging pivot here, just above the close |
| Technical resistance | $40.69 | September 17 swing high named by the 5-day chart model |
| Put wall (September 25) / whole-chain call magnet | $40.00 | Heaviest put OI for September 25 (1,978) sits above spot; across all expirations combined, $40 is also the single heaviest call strike (88,303) and the largest gamma strike — the two reads disagree on what $40 is, and that makes it the week's pivot rather than support |
| Swing resistance | $39.47 | Nearest overhead price-structure level |
| Last close | $39.09 | Friday, September 18 |
| Technical support | $38.45 | Recent swing low and the 5-day model's invalidation |
| Max pain (September 25) | $38.00 | Where the most option value would expire worthless; expirations sometimes gravitate toward it |
| 20-day moving average | $37.88 | Close sits 3.2% above it |
| Swing support | $36.80 | Prior consolidation shelf |
| Bottom of implied range | $35.51 | Lower 1σ rail for September 25 |
| Whole-chain put wall | $30.00 | Heaviest put OI across all expirations (50,507) — a far-field floor, not a weekly level |
For scale: the 50-day average is $33.56 and the 200-day is $31.60, both far below price, and the stock sits 33.5% under its 52-week high of $58.78 while 100.7% above the $19.48 low.
Positioning and unusual flow
The dealer-gamma read is an estimate, and it reads positive both across the chain and for the September 25 expiration specifically — in that regime, market-maker hedging tends to dampen moves rather than amplify them. The same estimate puts the flip pivot near $41.00, which means spot closed just below it, about 4.9% under, an unusually close distance for this name; treat that as a fragility marker, not a forecast.
Three flow items stand out. First, the September 25 $39.50 calls traded 38,315 contracts against just 395 held open — 97× turnover and $4.67 million of premium, the largest single line in the entire chain. That is same-week, near-the-money call buying at scale. Second, the September 25 $42 calls traded 37,009 contracts (about 8.8× their open interest, $1.74 million of premium), adding 1,031 contracts of open interest — money reaching for the upper half of the implied range. Third, the October 2 $38 puts traded 4,030 contracts and grew open interest from 636 to 3,996: someone is buying downside protection specifically across the earnings date. Also worth a mention: the October 23 $46 calls printed 1,008 contracts against 247 open, at the 100th percentile versus peer contracts.
3 · Technical check (the 20%)
Both chart models are bullish and both are modest about it. The 3-day read (target date September 23) projects $39.90 with a range of $37.80–$41.00; the 5-day read (target date September 25) projects $39.85 with a range of $37.75–$40.95. Both anchor off the same $39.09 reference price the options snapshot uses, so there's no data-date mismatch. Direction matches our tilt and both targets sit comfortably inside the options-implied $35.51–$42.67 band, so this is a confirm, not a divergence.
The two most decisive indicator reads support the "modest" part. ADX at 16.4 has fallen from roughly 26 during the September 17 rally, which says the trend has lost strength and the tape is range-bound; and money-flow sits right at the accumulation threshold (0.050) after the bounce off $38.45 — buyers stepping back in, but without conviction. The 5-day model's dominant scenario is a bull-flag continuation toward $40.69–$41.30, invalidated on a close below $38.45.
Model vs. Market: The options market implies $35.51–$42.67 into September 25; the 5-day technical model targets $39.85 inside a $37.75–$40.95 band. The chart model is pricing roughly a third of the width the options market is. If realized movement comes in closer to the chart model's band, option buyers overpaid; if the earnings run-up cracks the $38 shelf, the options market will look correctly priced.
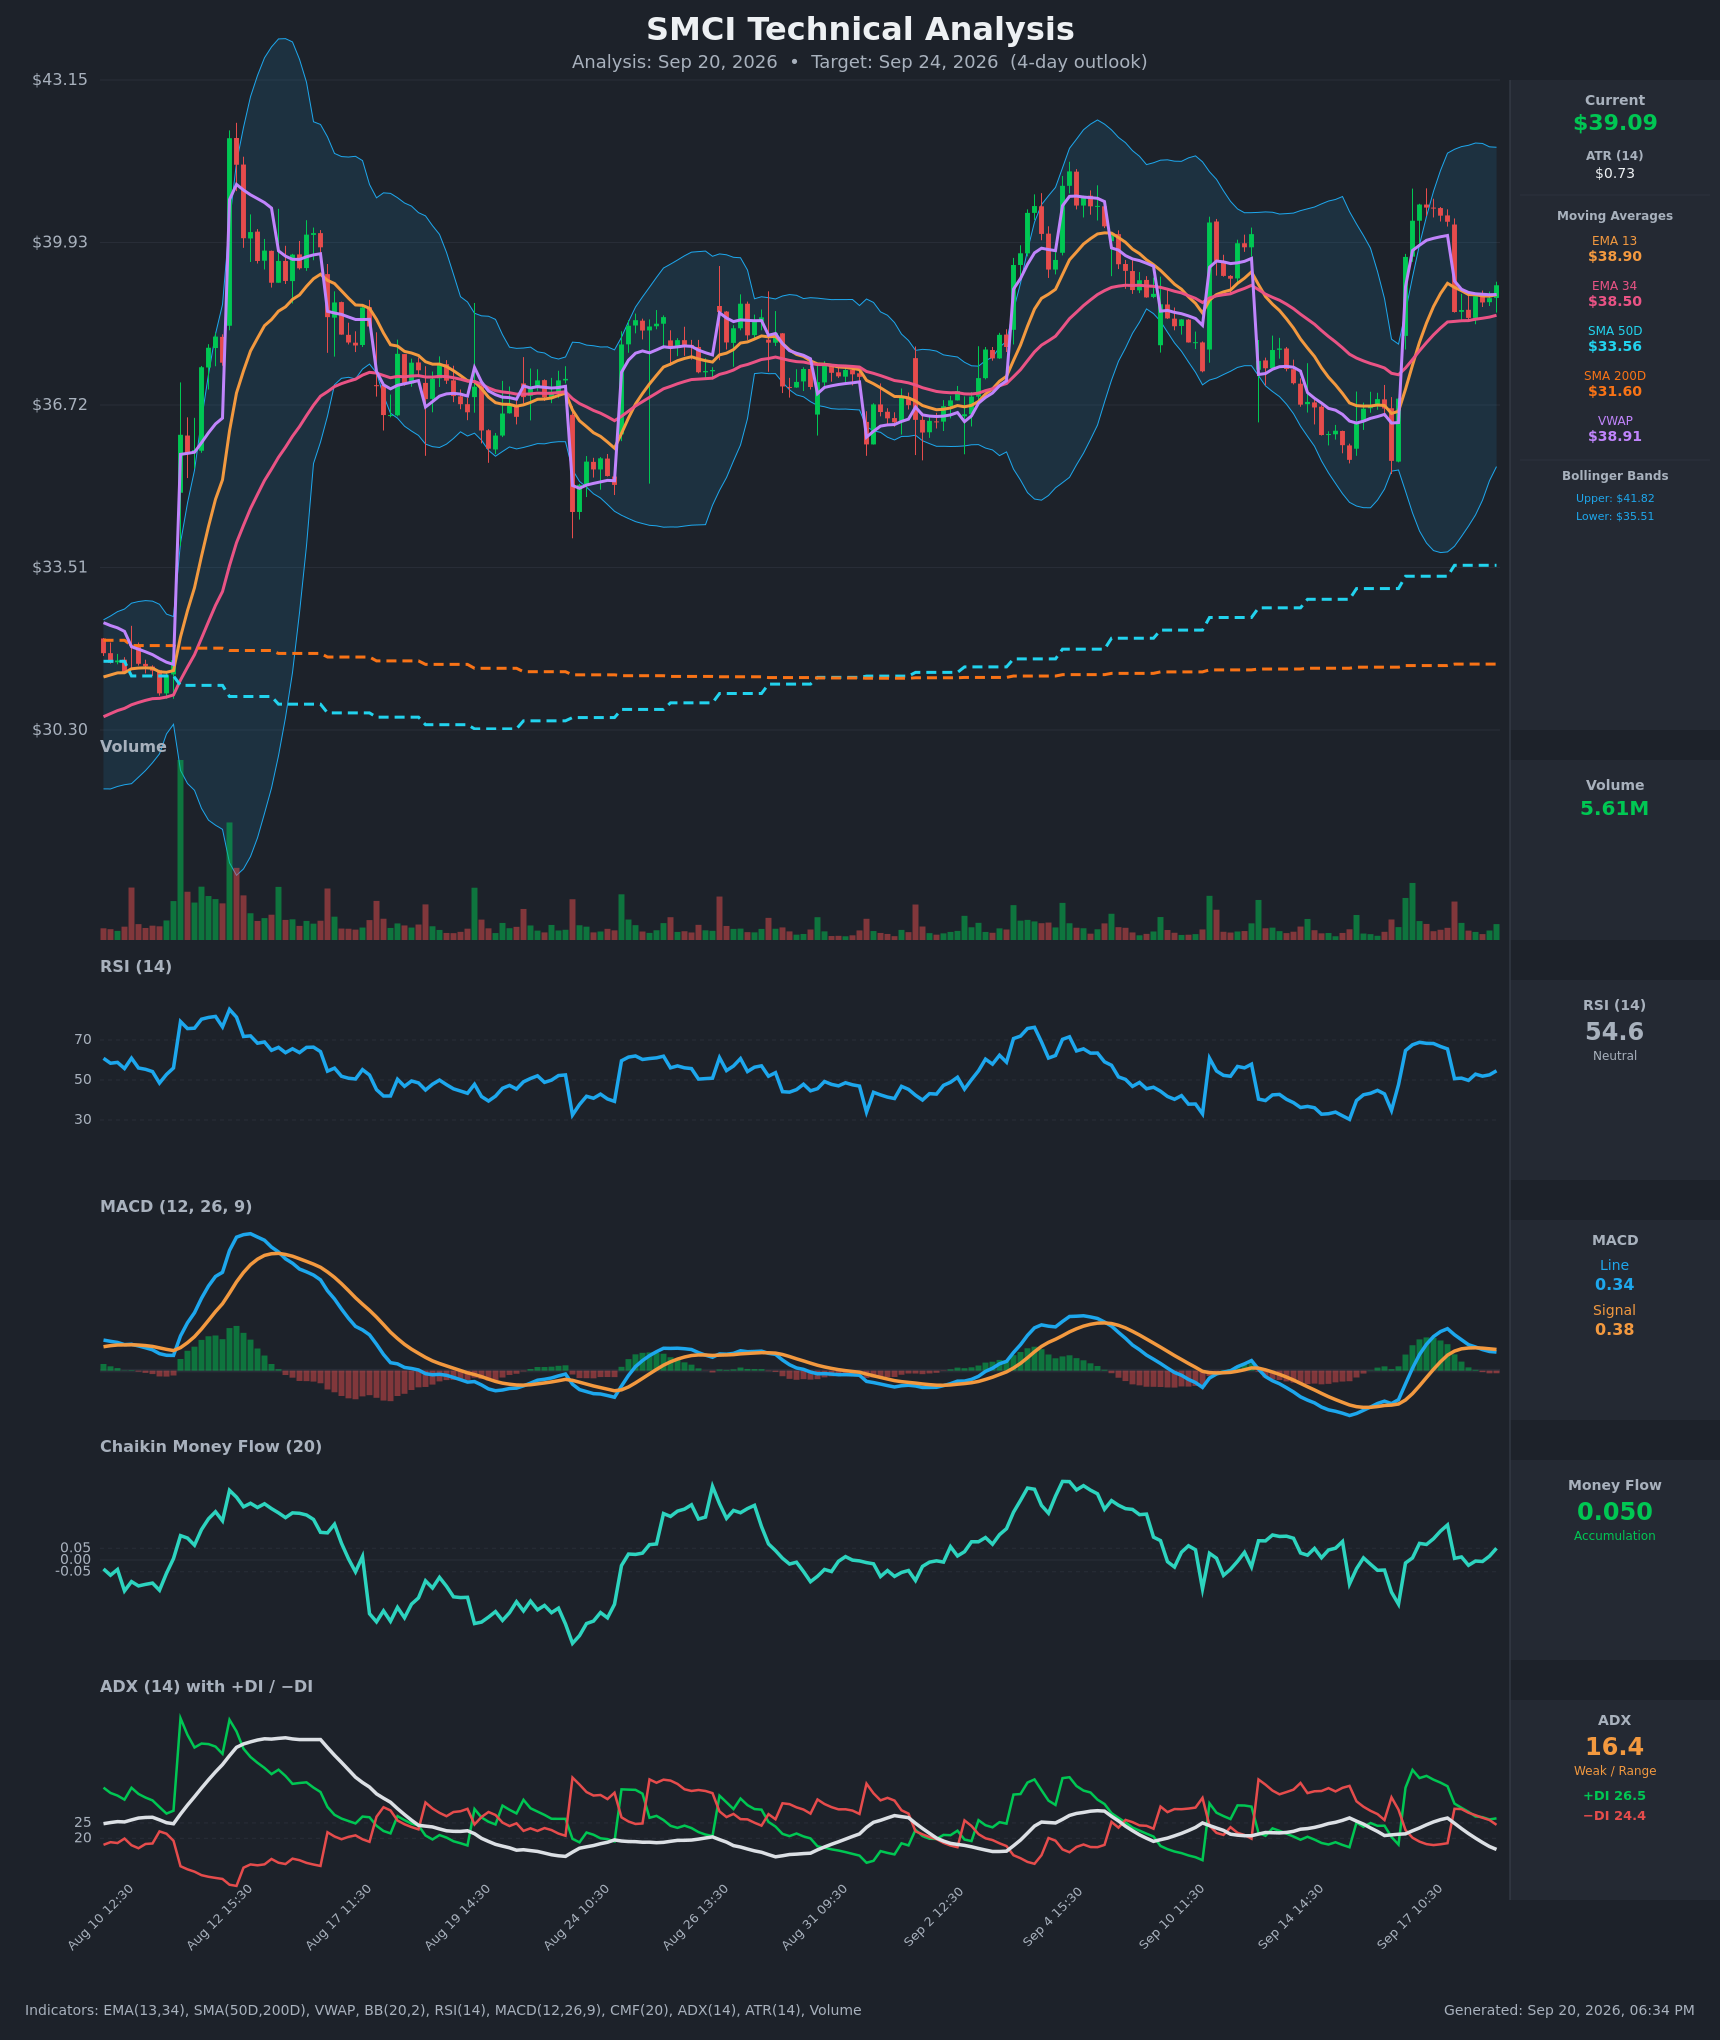
Practical effect on strikes below: the technical resistance cluster at $40.69–$41.00 is why the bullish structure's short strike sits at $41 rather than reaching for $42, and the $38.45 technical support is why the bearish structure's long strike sits at $38.
Full technical write-ups: 3-day report → · 5-day report →
4 · Three ways the next five days can go
If SMCI pushes above $41.00 and presses toward the call wall ($45.00): the heaviest call open interest for this expiration sits at $45, and there is comparatively little positioning between $41.50 and $45 to slow a move — but $45 is also where 5,189 contracts of call OI would need to be defended. Positioning like that tends to act as a magnet first and a brake second, and $41 is where one rough estimate places the hedging pivot, so a clean reclaim of it changes the character of the tape.
If SMCI drifts between $38.00 and $41.00: this is the pin case, and it's the one the data most supports. Max pain for September 25 is $38.00, the 20-day average is $37.88, and the estimated gamma regime for this expiration is positive — hedging that dampens rather than amplifies. Expiring open interest clustered at $39, $39.50, $40 and $42 gives the week plenty of reason to grind sideways into settlement while the report waits on the other side of the bell.
If SMCI breaks below $38.00: that takes out max pain, the 20-day average and the technical shelf in one move, with the next real price-structure support at $36.80 and the lower implied rail at $35.51. Spot is already sitting unusually close beneath the estimated flip level for this name, and the whole-chain put wall is all the way down at $30 — meaning there is no heavy put positioning between here and the mid-$30s to cushion a slide at this expiration.
5 · Three defined-risk structures
Prices are end-of-day midpoints as of 2026-09-18. All structures are hypothetical. Verify live prices before trading — these will be stale by the open.
If you lean bullish: September 25 $39.50/$41.00 bull call spread
- Trade: Buy the September 25 $39.50 call, sell the September 25 $41.00 call
- Debit: $0.52 ($1.22 paid − $0.70 collected) · Max profit: $98 per spread · Max loss: $52 per spread · Break-even: $40.02
- Why it fits: you are buying premium that is priced about 8 vol points below what SMCI has actually delivered, with IV rank at 26/100 — the cheaper side of the market. The short strike sits at $41.00, the estimated gamma pivot and just under the $40.69 technical resistance, which is where the week's upside most plausibly stalls. Because the near-term trend read fights the two-month uptrend, this is deliberately a seven-day structure, not a monthly one.
- Makes sense only if: you want the bullish tilt expressed with a fixed cost and no earnings exposure.
- Invalidated if: SMCI closes below $38.00.
- Earnings exposure: expires the same day the report is released, but the report lands after the close — so the position settles before any earnings gap. No earnings-gap risk.
- Managing it: take profits into any tag of $40.70–$41.00 rather than holding for the full $98; with the short-term trend read pointing the other way, this is a spread to harvest early. Exit the whole thing if price closes below $38.00.
- Liquidity note: the $39.50 calls traded 2¢ wide on 38,315 contracts (1.6% of mark — the most liquid line in the chain) and the $41.00 calls 2¢ wide. Fills are easy.
- Analyze this position →
If you expect the range to hold: September 25 $35/$37/$42/$44 iron condor
- Trade: Sell the $37.00 put / buy the $35.00 put, and sell the $42.00 call / buy the $44.00 call, all September 25
- Credit: $0.625 ($0.365 on the put side, $0.26 on the call side) · Max profit: $62.50 · Max loss: $137.50 · Break-evens: $36.38 and $42.63
- Why it fits: the short strikes sit just inside the implied rails ($35.51 and $42.67), with $37 above the $36.80 swing shelf and $42 below the $45 call wall. The estimated positive gamma regime for this expiration argues for dampened rather than amplified movement, and max pain at $38.00 sits inside the body.
- Makes sense only if: you believe the chart models' narrower $37.75–$40.95 band over the options market's $35.51–$42.67. One-clause health warning: you are selling premium that has not been rich lately — options are priced below delivered movement, so this trade wins on decay and pinning, not on a volatility edge.
- Invalidated if: SMCI closes outside $36.38–$42.63, or closes below $38.00 on rising volume — take the loss early rather than defending both wings.
- Earnings exposure: expires before the after-close September 25 report, so it carries no earnings-gap risk.
- Managing it: close at roughly 50% of max credit; exit regardless by the morning of September 25 rather than carrying settlement risk into the report date. If either short strike is breached, close that side instead of rolling.
- Liquidity note: the $37 puts traded 3¢ wide and the $42 calls 4¢ wide (8.5% of mark), while the $35 put and $44 call wings are 2¢ wide but 10%-plus of their marks. The absolute pennies are small; work the mid and don't pay the ask on the wings.
- Analyze this position →
If you lean bearish: September 25 $38/$36 bear put spread
- Trade: Buy the September 25 $38.00 put, sell the September 25 $36.00 put
- Debit: $0.555 ($0.87 paid − $0.315 collected) · Max profit: $144.50 · Max loss: $55.50 · Break-even: $37.45
- Why it fits: it pays off exactly where the constructive read breaks — through $38.00 max pain and the $37.88 20-day average — and it's long premium in a week where premium is priced below delivered movement. Put open interest built 14% relative to calls over five sessions, so you're not alone in owning downside.
- Makes sense only if: you read the September 14 momentum turn as the start of something rather than noise inside a two-month uptrend.
- Invalidated if: SMCI closes above $40.69, the recent swing high — at that point the pin case and the bullish case are both alive and this one isn't.
- Earnings exposure: expires before the after-close September 25 report — no earnings-gap risk, which also means no help from a bad print.
- Managing it: this is a five-day bet against the dominant longer-term trend, so take 60–70% of the intrinsic value if $37.50 trades rather than waiting for $36. Cut it if $40.00 is reclaimed and held.
- Liquidity note: the $38 puts traded 4¢ wide (4.6% of mark) on 1,575 contracts; the $36 puts 3¢ wide. Workable, with the short leg the one to be patient on.
- Analyze this position →
If none of these: no trade
There's an honest case for standing aside. A stock that moved −8.4%, +9.5% and −3.1% in three consecutive sessions, with an earnings report five days out and the short-term trend read fighting the two-month one, is not offering a clean setup — it's offering an implied ±9.17% range that may well be correct. Premium looks cheap versus delivered movement, but the earnings calendar is sitting inside the measurement window, so "cheap" here is a distorted reading rather than an edge you can lean on. If you want SMCI exposure around the report, the cleaner decision is to wait for the October 2 expiration to price the aftermath, not to put risk on for five days of chop ahead of it.
6 · Quick FAQ
What is SMCI's expected move this week? About ±$3.58, or ±9.17%, into the September 25 expiration — a $35.51–$42.67 range around the $39.09 close, per straddle pricing as of Friday, September 18.
Is SMCI expected to go up or down over the next five days? Options positioning as of September 18 leans neutral with a bullish tilt — leading positioning signals and a call-rich volatility surface outweigh soft short-term price momentum — but that's a read of what traders have done, not a forecast. The actionable map is the $35.51–$42.67 range with $38.00 below and $45.00 above.
Are SMCI options expensive right now? IV rank 26/100 says option prices are lower than about 74% of the past year's readings; on top of that, they're running roughly 8 vol points below the movement SMCI has actually delivered over the past month — a gap that is still richer than about 69% of this stock's own recent readings. On balance that favors owning premium rather than selling it, with the caveat that the September 25 report sits inside the measurement window and distorts the comparison.
When is SMCI's next earnings report? September 25, after the close — after the September 25 expiration settles but before October 2, which is why October 2 options are the first rung carrying the report's risk.
Where is SMCI's biggest options support and resistance? For September 25, the call wall is $45.00 and the put wall is $40.00 — note the put wall sits above the close, so the practical downside markers are max pain at $38.00 and swing support at $36.80.
What invalidates this read? A close below $38.00.
Methodology & disclosures. Data: end-of-day options-chain snapshot for SMCI, 2026-09-18, generated 2026-09-20T18:34:19.337Z. Prices shown are midpoints and will differ from live markets. Momentum/positioning scores and volatility-premium comparisons are descriptive measurements of past option flow and past price movement — not investment advice, signals, forecasts, or guarantees. Earnings dates and reported results are from the data provider's earnings feed as of 2026-09-20T18:34:19.337Z; report dates can change. All trade structures are hypothetical. Every structure shown has a defined maximum loss; you can lose the entire max-loss amount. Options involve substantial risk and are not suitable for all investors.