SMH Options Are Pricing a ±$22.51 Move Into Friday — Our Positioning Read and the Chart Model Disagree
Options positioning in SMH leans slightly bullish into the September 18 expiration, with the market pricing a $546.02–$591.04 range around a $568.53 close. The chart model sees the opposite — a drift to $563.50 — and that gap is the most interesting thing on the board this week.

The options market implies a $546.02–$591.04 range into the September 18 expiration; here's what's driving it, where the walls sit, and three defined-risk ways to trade it.
Published Sunday, September 13, 2026 · Data as of the September 11 close · Export generated September 13, 2026
Explore the live SMH options data in the Detailed Options Analyzer →
Quick answer
| Item | Answer |
|---|---|
| Market bias | Slightly bullish |
| Options-implied range (into Sep 18) | $546.02 – $591.04 (±3.96%, or ±$22.51 around the $568.53 close) |
| Major support | $500 — the Sep 18 put wall; the nearest heavy shelf is $550 |
| Major resistance | $600 — the Sep 18 call wall |
| Max pain (Sep 18) | $565 |
| Dealer gamma regime (estimate) | Positive — one rough estimate suggests market-maker hedging tends to dampen moves; flip level ≈ $600 |
| Volatility condition | Falling — IV rank 17/100 · premium fair: options priced about 0.5 vol points above delivered movement |
| Technical check | Diverges (bearish, 3-day and 5-day chart models) |
| Best-fitting strategy | Sep 18 $555/$545 short put spread |
| Analysis invalidated if | SMH closes below $555 |
1 · What matters today
SMH closed at $568.53 and the options market is pricing a move of about $22.51 either way into Friday, September 18 — a $546.02 to $591.04 range. That number comes from what straddles cost at that expiration, and it is the single most useful frame for the next five sessions.
Our read of the options flow leans slightly bullish: puts have been unwinding fast, new open interest is building on the call side, and the premium traders pay for downside protection has flattened versus its own two-month norm. The one thing pushing back is where price sits inside its own corridor — $568.53 is much closer to the $600 call ceiling than to the $500 put floor. Max pain for Friday is $565, essentially where the stock already is.
Both chart models we ran disagree, targeting $563.50–$564.00. That tension is the story. The level that settles it: a close below $555 kills this read.
2 · What the options market is pricing
What changed this week
SMH is up 2.88% over the last five sessions but still down 3.49% over twenty — the past week's bounce is happening inside a market that hasn't gone anywhere for a month, and the 50-day trend read is still flat with price down 8.2% over that longer stretch. The momentum picture turned back up with a crossover on September 4; near-term flow and the bigger trend are not yet telling the same story.
The positioning shift is cleaner. Put open interest relative to calls collapsed from 1.51 to 1.01 over five days — for every call contract held open there is now almost exactly one put, against a 7-day average of 1.20 and a 14-day average of 1.44. Traders took protection off. Against the prior snapshot (September 10), call open interest rose by 30,918 contracts while put open interest fell by 22,230, and that build in fresh call positioning is running unusually heavy versus this name's own recent pace. The single biggest strike-level build was the September 18 $560 call, which added 1,870 contracts. Into Friday's already-settled expiry, the $570 calls had added 805 contracts of open interest — history now, but it shows where the chasing was happening.
Volatility cooperated with the rally: at-the-money implied volatility fell 9.0% in a single session to 31.7%, leaving IV rank at 17/100 versus a 7-day average of 22.
Expected move
Into September 18 the options market is pricing roughly ±$22.51 (±3.96%) — the move implied by straddle pricing, not a forecast. The ladder across nearby expirations:
| Expiration | Implied move | Range around $568.53 |
|---|---|---|
| Mon, Sep 14 | ±1.77% | $558.47 – $578.59 |
| Wed, Sep 16 | ±3.21% | $550.28 – $586.78 |
| Fri, Sep 18 | ±3.96% | $546.02 – $591.04 |
| Fri, Sep 25 | ±5.85% | $535.27 – $601.79 |
The rungs scale almost exactly with the square root of time — there is no bump at any single date, which is what you'd expect for a sector ETF with no scheduled company report of its own on the calendar.
Volatility
At-the-money implied volatility — the market's estimate of how much SMH will move, baked into option prices — sits at 31.7%. IV rank of 17/100 means today's reading is cheaper than about 83% of the past year's, and the 52-week percentile agrees at 15. Direction is down: −9.0% in a day, −39.2% over thirty days, and current IV sits well below both its 30-day average (39.3%) and its 90-day average (47.8%). The front-month read is unavailable today — the chain's nearest expiration had already expired at the snapshot, which is a normal expiry-day artifact rather than missing data.
The other half of the picture: SMH's actual 20-day realized movement is 31.2%, and that is unusually quiet for this name versus its own recent history. Five-day realized movement is running slightly below the 20-day pace, so the stock isn't accelerating either. The VIX overlay is consistent — it sits near the bottom of its own 52-week range and has tracked SMH's implied vol closely (0.68 correlation over 60 days).
Premium rich or cheap? The gap between what options are priced for and what SMH has actually delivered is about half a vol point — positive, but barely. That puts today at the 54th percentile of this stock's own recent readings: squarely middle-of-the-pack, slightly richer than the median but nowhere near an edge. The path matters more than the level here. That gap was negative by roughly 8 vol points in late August, climbed to about +5.5 points by September 8, and then collapsed back to +0.5 when implied vol dropped 9% in Friday's session. Combined with an IV rank of 17, that combination favors neither aggressive premium selling nor aggressive premium buying — it favors defined-risk spreads where the vol level is a secondary input and the strike map does the work.
Skew and sentiment
Puts and calls the same distance from the stock price don't cost the same — when puts are pricier, traders are paying up for crash protection. Right now 25-delta puts run about 2.0 vol points over 25-delta calls (33.4% vs 31.3%), against a 60-day median of 3.8 points for this name. That flattening is real: the 7-day average sits at 2.6 points, and today's reading is stretched toward complacency relative to this ETF's own history. Translation — demand for downside protection has cooled.
Volume tells a slightly different story than open interest. Put volume ran 1.27 times call volume on Friday, above the 7-day average of 1.06 — there was still put activity, it just wasn't sticking as open positions. Total option volume was only 0.82× its 20-day average, so none of this happened on heavy participation.
Sentiment in short-dated options reads Broadly Bullish: the 0–7 day bucket scores +28 and the 7–30 day bucket +40, both above their 7-day averages of +22 and +24. The driver in both is risk reversals — calls are priced about 4–6 vol points richer relative to puts than their own multi-week baseline.
The key levels map
For the September 18 expiration specifically, the call wall and put wall sit at $600 and $500 — and for once those match the whole chain's heaviest strikes exactly, so there's no disagreement between the week's map and the aggregate.
| Level | Price | Why it matters |
|---|---|---|
| Call wall (Sep 18) & gamma flip estimate | $600 | 16,857 calls open at that strike for Friday (25,544 chain-wide) — the heaviest call pile and the level a rough estimate puts the dealer-hedging flip at |
| Swing resistance | $596.19 | Prior pivot cluster from the price feed |
| Top of implied range | $591.04 | Upper rail of Friday's priced-in move |
| Heavy call strike | $590 | 10,825 calls open for Sep 18; a top-five gamma strike chain-wide |
| Call OI shelf / swing resistance | $580 – $580.87 | 6,763 Sep 18 calls open plus a clustered swing high; also the busiest call strike by volume Friday |
| 100-day moving average | $573.03 | Price is 0.78% below it |
| Swing resistance / 50-day MA | $570.02 / $569.10 | The chart models' overhead cluster; price closed 0.1% under the 50-day |
| Spot | $568.53 | Friday's close |
| Max pain (Sep 18) | $565 | Where the most option value would expire worthless — expirations sometimes gravitate toward it |
| 20-day moving average | $563.45 | Price sits 0.9% above it |
| Call OI build | $560 | 3,772 Sep 18 calls open after Friday's 1,870-contract build |
| Swing support | $554.66 | Recent pivot low cluster |
| Gamma shelf / put OI | $550 | Largest total gamma strike on the whole chain; 13,313 Sep 18 puts open |
| Bottom of implied range | $546.02 | Lower rail of Friday's priced-in move |
| Put wall (Sep 18) | $500 | 19,781 puts open (29,449 chain-wide) — the structural floor of the corridor, far below spot |
| 200-day moving average | $482.16 | Price is 17.9% above it — the long-term structure is still constructive |
The practical read: the corridor that matters for Friday is much narrower than $500–$600. Real supply sits at $580 and $590; real open put interest starts at $550.
Positioning and unusual flow
The dealer-gamma read for the September 18 expiration is an estimate, built on an assumed sign convention rather than observed inventory — but that estimate comes out clearly positive for Friday, which is the regime where market-maker hedging tends to dampen moves rather than amplify them. Three flow items stood out among contracts that are still tradeable:
- Sep 18 $587.50 calls — 3,812 contracts traded against 767 open, roughly $1.0 million of premium at a strike that carried no open interest the day before. Someone paid up for a move through the $580s by Friday.
- Oct 9 $570 and $567.50 puts — 1,963 and 1,926 contracts against single- and double-digit open interest, about $3.8 million and $3.5 million of premium respectively. These were the two largest premium prints on the entire chain, and they are near-the-money downside protection roughly a month out. The near-dated flow is buying upside; the deferred flow is buying insurance.
- Sep 18 $580 calls — 2,312 contracts on 6,763 open, about $1.1 million of premium, right into the heaviest near-term call shelf.
3 · Technical check
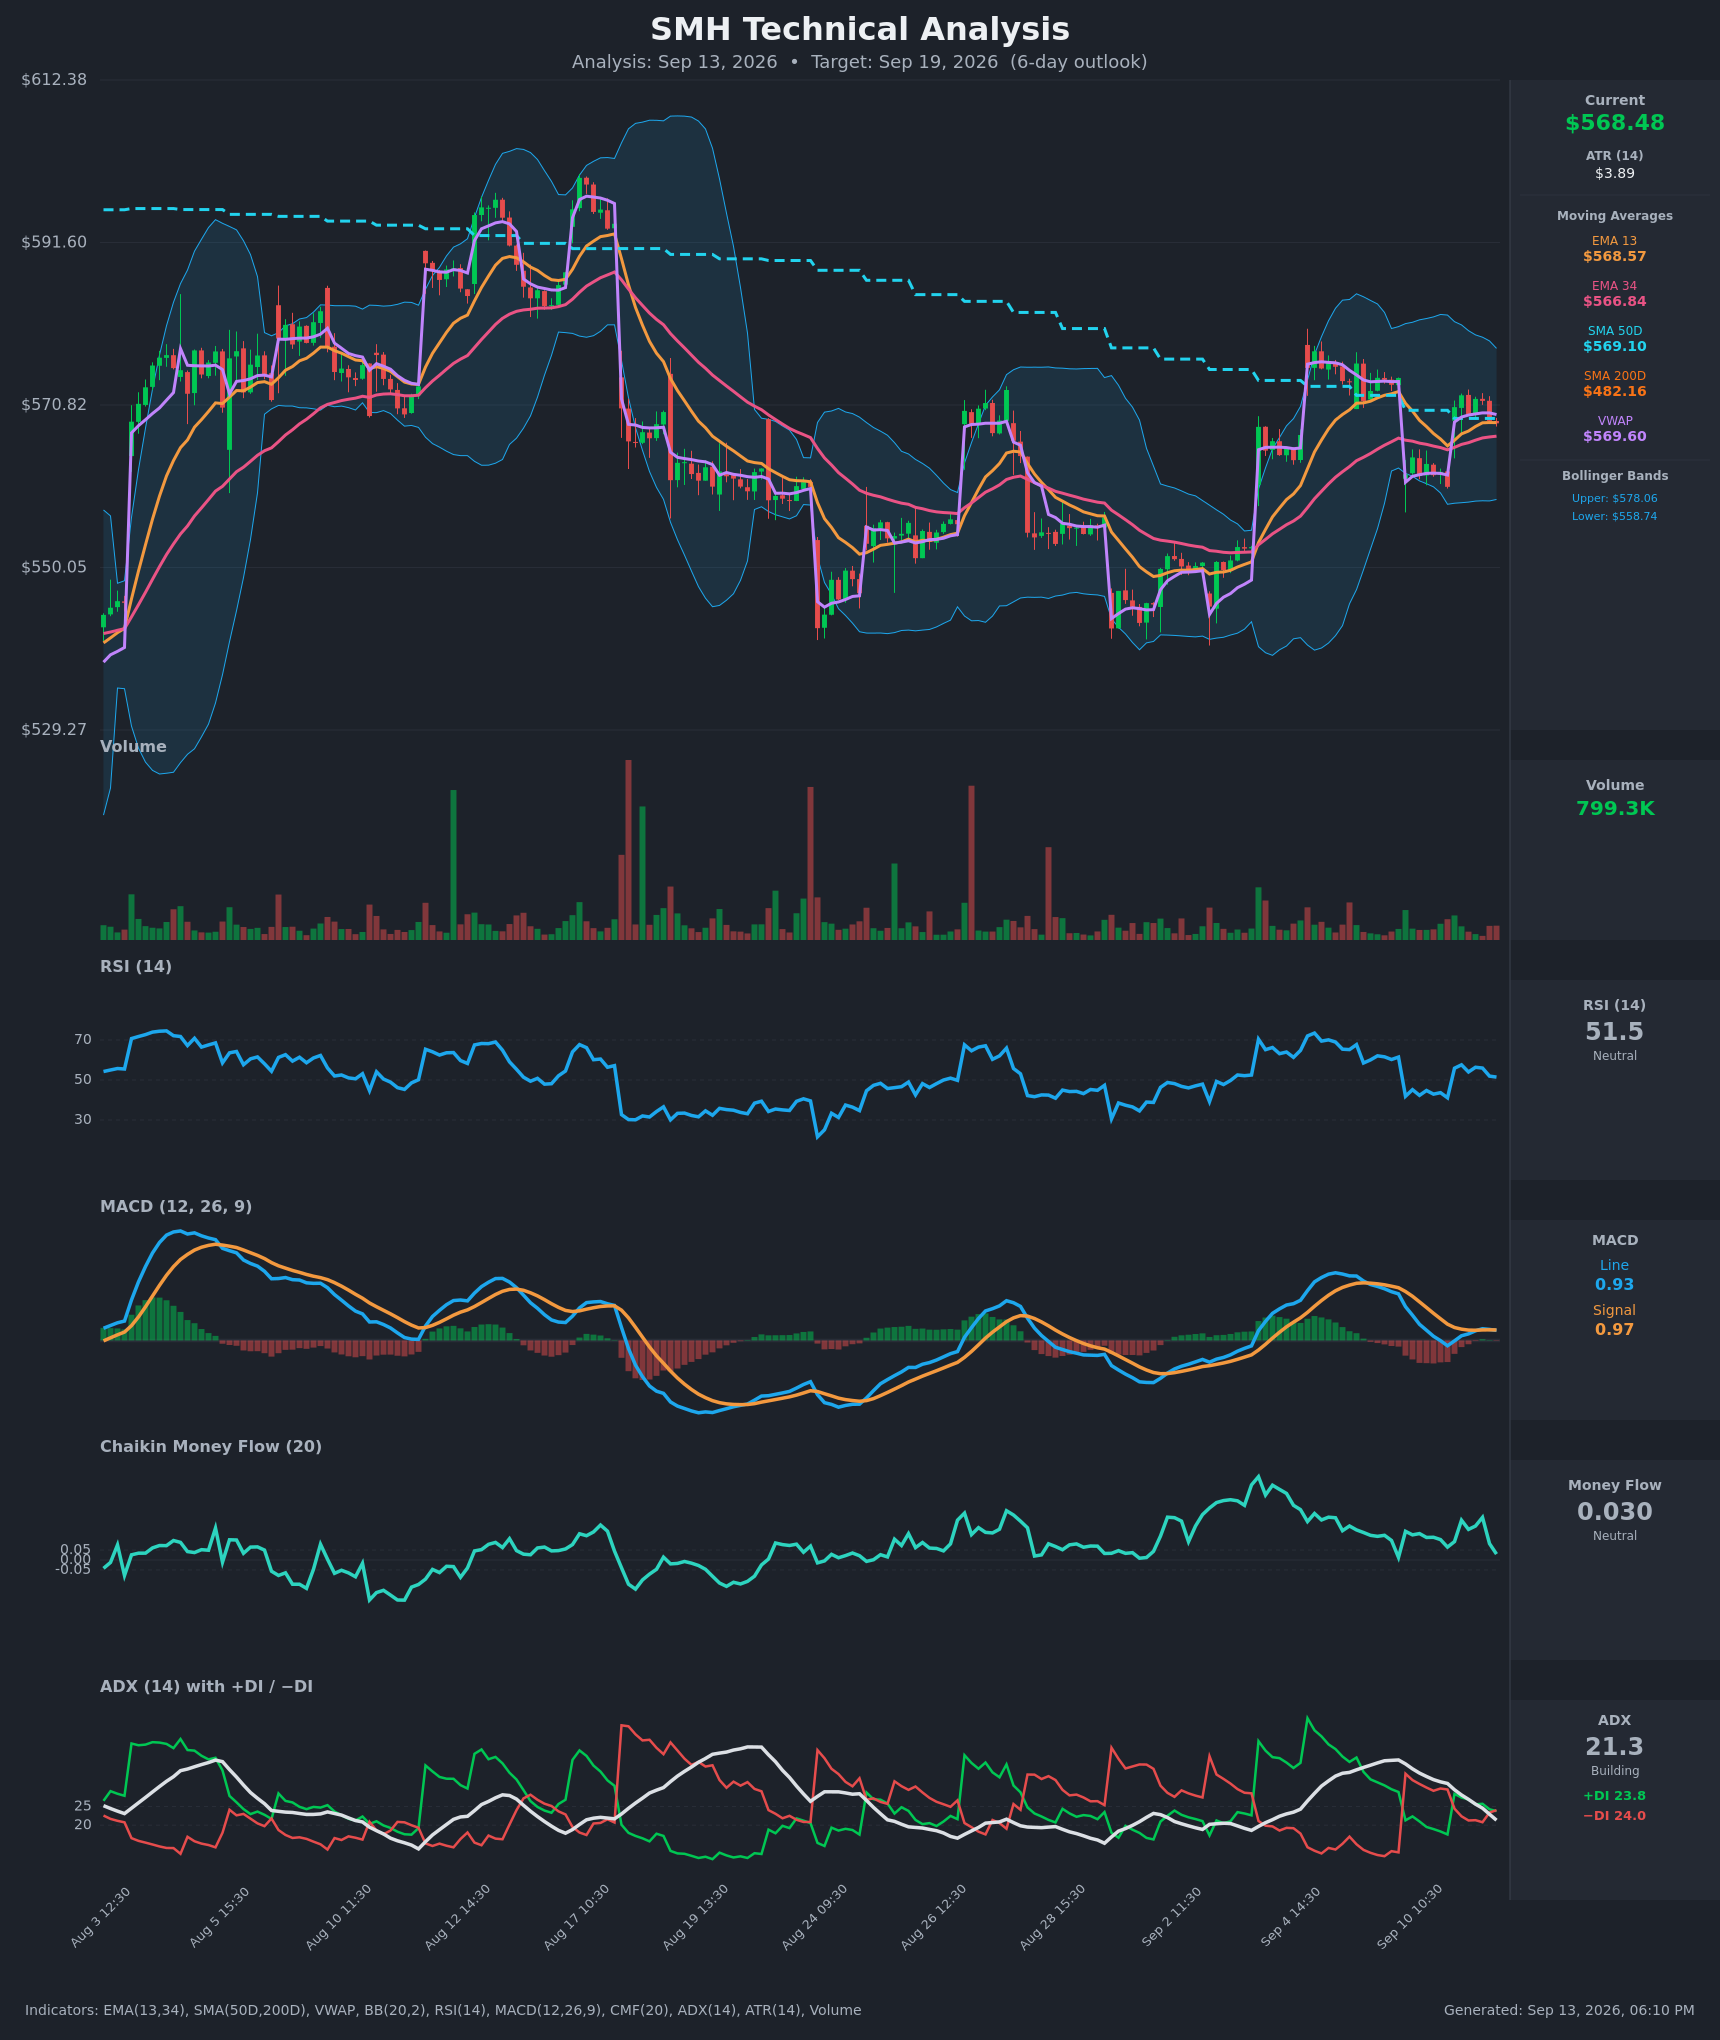
Both chart models we ran come back bearish, and both were generated Sunday off the same $568.48 reference price the options data uses — so this is a genuine disagreement, not a stale-data artifact. The 3-day model (target date September 16) projects $564.00 with a range of $555.50–$577.50. The 5-day model (target date September 18, matching our expiration) projects $563.50 with a range of $552.00–$580.00.
The reasoning is consistent across both: a fresh MACD bearish crossover after the September 11 bounce stalled, price slipping just under the VWAP/50-day cluster near $569–$570, and the directional indicators flipping with −DI edging above +DI. The caveat the models themselves flag is that ADX sits at 21.3, below the 25 trend threshold — this is a weak, shallow tilt inside a multi-week range, not a trend change. Both name $558–$561 as the downside target zone and both invalidate on a close back above $574.
Classification: Diverges. The direction contradicts the options read, but note that the chart model's own target ($563.50) sits comfortably inside the options-implied range and only $1.50 below max pain. The two views disagree about direction and agree almost exactly about magnitude — nobody is pricing a breakout.
Model vs. Market: The options market implies $546.02–$591.04 into Friday; the 5-day technical model targets $563.50 within $552.00–$580.00. The gap that resolves it is narrow — a close back above $574 kills the chart model's case, a close below $555 kills ours, and between those two the positioning read and the chart read are describing the same chop from opposite sides.
What this changed below: it shaded the short strikes of the range structure lower rather than symmetrically, and it is why the bullish structure is built with a break-even underneath the chart model's $558–$561 target zone rather than above it.
Full technical write-ups: 3-day report → · 5-day report →
4 · Three ways the week can go
If SMH pushes above the call wall ($600): that would require a 5.5% move in five sessions — above the upper rail of the priced-in range. Far more relevant is the $580–$590 corridor, where 6,763 and 10,825 Sep 18 calls sit open. Heavy call open interest overhead tends to slow rallies as it is hedged; clearing $590 on volume would leave much thinner positioning up to $596–$600.
If SMH drifts between the walls: this is the base case the structure supports. Max pain for Friday is $565, roughly 0.6% below spot, and the dealer-gamma estimate for that expiration reads positive — the regime in which hedging flows tend to pull price toward the heavy strikes rather than push it away. A close between $560 and $575 on Friday would be the most ordinary outcome on this map, and would let both the bullish positioning read and the bearish chart read technically "work."
If SMH breaks below $555: the $550 shelf is the largest total gamma strike on the chain with 13,313 Sep 18 puts open — it absorbs first, and then there is very little structural support until the $539 swing zone. Worth flagging: the same rough model that calls the current regime positive puts its flip estimate at $600, meaning spot currently sits about 6.4% below it — further below than is typical for this name. Read that as a reminder that the "hedging dampens moves" estimate is an estimate, not a floor.
5 · Three defined-risk structures
Prices are end-of-day midpoints as of September 11. All structures are hypothetical. Verify live prices before trading — these will be stale by the open, and Friday's closing quotes on this chain were wide.
If you lean bullish: Sep 18 $555/$545 short put spread
- Trade: Sell the Sep 18 $555 put, buy the Sep 18 $545 put
- Credit: $1.93 · Max profit: $193 · Max loss: $807 · Break-even: $553.07
- Why it fits: You collect premium up front and keep it if SMH stays above $555. The short strike sits just above the $554.66 swing-pivot cluster and above the $550 gamma shelf, and its break-even at $553.07 sits below the $558–$561 zone both chart models call their downside target — the structure survives the bearish scenario being right in magnitude. Skew flattening to 2.0 vol points against a 3.8-point norm means you are not being paid unusually well for this risk, which is why the width stays modest.
- Makes sense only if: you believe the put unwind and call-side open-interest build of the last five sessions is real positioning rather than a one-day artifact.
- Invalidated if: SMH closes below $555.
- Managing it: close at roughly 50% of max credit; exit regardless by Thursday's close rather than carrying a short strike into expiration gamma. With the near-term move fighting a flat 50-day trend, take profits earlier than you'd like rather than later.
- Liquidity note: the $555 puts quoted $3.75/$4.55 (80¢ wide, ~19% of mid) and the $545 puts $1.93/$2.51 (58¢). Work the spread as a package with a limit — do not pay the natural.
- Analyze this position →
If you expect the range to hold: Sep 18 $540/$550/$585/$595 iron condor
- Trade: Sell the $550 put / buy the $540 put, sell the $585 call / buy the $595 call, all Sep 18
- Credit: $3.22 · Max profit: $322 · Max loss: $678 · Break-evens: $546.78 and $588.22
- Why it fits: Both break-evens sit essentially on the rails of the implied range ($546.02–$591.04), the short call is under the $590 call shelf, and the short put is at the biggest gamma strike on the chain. Max pain at $565 and a positive dealer-gamma estimate for Friday both describe the pinning case this structure is built for.
- Makes sense only if: you're comfortable that the premium here is fair rather than rich — at the 54th percentile of its own recent readings, the vol gap gives you no extra cushion, so this is a bet on the level map, not on expensive options.
- Invalidated if: SMH closes outside $550–$585.
- Managing it: close at ~50% of max credit; roll or close the tested side if either short strike is breached on a closing basis. Exit the whole position by Thursday.
- Liquidity note: $550 put 69¢ wide, $540 put 49¢, $585 call 81¢, $595 call 38¢. Four wide legs compound — this is the structure where slippage most threatens the edge; enter as a single order.
- Analyze this position →
If you lean bearish: Sep 18 $570/$560 long put spread
- Trade: Buy the Sep 18 $570 put, sell the Sep 18 $560 put (you pay a debit and profit as price falls toward the lower strike)
- Debit: $3.98 · Max profit: $602 · Max loss: $398 · Break-even: $566.03
- Why it fits: This is the structure that expresses the chart models directly — at their $563.50 target the spread is worth about $6.50, well above the $3.98 paid. With the vol gap near zero, owning premium costs you no meaningful overpayment here, and these are the two tightest strikes on the Friday board.
- Makes sense only if: you weight the MACD crossover and the failure under the $569–$570 VWAP/50-day cluster more heavily than the options-flow read — an explicitly contrarian stance versus this article's bias.
- Invalidated if: SMH closes above $574 (the invalidation level both chart models name).
- Managing it: take profit at $563–$560 rather than holding for max value; the short-term downside case is fighting an intact long-term uptrend 17.9% above the 200-day average, so harvest early.
- Liquidity note: the $570 puts traded 90¢ wide on $9.55 mid (9.4% — the tightest quote on the expiration, with 1,240 contracts traded) and the $560 puts 75¢ on $5.58 mid.
- Analyze this position →
If none of these: no trade
There is a real case for standing aside. IV rank at 17/100 means you are selling some of the cheapest options of the past year, and the premium over delivered movement — half a vol point, 54th percentile — offers no compensating edge for the credit structures. Meanwhile the debit structure requires you to pay up in a market where realized movement is unusually subdued for this name, so time decay works against you from day one. On top of that, Friday's closing quotes were wide across nearly every strike on this chain: a 20% bid-ask on a 10-point spread can eat a quarter of the theoretical edge before the trade starts. If you can't get filled near the midpoint, the honest answer is to skip the week.
6 · Quick FAQ
What is SMH's expected move this week? About ±$22.51 (±3.96%) into the September 18 expiration, which frames a $546.02–$591.04 range around the $568.53 close — per the options market's straddle pricing as of September 11.
Is SMH expected to go up or down over the next week? Options positioning as of September 11 leans slightly bullish — put open interest unwound from 1.51 to 1.01 against calls in five days while call open interest built by nearly 31,000 contracts — but that's a read of what traders have already done, not a forecast. Both chart models point the other way, at $563.50–$564.00. The actionable map is the $546.02–$591.04 range with $550 and $580 as the levels that matter inside it.
Are SMH options expensive right now? IV rank of 17/100 says option prices are lower than 83% of the past year's readings; on top of that, they're running only about half a vol point above the movement SMH has actually delivered — the 54th percentile of this ETF's own recent readings. Verdict: neither rich nor cheap, which argues for defined-risk spreads over outright premium selling or buying.
Where is SMH's biggest options support and resistance? For September 18, the put wall is $500 (19,781 contracts) and the call wall is $600 (16,857) — both matching the chain-wide heaviest strikes. Inside that wide corridor, the levels that actually matter this week are the $550 gamma shelf below and the $580/$590 call shelves above.
What invalidates this week's read? A close below $555.
Methodology & disclosures. Data: end-of-day options-chain snapshot for SMH, 2026-09-11, generated 2026-09-13T18:10:43.314Z. Prices shown are midpoints and will differ from live markets. Momentum/positioning scores and volatility-premium comparisons are descriptive measurements of past option flow and past price movement — not investment advice, signals, forecasts, or guarantees. All trade structures are hypothetical. Every structure shown has a defined maximum loss; you can lose the entire max-loss amount. Options involve substantial risk and are not suitable for all investors.