SMH Options Are Pricing a ±$20 Move Into September 25 — And Every Heavy Strike Sits Below Spot
The options market implies a $552.72–$593.28 range for SMH into the September 25 expiration, yet the heaviest open interest for that date — call wall, put wall and max pain — all pile up at $560, below Friday's close. Here's what the positioning says and three defined-risk ways to trade it.
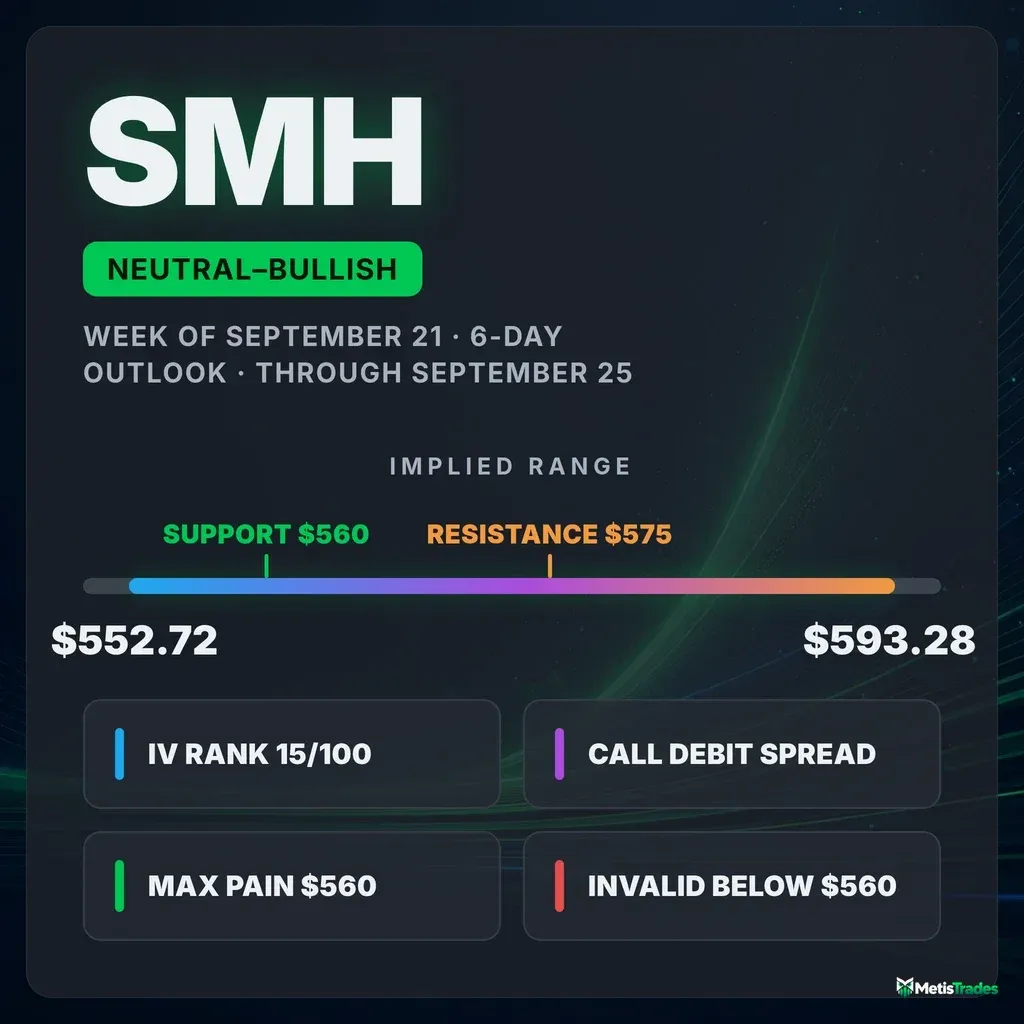
The options market implies a $552.72–$593.28 range into the September 25 expiration; here's what's driving it and three defined-risk ways to trade the next six days.
Published Saturday, September 19, 2026 · Data as of Friday, September 18, 2026 close
Explore the live SMH options data in the Detailed Options Analyzer →
Quick answer
| Item | Answer |
|---|---|
| Market bias | Slightly bullish |
| Options-implied range (into September 25) | $552.72 – $593.28 (±3.54%) |
| Major support | $560 — the September 25 put wall |
| Major resistance | $575 — the gamma-flip estimate and heaviest gamma cluster (the September 25 call wall sits below spot, at $560) |
| Max pain (September 25) | $560 |
| Dealer gamma regime (estimate) | Positive — hedging tends to dampen moves; flip level ≈ $575 |
| Volatility condition | Falling — IV rank 15/100 · premium thin: options priced ~2.7 vol points below delivered movement |
| Technical check | Confirms (bullish, 3-day and 6-day chart models) |
| Best-fitting strategy | September 25 $575/$585 call debit spread |
| Analysis invalidated if | SMH closes below $560 |
1 · What matters today
SMH closed Friday, September 18 at $573.00 after a sharp two-day bounce, and the options market is pricing roughly $20 up or down — a $552.72 to $593.28 range — through the September 25 expiration. Our read of options flow leans mildly bullish: put activity dried up (for every call contract traded there were only 0.79 puts, versus a 1.41 average over the past week), call-side open interest built hard, and short-dated sentiment flipped positive. The catch is structural. Every heavy strike for September 25 — the biggest call pile, the biggest put pile, and max pain, the price where the most option value expires worthless — sits at $560, below the current price. That makes $560 the line: hold above it and the lean stands; a close beneath it kills this read. Both chart models agree with the upside, targeting $580–$582.
2 · What the options market is pricing
What changed this week
The week was a round trip. SMH fell hard into midweek — a 5.02% down gap on September 14 — then gapped 2.67% higher on September 17 and pushed on Friday, leaving the underlying +0.79% over five sessions and +1.84% over twenty. The options chain flipped with it. Put/call open interest went from 1.01 to 0.89 over five days, meaning that for every call contract held open there are now just 0.89 puts, against a 1.37 average across the past week — traders unwound protection at a fast clip. Friday alone saw call open interest add roughly 28,800 contracts while put open interest shed about 103,100, one of the most call-tilted single-day builds this name has registered against its own recent history.
Volatility kept bleeding: the market's estimate of how much SMH will move, baked into option prices, is down 33.5% over the past thirty sessions and now sits at 31.6%, well under its 30-day average of 36.1% and far under the 90-day average of 47.2%. The biggest single open-interest change in a still-live contract was the October 16 $540 put, which added 2,140 contracts — downside insurance being rolled further out and further down rather than abandoned. One tension worth naming: the short- and long-term trend reads don't tell the same story. Price is up 0.8% over the past week and 1.8% over the past month, but still down 5.7% over the past two-and-a-half months. The bounce is real; the bigger structure is still repairing.
Expected move
Into September 25, the options market is pricing a ±3.54% move — about $20.28 either side of $573.00, giving $552.72 to $593.28. That figure is the move the options market is pricing in, derived from what at-the-money straddles cost. Here's how it scales across the ladder (the September 21 rung is skipped — quote quality there was too poor to price it):
| Expiration | Implied move | Range around $573.00 |
|---|---|---|
| September 22 (4 DTE) | ±2.29% | $559.88 – $586.12 |
| September 25 (7 DTE) | ±3.54% | $552.72 – $593.28 |
| October 2 (14 DTE) | ±5.68% | $540.45 – $605.55 |
| October 16 (28 DTE) | ±8.74% | $522.92 – $623.08 |
The ladder climbs smoothly — no kink, no hump, no single date the chain is bracing for. That smoothness is itself information: the market is pricing ordinary time decay of risk, not a scheduled event.
Volatility
At-the-money implied volatility is 31.6% with an IV rank of 15/100 — meaning today's reading is cheaper than about 85% of the past year's readings, and the IV percentile of 13 says the same thing a second way. Direction is still downward: IV fell 1.7% on Friday and 0.2% over five sessions, on top of that 33.5% thirty-day collapse. The 60-day tenor prices at 33.9%, and the September 25 rung itself prices at about 25.6% — short-dated options are the cheapest part of the curve. The front-month read is unavailable today (Friday was an expiry day, so that tenor can't be interpolated). For context, VIX is sitting near the floor of its own 52-week range at a rank of 8/100, and this fund's implied vol has tracked it with a 0.59 correlation over the past sixty sessions — the calm is broad, not idiosyncratic.
Underneath, the stock is moving more than that calm suggests. Twenty-day realized volatility is 34.3%, but the five-day figure is running 1.39 times the twenty-day — an acceleration well above this fund's own norm, driven by those two big gaps. Ten-day realized vol is 37.9%.
Premium rich or cheap. The volatility risk premium — the gap between how much movement options are priced for and how much SMH has actually delivered — is currently negative: options are priced about 2.7 vol points below realized movement. Measured against this fund's own recent readings, that sits at the 44th percentile, so it's thinner than roughly 56% of them. The past week's path has been choppy around zero (briefly positive on September 16, back negative since), which is what you'd expect when a single gap day keeps re-weighting the realized leg. The practical read: with IV rank at 15 and the premium running below delivered movement, this is a week that favors owning optionality rather than selling it. Credit structures here are collecting thin compensation for real gap risk.
Skew and sentiment
Puts and calls the same distance from the price don't cost the same — 25-delta puts are running 3.6 vol points over the equivalent calls (34.1% versus 30.5%), against a 60-day median of 3.8 points for this name. Slightly flatter than normal, in other words: traders are paying up for downside protection, but marginally less than they usually do. That's complacency at the margin, not fear.
Flow confirms it. Put/call volume at 0.79 is 44% below the 60-day median of 1.42 and well below the 1.41 seven-day average — an unusually call-tilted session for this fund by its own standards. Six call contracts cleared the peer-relative unusual-volume bar against five puts. Sentiment in short-dated options reads +20 in the 0–7 day bucket and +19 in the 7–30 day bucket, both positive after a week that included a −50 capitulation print on September 16; the 30–60 day bucket is the strongest at +47, while the 60–120 day bucket sits at −14. The overall regime label is "Mixed" — the near end has turned constructive while the long end hasn't.
The key levels map
| Level | Price | Why it matters |
|---|---|---|
| 52-week high | $671.83 | 14.7% overhead; range position 72.5/100 |
| Whole-chain heaviest call strike | $600.00 | 34,518 contracts across all expirations — a magnet for October, not for this window |
| Swing resistance | $596.19 | Heuristic pivot cluster from recent price structure |
| Upper implied rail (Sept 25) | $593.28 | Top of the options-implied range |
| Prior swing high (chart model) | $591.00 | Secondary resistance in both technical reports |
| Heavy call open interest | $585.00 | 13,341 contracts chain-wide; the first real overhead pile |
| Swing resistance | $580.57 | Recent pivot high cluster |
| Gamma-flip estimate | $575.00 | One rough estimate puts the hedging pivot here; also the chain's second-largest gamma strike |
| Friday's close | $573.00 | Spot — essentially sitting on the flip estimate |
| Swing support | $570.02 | Nearest structural shelf; a large gamma strike sits here too |
| 50-day moving average | $564.78 | Price is 1.45% above it |
| Sept 25 call wall, put wall AND max pain | $560.00 | The single most crowded strike for this expiration — and the chain's largest gamma strike overall |
| 20-day moving average | $557.82 | Price is 2.72% above it |
| Swing support | $554.66 | Prior consolidation shelf |
| Lower implied rail (Sept 25) | $552.72 | Bottom of the options-implied range |
| Whole-chain heaviest put strike | $500.00 | 34,264 contracts across all expirations — the far downside anchor |
Worth stating plainly: the aggregate picture and the expiration picture disagree. Across all sixteen covered expirations the heaviest call strike is $600 and the heaviest put strike is $500 — a very wide corridor. For September 25 specifically, both walls collapse onto the same strike, $560. That's unusual and it matters: for this window there is no meaningful overhead open-interest barrier. The crowd is clustered beneath the market.
Positioning and unusual flow
One rough estimate of dealer positioning puts the regime as positive for both the whole chain and the September 25 expiration specifically — in that state, market makers hedging the options they've sold tend to dampen moves rather than amplify them. The same estimate places the pivot ("gamma flip") at $575, essentially where SMH closed; below it, the estimate flips to hedging that accelerates selling instead of cushioning it. Treat that number as an estimate built on an assumed dealer sign convention, not observed inventory — but note that spot sitting right on top of it means the chain's cushioning effect is finely balanced into this window.
Three live flow items stood out Friday. The September 25 $580 calls traded 1,676 contracts against 451 open — about $813,000 of premium, roughly 3.7 times turnover on existing positions, and the strike sits just above Friday's close. The September 28 $550 puts traded 808 contracts against just 39 open — near-21× turnover, someone buying a cheap post-window floor. And the October 16 $530 puts changed hands 3,724 times for about $2.26 million in premium, the single biggest dollar-premium trade in a live contract on the board. Read together: aggressive near-dated call buying, paired with downside insurance pushed out to October and down to strikes 7–8% below spot.
3 · Technical check (the 20%)
Both chart models read bullish. The 3-day model (target date September 22) projects $580.00 with a range of $559.00 to $587.00; the 6-day model (target date September 25, matching our window exactly) projects $582.00 with a range of $556.00 to $591.00. Both quote a reference price of $572.97, within pennies of the options snapshot, so the two data sets are describing the same session.
Classification: Confirms. The 6-day target of $582.00 sits comfortably inside the options-implied $552.72–$593.28 range, and the model's projected range is narrower than what options are pricing — the chart sees the same direction the flow does, with slightly less dispersion. The decisive reads behind it are ADX at 25.7 and rising with +DI (44.1) far above −DI (17.0), a genuinely strengthening directional trend rather than range noise, and Chaikin Money Flow at 0.157 climbing steadily over the past eight bars, which the report frames as sustained accumulation into the breakout. The caution is RSI at 71.6 — overbought, with price pressing the upper Bollinger Band at $574.16, which historically precedes a pause more often than a top. The dominant scenario's invalidation is a daily close below $560, the same level our options read uses.
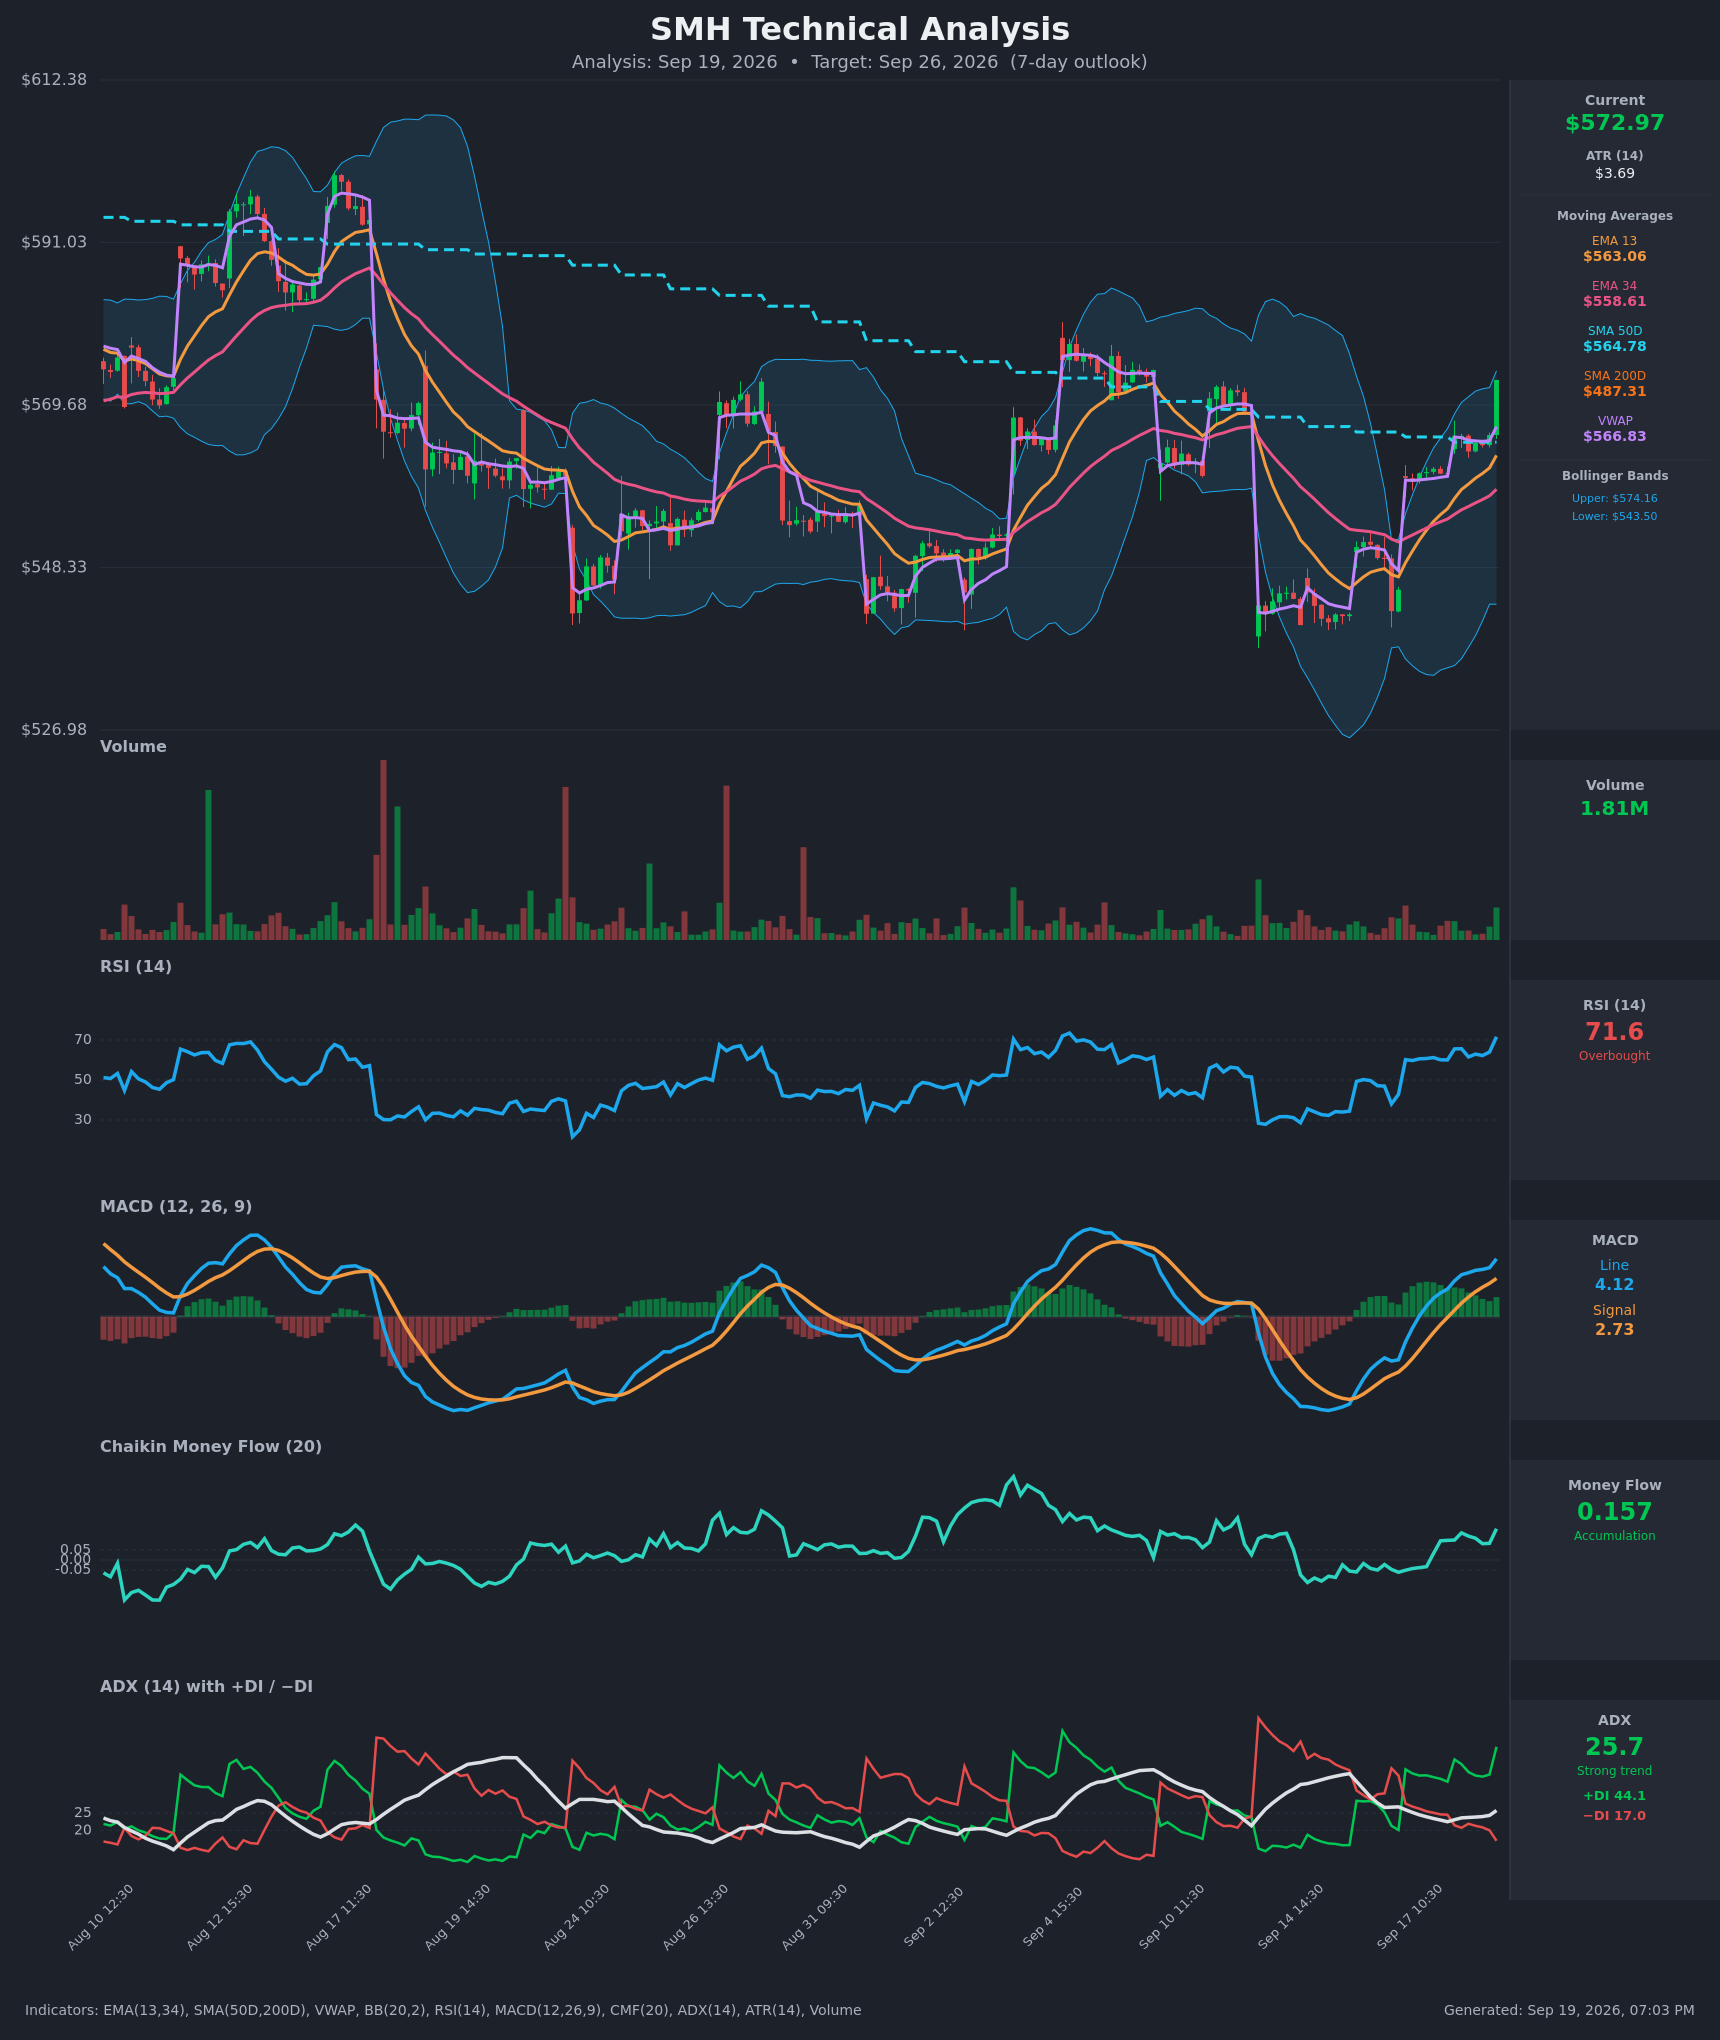
Model vs. Market: The options market implies $552.72–$593.28 into September 25; the 6-day technical model targets $582.00 inside a $556.00–$591.00 band. The gap is one of conviction, not direction — the chart is willing to name an upside number where the options chain is merely pricing symmetric dispersion, so the two agree on the lean and disagree only on how much of the range is likely to get used.
TA nudged strike selection upward rather than flipping anything: the bullish structure below is built around $575–$585, which brackets both model targets, and the range-bound structure's upper short strike was pushed out to $592.5 rather than parked closer to spot.
Full technical write-ups: 3-day report → · 6-day report →
4 · Three ways the next six days can go
If SMH holds above $575: there is remarkably little options structure overhead for this expiration. The September 25 call wall is behind the market at $560, and the next real pile of call open interest doesn't appear until $585. Positioning that thin above spot tends to offer less resistance to a continued push — the upper implied rail at $593.28 and the swing-resistance shelf at $596.19 are the first meaningful ceilings.
If SMH drifts between $560 and $575: this is the pin case, and it's the one the crowd is positioned for. Max pain for September 25 sits at $560, which is also the strike with the most open calls, the most open puts, and the largest gamma concentration on the entire chain. Expirations sometimes gravitate toward that kind of cluster as hedges unwind, and the positive gamma estimate implies hedging that damps rather than amplifies day-to-day swings. A slow bleed back toward $560–$565 into Friday would be entirely consistent with how this chain is built.
If SMH breaks below $560: spot is already sitting essentially on the $575 flip estimate, so the cushion is thin to begin with — below that pivot, one rough estimate suggests market-maker hedging starts amplifying selling rather than absorbing it. Losing $560 would take out the 20-day average at $557.82 and the swing shelf at $554.66 in short order, with the lower implied rail at $552.72 the first place the pricing says the move should stall. That is the branch this article's thesis does not survive.
5 · Three defined-risk structures
Prices are end-of-day midpoints as of 2026-09-18. All structures are hypothetical. Verify live prices before trading — these will be stale by the open.
A note on ordering: because the premium gap is negative — options priced below delivered movement — the two debit structures lead here and the credit structure comes with a warning label. A general caution for all three: end-of-day quotes on this chain are wide. Every spread below should be worked as a package with a limit order near the midpoint, not lifted at the offer.
If you lean bullish: September 25 $575/$585 call debit spread
- Trade: Buy the September 25 $575 call, sell the September 25 $585 call
- Debit: $4.30 ($7.10 paid − $2.80 collected) · Max profit: $570 per spread · Max loss: $430 per spread · Break-even: $579.30
- Why it fits: You pay for a move rather than sell one, which is the right side of a premium gap running 2.7 vol points below realized movement with IV rank at 15/100. Structurally, the $575 strike is the gamma-flip estimate and the $585 strike is the first heavy call pile above spot — you're buying the thin stretch of the chain and selling the first crowded strike. Both chart models' targets ($580 and $582) sit above the break-even.
- Makes sense only if: you believe Friday's breakout follows through rather than fading back into the $560 cluster. Note the near-term trend is fighting a market still down 5.7% over two months, which argues for taking profits early rather than holding for the full width.
- Invalidated if: SMH closes below $560.
- Managing it: take profit at roughly 60–70% of maximum value rather than waiting for expiration pin risk; exit by Wednesday, September 23 if the stock is still under $575, since the remaining time value decays fastest in the final two sessions.
- Liquidity note: the $575 calls closed $1.70 wide on a $7.10 mid (about 24%) and the $585 calls $1.40 wide on a $2.80 mid — both far wider than the 5% comfort bar. The $575 strike did trade 1,243 contracts and $883,000 of premium Friday, so intraday markets are tighter than the closing quote implies, but slippage is a real cost here. Limit orders only.
- Analyze this position →
If you lean bearish: September 25 $570/$560 put debit spread
- Trade: Buy the September 25 $570 put, sell the September 25 $560 put
- Debit: $3.50 ($7.35 paid − $3.85 collected) · Max profit: $650 per spread · Max loss: $350 per spread · Break-even: $566.50
- Why it fits: it targets exactly the level the chain is built around. The short strike sits on the September 25 max pain, call wall and put wall all at once, so you're selling the single most crowded strike and buying the shelf just under spot. Same premium logic as above — you're the buyer of optionality in a week where implied is trading under realized.
- Makes sense only if: you read the bounce as a gap-fill that stalls at the $575 pivot and reverts to the max-pain cluster. This fights the computed bias, so size it as the hedge it is.
- Invalidated if: SMH closes above $580.57, the nearest swing-resistance shelf.
- Managing it: close at 50–60% of maximum value; if SMH is still above $570 by Wednesday, September 23, take whatever is left rather than paying for two more days of decay.
- Liquidity note: the $560 puts traded 1,450 contracts Friday against 1,704 open and quoted $1.90 wide on a $3.85 mid (about 49%); the $570 puts quoted $2.40 wide on a $7.35 mid. Wide on both legs — expect to give up real money getting filled, and price the spread as a unit.
- Analyze this position →
If you expect the range to hold: September 25 iron condor
- Trade: Sell the $555 put / buy the $547.5 put, and sell the $592.5 call / buy the $600 call, all September 25. In a condor you collect premium up front and win if the stock stays between your two short strikes.
- Credit: $1.825 · Max profit: $182.50 per condor · Max loss: $567.50 per condor · Break-evens: $553.18 and $594.33
- Why it fits: the short strikes sit essentially on the implied rails ($552.72 and $593.28), with marginally more room given to the upside in deference to the bullish lean and the two chart models. The positive dealer-gamma estimate supports the dampening case if price stays inside the corridor.
- Makes sense only if: you specifically want short-gamma exposure into a quiet week — and you should know you're selling premium that hasn't been rich lately. With IV rank at 15/100 and options priced about 2.7 vol points below what SMH has actually delivered, this is the structurally weakest of the three ideas this week. The 3.1-to-1 loss-to-gain ratio is the price of that thin premium.
- Invalidated if: SMH closes outside $555–$592.5 — at that point the position is already working against you and the remaining credit is not worth defending.
- Managing it: close at roughly 50% of max credit; exit regardless by Wednesday, September 23 to avoid final-two-day gamma, and close rather than hope if either short strike is breached on a closing basis.
- Liquidity note: the $555 puts quoted $1.46 wide on a $2.72 mid and the $592.5 calls $0.87 wide on a $1.47 mid. Against a $1.83 credit, those spreads can eat a third of the trade's edge before it starts. If you can't get filled near the midpoint on all four legs, skip it.
- Analyze this position →
If none of these: no trade
There is a clean case for standing aside. Implied volatility at an IV rank of 15/100 is near the bottom of its yearly range and still falling, which means long-premium structures need the move to happen quickly to overcome decay — and short-premium structures are collecting the thinnest compensation in months against a stock that has produced two gaps larger than 2.5% in the past week. On top of that, this chain's closing quotes are conspicuously wide: several of the strikes above show bid-ask spreads of 20–50% of the midpoint, which is a real, recurring tax on every entry and exit. If you can't work orders patiently at the midpoint during liquid hours, the honest expected value of all three structures drops toward zero. A read this mild — a slightly bullish lean, with the crowd's heaviest positioning sitting below the market — doesn't demand a position.
6 · Quick FAQ
What is SMH's expected move this week? ±$20.28, or ±3.54%, into the September 25 expiration — a $552.72 to $593.28 range, per the options market's straddle pricing as of the September 18 close.
Is SMH expected to go up or down over the next six days? Options positioning as of September 18 leans slightly bullish — call-side open interest built sharply, put/call volume collapsed to 0.79 against a 1.41 weekly average, and short-dated sentiment turned positive — but that's a read of what traders have done, not a forecast. The actionable map is the $552.72–$593.28 range and the $560 support / $575 pivot levels.
Are SMH options expensive right now? No. IV rank of 15/100 says option prices are lower than about 85% of the past year's readings; on top of that they're running roughly 2.7 vol points below the movement SMH has actually delivered, a gap thinner than about 56% of this fund's own recent readings. That combination favors buying premium over selling it this week.
Where is SMH's biggest options support and resistance? For the September 25 expiration, both walls sit at the same strike: $560 is the heaviest put open interest (support), the heaviest call open interest, and max pain. Across the whole chain the picture widens to a $500 put wall and a $600 call wall — a different, much longer-dated corridor.
What invalidates this week's read? A close below $560.
Methodology & disclosures. Data: end-of-day options-chain snapshot for SMH, 2026-09-18, generated 2026-09-19T19:03:15.423Z. Prices shown are midpoints and will differ from live markets. Momentum/positioning scores and volatility-premium comparisons are descriptive measurements of past option flow and past price movement — not investment advice, signals, forecasts, or guarantees. All trade structures are hypothetical. Every structure shown has a defined maximum loss; you can lose the entire max-loss amount. Options involve substantial risk and are not suitable for all investors.