SOFI Options Are Pricing a $0.86 Move. Call Buyers and the Chart Model Disagree on Direction
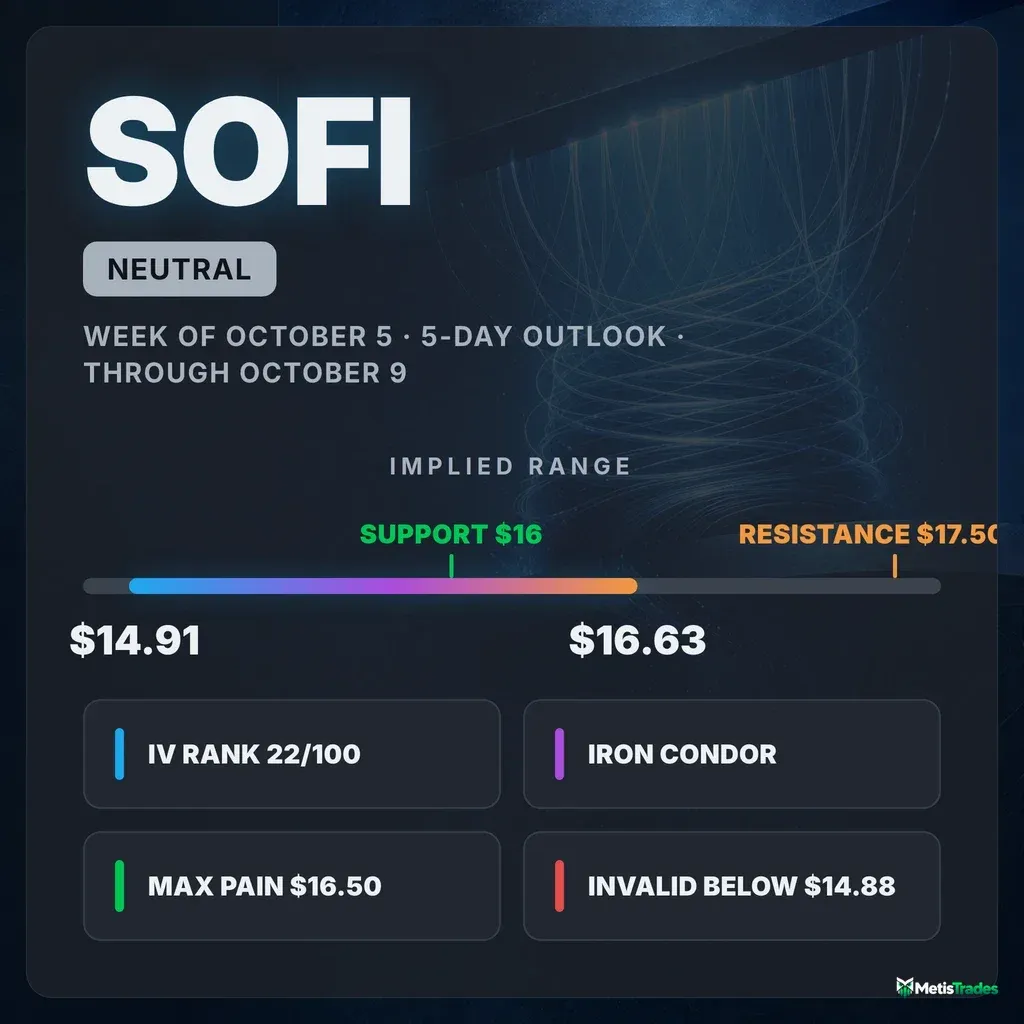
Options imply a $14.91–$16.63 range for SOFI into the October 9 expiration. Short-dated flow leans to calls while the price trend and the chart model lean lower, and premium is running unusually rich against what the stock has actually delivered.
Listen to this analysis — prefer audio? This SOFI outlook is also available as a podcast episode:
The options market implies a $14.91–$16.63 range into the October 9 expiration. Short-dated call buying and a falling price trend are pulling in opposite directions. Here is what's driving the range and three defined-risk ways to trade it.
Published Sunday, October 4, 2026 · Data as of Friday, October 2, 2026 close
Explore the live SOFI options data in the Detailed Options Analyzer →
Quick answer
| Item | Answer |
|---|---|
| Market bias | Neutral |
| Options-implied range (into October 9) | $14.91 – $16.63 (±$0.86, ±5.43%) |
| Major support | $16.00 is the October 9 put wall, but spot ($15.77) has slipped just under it, so it is now a level to reclaim. Below spot: $15.65 swing support, then $15.00, the heaviest put strike across the whole chain. |
| Major resistance | $17.50 (October 9 call wall). The first hurdle is $16.50 (max pain and swing resistance). |
| Max pain (October 9) | $16.50 |
| Dealer gamma regime (estimate) | Positive: hedging tends to dampen moves into October 9. Flip level ≈ $25, far above spot and of little practical use this week. |
| Volatility condition | Rising. IV rank 21.88/100. Premium is rich: options are priced ~25 vol pts above delivered movement. |
| Technical check | Mixed. The chart model is bearish: 3-day target $15.58 (range $15.30–$16.02) and 5-day target $15.50 (range $15.10–$16.00). Both targets sit inside the implied range. |
| Best-fitting strategy | Iron condor (October 9 $14.50/$15/$16.50/$17), conditional on $15 holding |
| Analysis invalidated if | SOFI closes below $14.88 |
1 · What matters today
SOFI closed at $15.77 on Friday. The options market is pricing a move of about $0.86 either way by October 9, which gives a range of $14.91 to $16.63. Our read is neutral.
Short-dated options flow is clearly tilted toward calls. The stock itself is not: it is down about 5% in a week and about 15% in a month. In this stock's recent history, that kind of call-heavy flow has looked more like bargain-hunting into a downtrend than a reliable turn.
Options are also unusually expensive compared with how little SOFI has actually been moving. That favors collecting premium over buying it.
The level that changes the picture is $14.88, the 52-week low. A close below it breaks the range thesis.
The chart model leans bearish, with targets near $15.50–$15.58, which is still inside the options-implied range.
2 · What the options market is pricing
What changed this week
Price fell. SOFI lost 4.89% over the past five sessions and 14.80% over the past 20. Friday opened with a 1.86% gap up to $16.14, but the stock gave all of it back and finished at $15.77. The trend reads agree with the tape: bearish over the past week and the past month, and roughly flat over the past two and a half months.
Options got more expensive while the stock fell. ATM implied volatility rose 19.2% over five sessions, even though it dipped 3.7% on Friday. IV rank averaged about 10 over the past 14 sessions and about 16 over the past 7, and now stands at 21.88.
Flow tilted further toward calls.
- Friday's put/call volume ratio was 0.37, meaning about 37 puts traded for every 100 calls. The 7-day average is 0.46 and the 14-day average is 0.49.
- The put/call open-interest ratio (open interest = contracts currently held open) eased to 0.57 from a 7-day average of 0.59.
- The biggest live open-interest build was in the October 23 $17 calls, which added 5,600 contracts to 9,242.
- The October 16 $15 puts added 4,577 contracts to 21,426, a sizable floor of protection.
- Into Friday's expiration, the October 2 $17 puts shed 10,770 contracts of open interest. That position is settled history now.
Expected move
The expected move is the move the options market is pricing in, derived from what straddles cost. For the October 9 expiration it is ±$0.86, or ±5.43%, around $15.77. Here is the ladder:
| Expiration | Implied move | Range around $15.77 |
|---|---|---|
| October 9 | ±5.43% | $14.91 – $16.63 |
| October 16 | ±7.99% | $14.51 – $17.03 |
| October 23 | ±9.88% | $14.21 – $17.33 |
| October 30 | ±14.91% | $13.42 – $18.12 |
The first three rungs widen at a normal pace. October 30 jumps sharply, because its at-the-money options carry roughly 54% implied volatility versus about 41% a week earlier. The cheap part of the curve is the near weeklies.
Volatility
Implied volatility (IV) is the market's estimate of how much SOFI will move, baked into option prices.
- Level: the headline ATM IV is 53.91%. The October 9 contracts themselves are priced lower, at about 39%. The headline figure blends in the richer late-October expirations.
- IV rank: 21.88/100. IV rank shows where today's IV sits versus the past year, so 21.88 means cheaper than roughly 78% of the past year's readings.
- Direction: IV is above its 30-day average (48.7%) but below its 90-day average (55.5%), and up 11.7% over 30 sessions.
- Term structure: the front-month read is unavailable today because Friday was an expiry day.
Some readings stand out against this stock's own recent history. "Unusually" here means unusual for SOFI, not versus the broader market:
- Realized volatility is running well below its norm. SOFI's 20-day realized volatility is just 28.7%, against 44.3% over 30 days.
- The pace of IV expansion is unusually strong for this name.
Premium: rich. The volatility risk premium is the gap between how much movement options are priced for and how much SOFI has actually delivered. When it's positive, option sellers have been collecting more than realized movement cost them.
Today that gap is about 25 vol points. It is richer than about 92% of this stock's own recent readings, and the gap reading itself is stretched well above its norm.
The gap flipped from about 6 points negative in mid-September to positive around September 22. That happened because IV climbed while daily swings quieted. No earnings gap is involved in that window.
The combination of IV rank 21.88 and a 92nd-percentile premium favors collecting premium this week. One caveat: the October 9 contracts carry about 39% IV, so this week's cushion over delivered movement is closer to 10 points than 25.
Skew and sentiment
Skew. Puts and calls the same distance from the stock price don't always cost the same; when puts are pricier, traders are paying up for crash protection.
- SOFI's 25-delta puts (54.3%) and calls (54.7%) are almost even. Calls are about 0.5 vol points richer, which matches the 60-day norm of roughly 0.5 points.
- Skew was flatter last week, near 1.5 points in calls' favor on average. It steepened about 1.8 points over five sessions, so some put demand crept back in as the stock slid.
Sentiment by expiration. Short-dated sentiment is decidedly call-side:
- The 0–7 day expirations score +48 against a 7-day average of +31.
- The 7–30 day bucket scores +34, in line with its +35 average.
- Every expiration group leans bullish.
- Call-heavy volume is unusually pronounced for this name.
Put plainly, traders are buying calls into a falling stock. Given SOFI's track record, we read that as bottom-fishing rather than confirmation.
The key levels map
| Level | Price | Why it matters |
|---|---|---|
| Call wall (whole chain) | $20.00 | Heaviest call open interest across all expirations. Far outside this window. |
| 200-day moving average | $18.94 | Long-term trend line, 16.75% above price. |
| Swing resistance | $17.96 / $17.64 | Prior pivot highs. |
| Call wall (October 9) | $17.50 | Biggest pile of open calls (22,719) for this expiration. Walls like this often act as magnets or barriers. |
| 50-day moving average | $17.45 | Sits just under the call wall. |
| Swing resistance / 20-day moving average | $16.86 / $16.83 | First trend-based ceiling. |
| Implied high (October 9) | $16.63 | Top of the options-implied range. |
| Max pain (October 9) / swing resistance | $16.50 | Price where the most option value would expire worthless. Expirations sometimes gravitate toward it. |
| Put wall (October 9) / largest-gamma strike | $16.00 | Heaviest put open interest for October 9. Spot is just below it. The chart model also caps rallies here. |
| Spot | $15.77 | Friday's close. |
| Swing support | $15.65 | Nearest pivot low. |
| Chart-model support | $15.50 | Breakdown trigger area in the technical reports. |
| Put wall (whole chain) / gamma strike | $15.00 | Largest put stack across expirations (152,383 contracts). |
| Implied low (October 9) | $14.91 | Bottom of the options-implied range. |
| 52-week low | $14.88 | Our invalidation line. |
| Gamma flip (estimate) | ≈ $25 | Rough model output, far from price. Not a working level this week. |
Positioning and unusual flow
Dealer gamma. Market makers hedge the options they've sold. In a positive-gamma regime, their hedging tends to dampen moves. One rough estimate puts both the October 9 expiration and the whole chain in positive territory, which argues for a contained week.
Two caveats apply:
- The October 16 expiration's own estimate is negative, so anything held past October 9 loses that cushion.
- The flip estimate sits so far above spot that spot is unusually distant from it for this name. Treat the whole gamma read lightly.
Notable flow (non-expired):
- The October 9 $16 calls traded 19,128 contracts against 7,342 open, about $469,000 of premium. That is a crowd betting on a quick reclaim of the put wall.
- The October 30 $16 calls changed hands 11,638 times, about $1.0 million.
- Far out of the money, the October 23 $21.50 calls traded 6,471 contracts against 1,808 open, the busiest strike among its peers. Those are cheap lottery tickets rather than a measured bet.
3 · Technical check
Both technical reports are bearish, so the read is mixed against our neutral bias.
- 3-day model: targets $15.58 within a $15.30–$16.02 range.
- 5-day model (lands on October 9): targets $15.50 within $15.10–$16.00.
Both ranges sit inside the options-implied $14.91–$16.63 band, so the chart model is calling for a drift lower, not a breakdown. The decisive tells:
- Money flow is deeply negative (Chaikin Money Flow around −0.32), meaning rallies aren't being accumulated.
- The 50-day average sits below the 200-day, a death-cross configuration.
- Both reports flag a bearish pennant, with invalidation on a close above $16.00.
That $16.00 is the same October 9 put wall the options data highlights. That overlap is the most useful confluence in this setup.
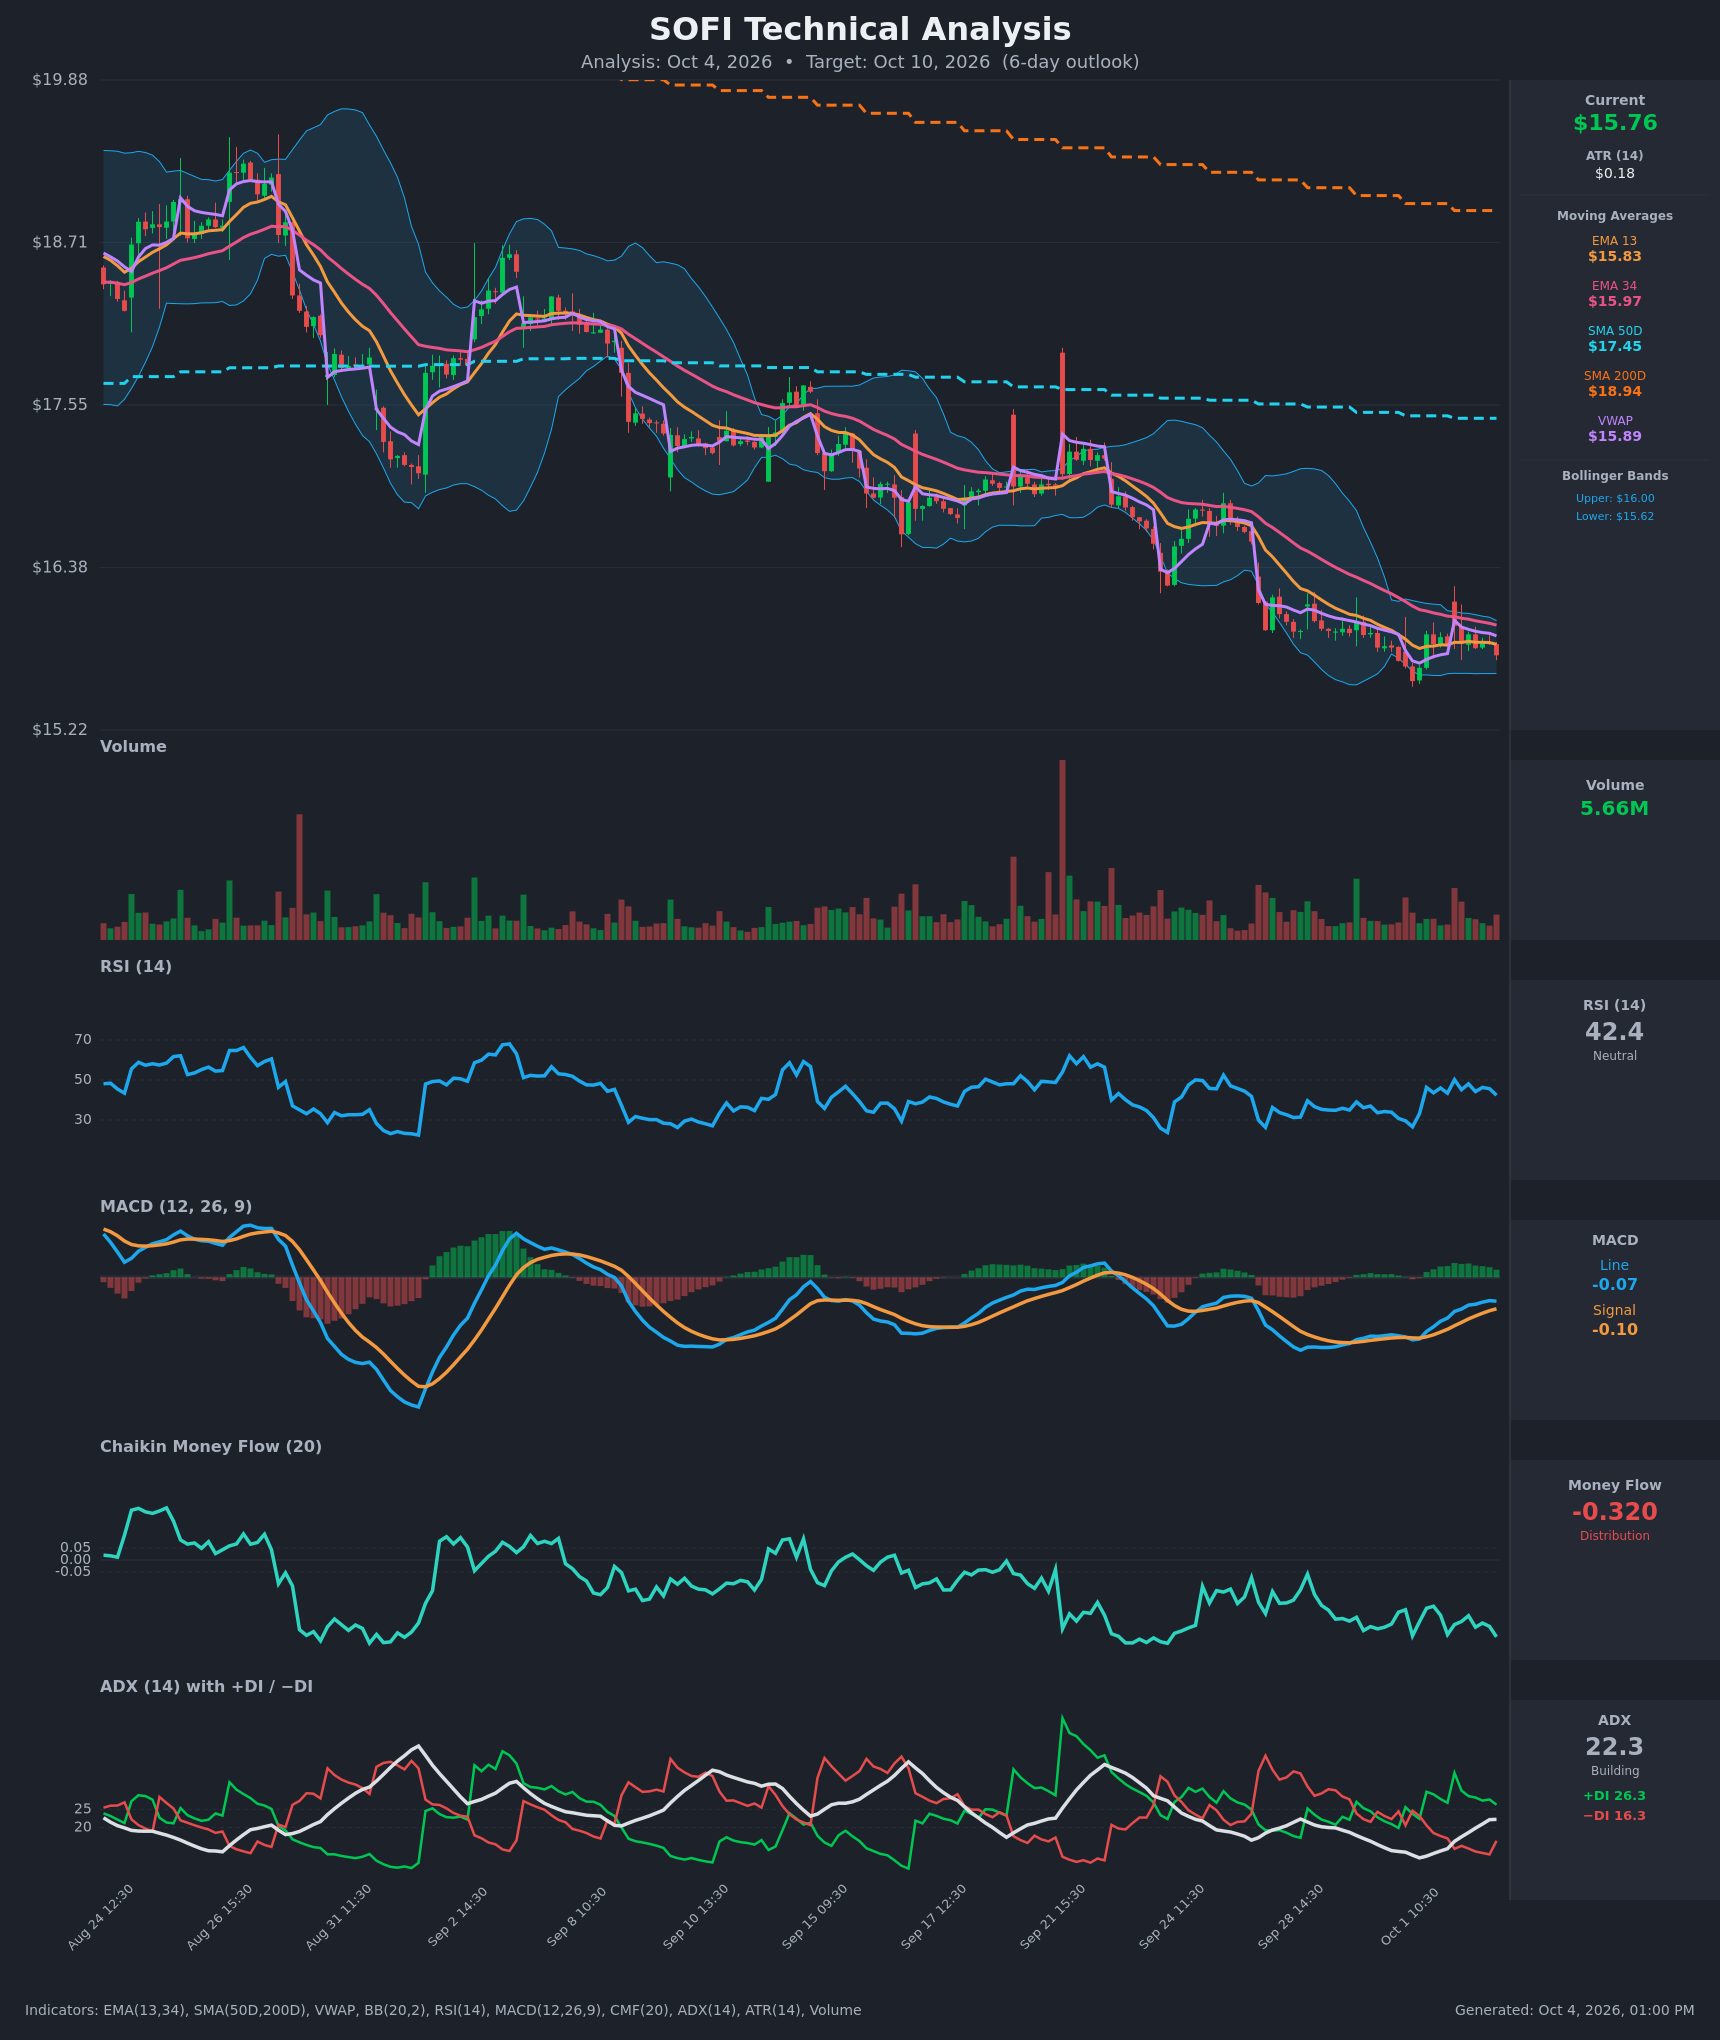
Model vs. Market: The options market implies $14.91–$16.63 into October 9. The 3-day technical model targets $15.58, and the 5-day targets $15.50. A drift to $15.50 would leave option sellers who stay above $15 untouched; only a break below about $15.10 starts to separate the two views.
The TA shaded our strike selection. Put-side short strikes sit at $15 or higher, below the model's 3-day range, and call-side shorts sit at or above its $16.00 resistance.
Full technical write-ups: 3-day report → · 5-day report →
4 · Three ways the next five days can go
If SOFI pushes above the call wall ($17.50): That would take roughly an 11% rally, well outside the implied range. The 50-day average at $17.45 and swing resistance at $17.64 cluster there. Above it, open interest thins until the whole-chain call wall at $20.00.
If SOFI drifts between $15 and $16.50: This is the pin case. With an estimated positive-gamma regime, dealer hedging tends to lean against moves. Max pain at $16.50 exerts a mild upward pull into October 9. The $16.00 put wall becomes the line price has to reclaim for that pull to matter. This is the case the credit structures below are built for.
If SOFI breaks below $15.00: Losing the whole-chain put wall would put the 52-week low ($14.88) and the implied low ($14.91) in play within pennies. The October 16 expiration's negative-gamma estimate means hedging flows offer less cushion if weakness carries into the following week. A close below $14.88 ends the range thesis.
5 · Three defined-risk structures
Prices are end-of-day midpoints as of October 2, 2026. All structures are hypothetical. Verify live prices before trading; these will be stale by the open.
Because premium is rich against delivered movement, credit structures lead. A credit spread means you collect premium up front and are betting price stays on the right side of your short strike.
If you expect the range to hold: iron condor
- Trade: October 9 iron condor. Sell the $15 put and buy the $14.50 put. Sell the $16.50 call and buy the $17 call.
- Credit: $0.11 ($11). Max profit: $11. Max loss: $39. Break-evens: $14.89 / $16.61.
- Why it fits: Premium sits about 25 vol points over delivered movement, in the 92nd percentile for SOFI. The short call is at max pain. The short put rests on the whole-chain put wall, below both chart-model ranges. The break-evens nearly match the implied range.
- Makes sense only if: you accept a small credit against a larger max loss in exchange for a high-probability, positive-gamma week.
- Invalidated if: SOFI closes below $14.88 or above $16.61.
- Managing it: Close at about 50% of the credit. Close the threatened side if price closes through $15 or $16.50 rather than hoping. Exit no later than the afternoon before expiration.
- Liquidity note: Every leg is a penny wide: $15 puts $0.07/$0.08, $14.50 puts $0.02/$0.03, $16.50 calls $0.11/$0.12, $17 calls $0.05/$0.06. As a percentage of these tiny prices, though, slippage can eat a third of the credit. Work a limit at mid.
- Analyze this position →
If you lean bullish: bull put spread
- Trade: Sell the October 9 $15.50 put and buy the $15 put.
- Credit: $0.13 ($13). Max profit: $13. Max loss: $37. Break-even: $15.37.
- Why it fits: Short-dated flow is heavily call-tilted, and max pain sits above at $16.50. The short strike is at the chart model's $15.50 support, with $15.65 swing support just above it.
- Makes sense only if: $15.65–$15.50 holds through the 3-day checkpoint (October 7).
- Invalidated if: SOFI closes below $15.50.
- Managing it: The past week and month both point down, so take profits early, around 50% of the credit. Close on any close below $15.50.
- Liquidity note: The $15.50 puts traded $0.20/$0.21 (4.9% wide). The $15 puts are a penny wide.
- Analyze this position →
If you lean bearish: bear call spread
- Trade: Sell the October 9 $16 call and buy the $16.50 call.
- Credit: $0.13 ($13). Max profit: $13. Max loss: $37. Break-even: $16.13.
- Why it fits: $16.00 is both the October 9 put wall (now overhead) and the chart model's invalidation line. Money flow is negative, and the trend is down over the past week and month. Collecting rich premium lets you be bearish without paying for it.
- Makes sense only if: rallies keep failing below $16.00.
- Invalidated if: SOFI closes above $16.13.
- Managing it: Close at about 50% of the credit. If the October 9 $16 call buyers get their reclaim and price closes above $16.00, cut rather than wait.
- Liquidity note: The $16 calls traded $0.24/$0.25 (4.1% wide). The $16.50 calls traded $0.11/$0.12 (8.7%), so expect some slippage.
- Analyze this position →
If none of these: no trade
Rich premium is a good argument for selling. Standing aside is still reasonable this week, for three reasons:
- The credits on offer are $0.11–$0.13 per spread. Penny-wide legs can shave a meaningful slice off that before you start.
- Most of the 25-point premium lives in the late-October expirations. This week's contracts carry a much thinner cushion.
- The stock is sitting about 6% above its 52-week low in a confirmed short-term downtrend.
If you can't watch the position daily, or a $37–$39 loss per spread against a $11–$13 gain doesn't sit right, flat is a legitimate position.
6 · Quick FAQ
What is SOFI's expected move this week? About ±$0.86 (±5.43%) into October 9, a $14.91–$16.63 range, based on straddle pricing as of October 2.
Is SOFI expected to go up or down over the next week? Options positioning as of October 2 reads neutral. Short-dated flow favors calls, but the price trend and the chart model lean lower. That's a read of what traders have done, not a forecast. The actionable map is the $14.91–$16.63 range, with $16.00 overhead and $15.00 below.
Are SOFI options expensive right now? Both lenses matter here:
- IV rank of 21.88/100 says option prices are lower than about 78% of the past year's readings.
- They're also running about 25 vol points above the movement SOFI has actually delivered, richer than 92% of this stock's recent readings.
Cheap versus last year, rich versus reality: that combination favors selling defined-risk premium.
Where is SOFI's biggest options support and resistance? For October 9, the call wall is $17.50 and the put wall is $16.00, which spot has slipped just under. Across the whole chain, the heaviest put strike is $15.00 and the heaviest call strike is $20.00.
What invalidates this week's read? A close below $14.88, the 52-week low.
Methodology & disclosures. Data: end-of-day options-chain snapshot for SOFI, 2026-10-02, generated 2026-10-04T12:59:56.882Z. Prices shown are midpoints and will differ from live markets. Momentum/positioning scores and volatility-premium comparisons are descriptive measurements of past option flow and past price movement — not investment advice, signals, forecasts, or guarantees. All trade structures are hypothetical. Every structure shown has a defined maximum loss; you can lose the entire max-loss amount. Options involve substantial risk and are not suitable for all investors.