SOFI Options Are Pricing a ±$1.03 Move Into September 18 — And Positioning Leans Higher
SOFI closed at $17.32 after a 6.4% five-day slide, but the options chain is quietly building on the call side: the September 18 expiration prices a $16.29–$18.35 range, with the put wall at $17.00 and max pain at $18.00. Here's what the flow says and three defined-risk ways to trade it.

The options market implies a $16.29–$18.35 range into the September 18 expiration; here's what's driving it and three defined-risk ways to trade the next four days.
Published Sunday, September 13, 2026 · Data as of Friday, September 11, 2026 close
Explore the live SOFI options data in the Detailed Options Analyzer →
Quick answer
| Item | Answer |
|---|---|
| Market bias | Bullish |
| Spot (Friday, September 11 close) | $17.32 |
| Options-implied range (into September 18) | $16.29 – $18.35 (±5.93%, or ±$1.03) |
| Major support | $17.00 (September 18 put wall) |
| Major resistance | $22.00 (September 18 call wall) |
| Max pain (September 18) | $18.00 |
| Dealer gamma regime (estimate) | Negative for the September 18 expiration — hedging tends to amplify moves; flip level ≈ $22 (the all-expiration estimate reads positive, so the two disagree) |
| Volatility condition | Falling — IV rank 4.75/100 · premium thin: options priced about 7 vol points below delivered movement |
| Technical check | Confirms (bullish, both the 2-day and 4-day chart models) |
| Best-fitting strategy | September 18 $17.50/$18.50 call debit spread |
| Analysis invalidated if | SOFI closes below $17.00 |
1 · What matters today
SOFI closed Friday, September 11 at $17.32 after a rough stretch — down 6.4% over five sessions and 5.9% over the past month. The options chain is telling a different story than the tape. Our read of options flow, which blends positioning, momentum, sentiment across expirations, skew and where price sits between the big open-interest strikes, lands firmly on the bullish side of neutral, driven almost entirely by call-side building: call open interest grew by more than 31,000 contracts on Friday against roughly 1,300 on the put side, and 25-delta calls now cost more than equivalent puts — unusual for this name.
The options market is pricing a $16.29–$18.35 range into the September 18 expiration. The level that changes everything is $17.00 — the strike holding the heaviest put open interest for that expiration, and the floor this thesis rests on. Both chart models we checked also lean bullish for the same window.
2 · What the options market is pricing
What changed this week
The underlying did the falling; the options did the opposite. Implied volatility — the market's estimate of how much SOFI will move, baked into option prices — sits at 46.1%, down 4.0% on the day, 4.3% over five sessions and 7.7% over the past month, leaving it below its own 30-day average of 48.6% and far under the 90-day average of 56.3%. Options got cheaper while the stock fell 6.4%, which is not the usual pattern.
Flow tilted call-heavy. Put/call volume — how much put activity there is relative to calls, where above 1 means puts dominate — printed 0.40 on Friday against a 7-day average of 0.44 and a 14-day average of 0.42, so traders were buying calls at a faster clip than they have been. Put/call open interest (contracts currently held open) sits at 0.57, barely above its 14-day 0.55 average: for every put held open, there are almost two calls. The single largest change in open interest on a live expiration was the October 16 $19 calls, which added 9,977 contracts to 21,993 — new money reaching well above the current price. Total option volume ran at just 0.78× its 20-day average, so this was a quiet, selective session rather than a stampede. Into Friday's now-settled expiration, 20,491 of the $17.50 calls changed hands on a stock that closed at $17.32 — a final-hour lottery ticket that expired worthless.
One tension worth naming: the short- and long-term trend reads, which blend price with flow, both point down — the past week and the past month were losses. The momentum picture flipped back to a bullish tilt on September 9 for the first time in over a week. So the flow is turning up inside a tape that is still falling, and that argues for short-dated exposure and quick profit-taking rather than patient positioning.
Expected move
Into September 18, the options market is pricing a move of roughly ±$1.03, or ±5.93% — that's the move derived from what at-the-money straddles cost for that date. Around Friday's $17.32 close, that frames a $16.29–$18.35 band.
| Expiration | Implied move | Range around $17.32 |
|---|---|---|
| September 18 (7 DTE) | ±5.93% | $16.29 – $18.35 |
| September 25 (14 DTE) | ±8.63% | $15.83 – $18.81 |
| October 2 (21 DTE) | ±10.78% | $15.45 – $19.19 |
| October 16 (35 DTE) | ±14.56% | $14.80 – $19.84 |
The ladder steps up smoothly with no humps or kinks — each rung roughly tracks the square root of time, which is what you see when there is no single dated event the chain is bracing for.
Volatility
At-the-money implied volatility across the chain is 46.1%, with an IV rank of 4.75/100 — meaning today's IV is cheaper than about 95% of the past year's readings. The September 18 expiration's own at-the-money IV is even lower at 42.8%, which is what produces that ±5.93% figure. IV rank has also been sliding versus its own recent baseline: the 3-day average was 8.8 and the 14-day average 11.3, so option prices are cheap even by this month's depressed standards. The front-month read is unavailable today — Friday was an expiry day, and front-month IV cannot be interpolated from a contract expiring that same session.
The stock itself has been decelerating hard. Realized movement over the last five sessions is running at less than half the pace of the last twenty — an unusually sharp cooling compared against SOFI's own recent history. At the same time, price momentum is unusually weak for this name versus its own norm. Movement is slowing and the direction of the last five sessions was down.
Premium rich or cheap: the gap between how much movement options are priced for and how much SOFI has actually delivered is currently negative by about 7 vol points — at-the-money IV of 46.1% against 20-day realized volatility of 53.2%. In plain terms, option sellers have been collecting less than realized movement cost them. That sits at the 42nd percentile versus this stock's own recent readings, so it is thin-but-not-extreme: middling by SOFI's standards, and clearly not rich. The gap has been drifting further negative all week (it was mildly positive on September 1 before flipping on September 2 and widening every session since). Combine that with an IV rank of 4.75 and the verdict is unambiguous: this is a week to own premium, not sell it. Long-premium, defined-risk structures get first billing below.
Skew and sentiment
Skew — the fact that puts and calls the same distance from the stock price don't cost the same — has inverted here. The 25-delta put trades at 46.5% implied volatility while the 25-delta call trades at 47.8%, a 1.3 vol-point premium for the calls, against a 60-day median of roughly flat (-0.09 vol points). Traders are paying up for upside, not crash protection, and that reading is stretched well above SOFI's own recent norm. Both the call-side build in new open interest and the peer-relative flow (four call contracts cleared the unusual-volume bar against two puts) point the same way.
Sentiment in short-dated options — how the chain is positioned across different expiration dates — reads positive at every tenor: +19 in the 0–7 day bucket, +24 in the 7–30 day bucket, +52 in the 30–60 day bucket and +40 beyond that. The one-phrase summary the data produces is "Bullish Recovery": positioning is building further out the curve while the front end lags. Note the front bucket's +19 is below its 7-day average of 35, so near-dated enthusiasm cooled a bit on Friday even as the longer-dated buckets stayed firm.
The key levels map
| Level | Price | Why it matters |
|---|---|---|
| Call wall (September 18) | $22.00 | 152,980 calls held open — the heaviest call strike for this expiration and for the whole chain (203,803). Also the estimated gamma flip level. |
| 200-day moving average | $19.80 | Price sits 12.5% below it; the long-term trend is still down. |
| Swing resistance | $19.19 | Heuristic pivot cluster from recent price structure. |
| Swing resistance | $18.57 | The last shelf before the August highs. |
| Upper implied rail | $18.35 | Top of the options-implied range into September 18. |
| Call OI shelf | $18.50 | 6,946 contracts open and 8,504 traded Friday — where this week's call buying clustered. |
| 20-day moving average | $18.11 | Price is 4.4% below it. |
| Max pain (September 18) | $18.00 | The price where the most option value would expire worthless; also the single largest total-gamma strike in the chain, with 19,330 calls open. |
| 50-day moving average | $17.83 | Both chart models treat this zone as the upside magnet. |
| Swing resistance | $17.64 | Nearest structural ceiling. |
| Busiest contract | $17.50 | The September 18 $17.50 call traded $333,962 of premium Friday — the most on the board. |
| 100-day moving average | $17.36 | Price is essentially sitting on it (-0.22%). |
| Spot | $17.32 | Friday's close. |
| Swing support | $17.08 | First heuristic support from recent pivots. |
| Put wall (September 18) | $17.00 | 29,647 puts open for this expiration (85,471 chain-wide) and the second-largest gamma strike — the floor this read depends on. |
| Swing support | $16.82 | Next pivot below the wall. |
| Lower implied rail | $16.29 | Bottom of the options-implied range into September 18. |
| 52-week low | $14.88 | Price sits 16.4% above it; the 52-week range position is 13.7/100. |
The aggregate walls and the September 18 expiration's own walls agree on both strikes — $22.00 above and $17.00 below — which is not always the case and adds weight to both levels.
Positioning and unusual flow
Market makers hedge the options they've sold, and the direction of that hedging depends on their net position. One rough estimate for the September 18 expiration alone puts dealers in negative gamma, meaning hedging flows would tend to amplify moves rather than cushion them. The same estimate across all expirations combined reads positive — so the two disagree, and for a four-day trade the expiration-specific read is the relevant one. Treat both as estimates built on an assumed dealer convention, not observed inventory. Spot also sits about 27% below the estimated flip level of $22, which is unusually far below for this name versus its own history.
Three live flow items stood out Friday. The September 18 $17.50 calls traded 9,969 contracts against 4,676 open — turning over more than twice the existing position, for $333,962 of premium. The September 18 $18.00 calls traded 15,727 contracts for $275,223, adding 1,851 to open interest. And the September 18 $18.50 calls turned over 8,504 against 6,946 open, adding 1,287. All three are upside strikes inside or just above the implied range. On the put side, the biggest live change was the $22.00 puts shedding 9,869 contracts — deep in-the-money protection being unwound.
3 · Technical check
Both chart models point the same direction as the options read. The 2-day model (target date September 16) is bullish with a target of $17.48 and a projected range of $17.10 to $17.58, flagging a fresh short-term EMA crossover, a +DI/−DI flip and a MACD histogram turning up, with support at $17.20 and resistance at $17.40. Its dominant scenario is invalidated on a close below $17.20.
The 4-day model (target date September 18, matching our expiration) is also bullish: target $17.58, projected range $16.95 to $17.80, support $17.05 and resistance $17.55. It reads a positive RSI divergence off oversold, a MACD crossover, and a −DI-led trend that is losing strength — while explicitly noting price remains below the 50-day ($17.83) and 200-day ($19.80) averages and money flow is still mildly negative. Its dominant scenario invalidates on a close below $17.05.
Both targets sit comfortably inside the options-implied range, and both directions match the positioning read, so this confirms. What it does not do is extend: the chart models see a far smaller move than the options chain is pricing.
Model vs. Market: The options market implies $16.29–$18.35 into September 18; the 4-day technical model projects $16.95–$17.80 with a $17.58 target. The chart model expects a grind, the options chain is paying for a jump — which is exactly why the structures below sell the far rails rather than buy them outright.
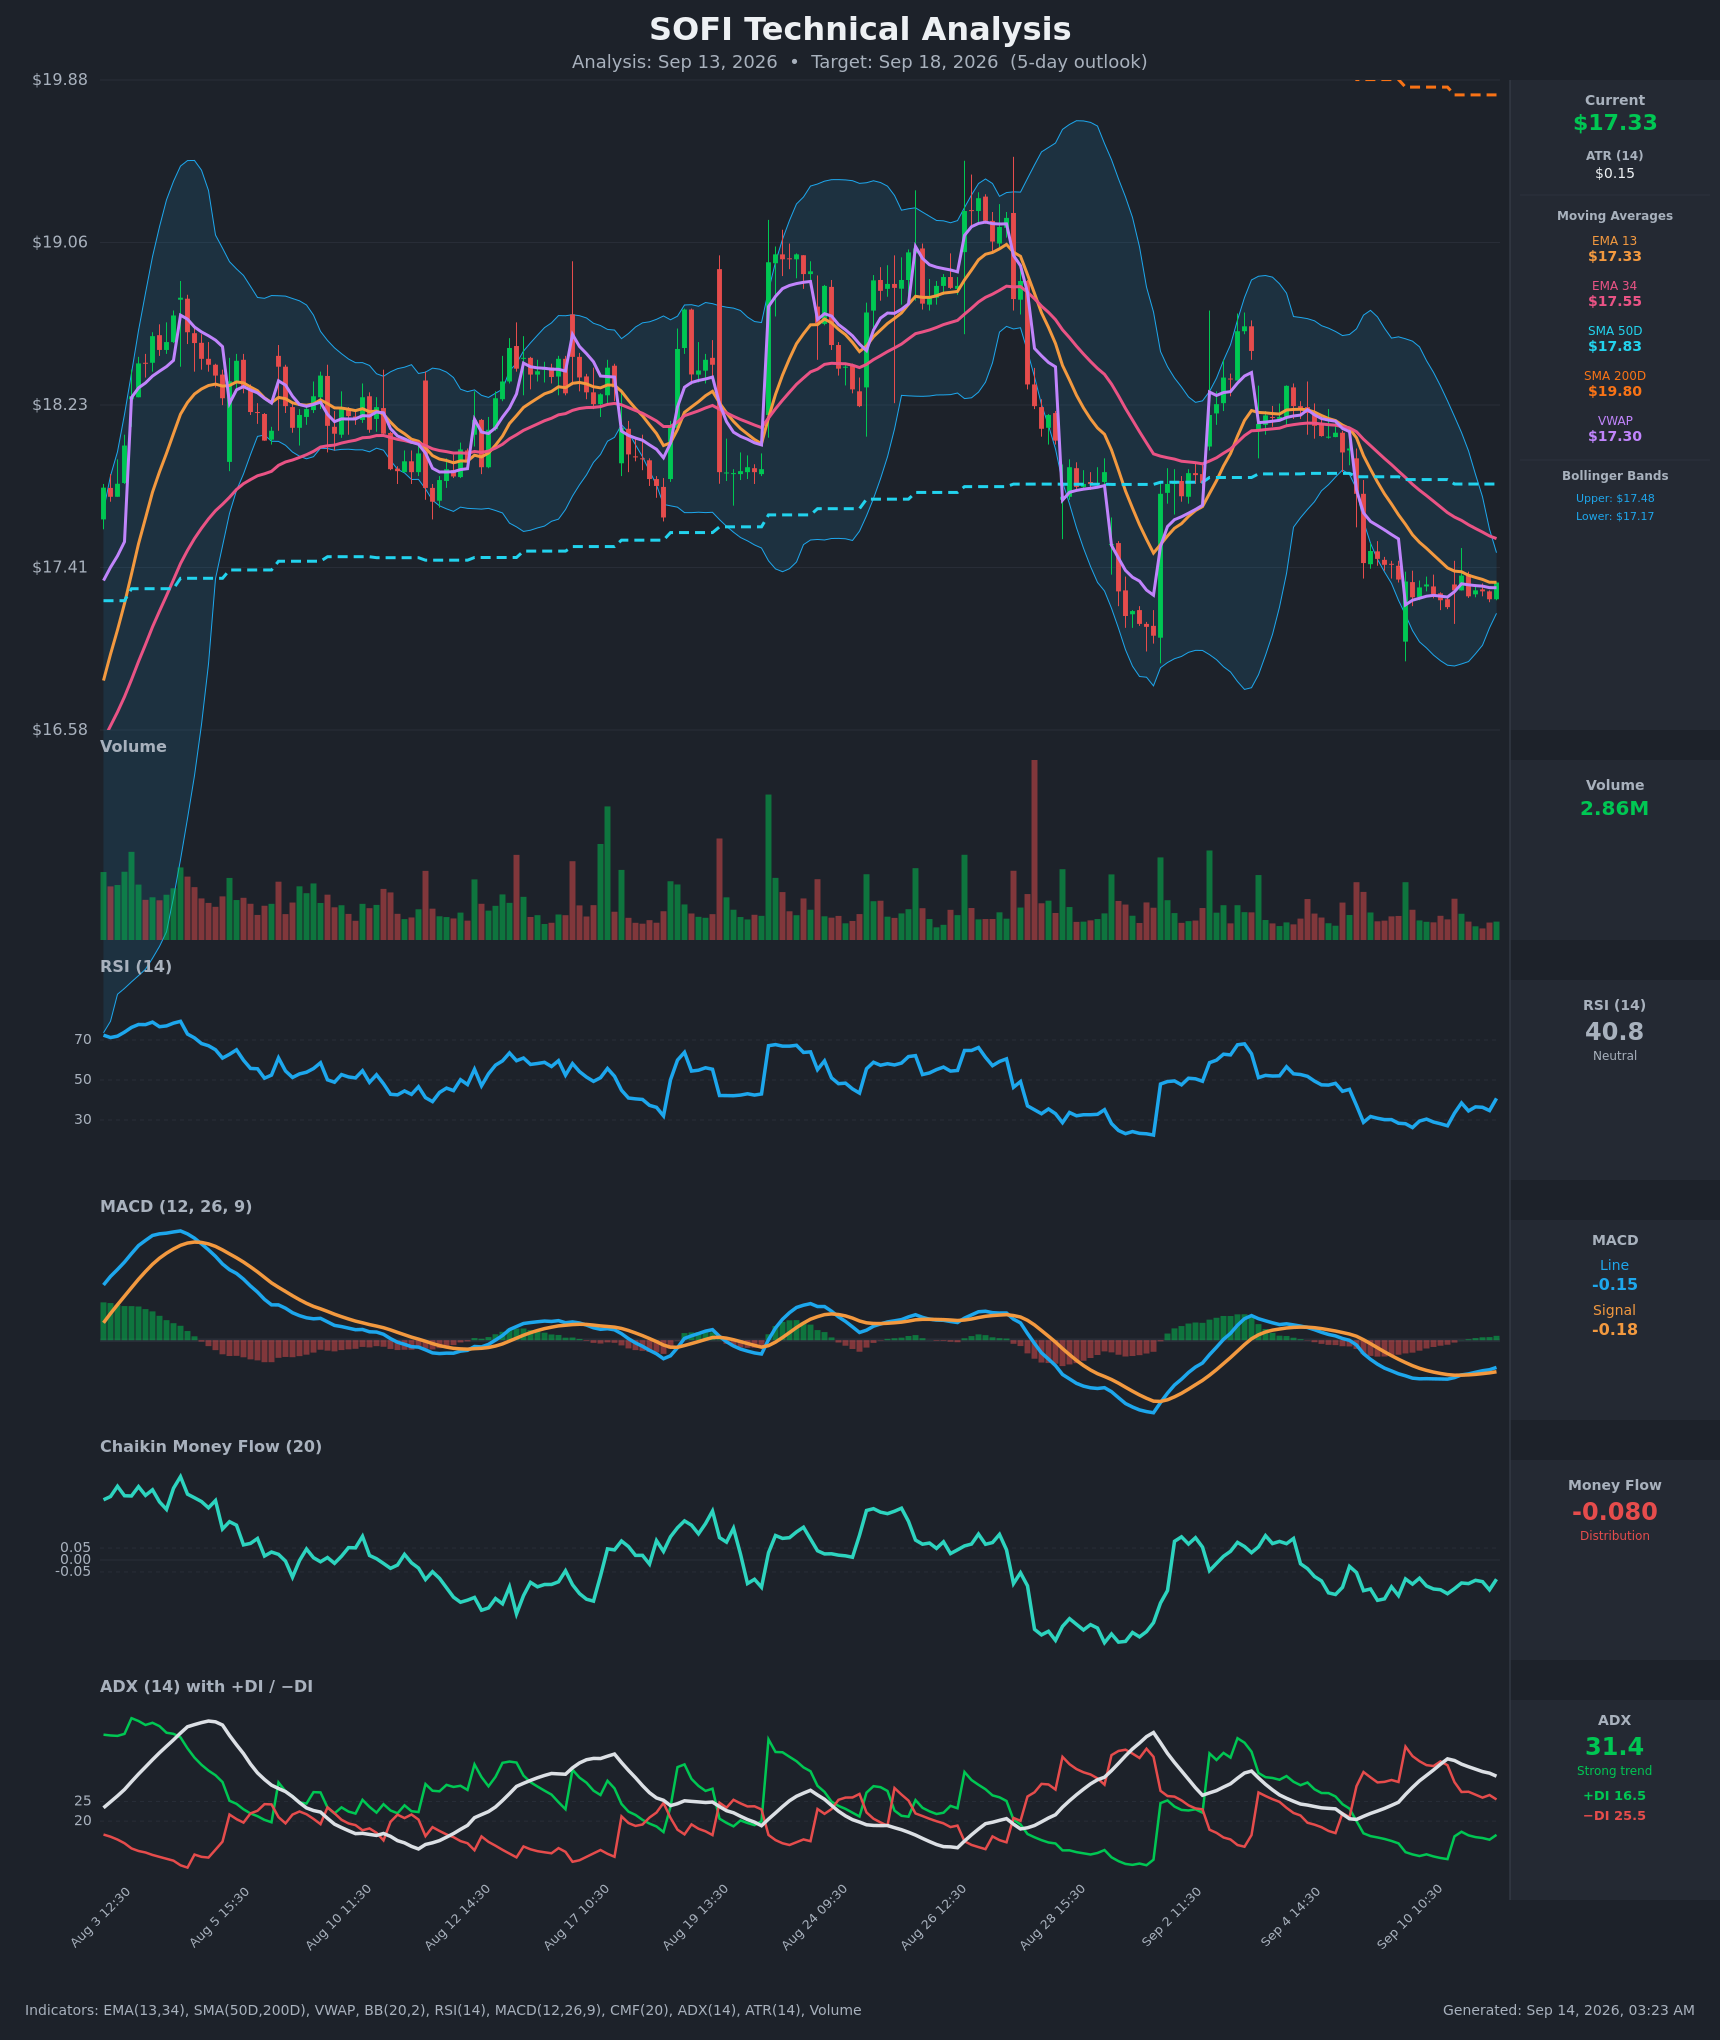
The practical effect on strike selection: the TA resistance at $17.55 and the 50-day at $17.83 argue for placing the long leg of a bullish debit spread at $17.50 rather than reaching higher, and the $17.05 TA invalidation lines up neatly with the $17.00 put wall.
Full technical write-ups: 2-day report → · 4-day report →
4 · Three ways the next four days can go
If SOFI pushes toward the upside strikes ($18.00–$18.50): the $22.00 call wall is 27% away and irrelevant on a four-day view, so the real overhead is the open-interest shelf at $18.00 (19,330 calls) and $18.50 (6,946 calls) — precisely where Friday's buying clustered. Heavy call open interest overhead tends to slow rallies as the sellers of those calls hedge into strength. A clean push through $18.50 leaves thinner positioning until $19.00.
If SOFI drifts between $17.00 and $18.00: this is the base case the chain is built for. Max pain for September 18 sits at $18.00 and the two largest total-gamma strikes in the whole chain are $18.00 and $17.00 — expirations sometimes gravitate toward the strike where the most option value expires worthless, and that pull tends to strengthen into the final two sessions. The 2-day chart model's own middle scenario is a chop between roughly $17.15 and $17.45.
If SOFI breaks below the put wall ($17.00): that strike holds 29,647 puts for this expiration and 85,471 chain-wide; losing it removes the biggest single block of downside positioning from underneath. The September 18 expiration's own dealer gamma estimate reads negative, which means hedging would tend to accelerate rather than cushion a slide, and spot is already sitting unusually far below the estimated flip level for this name. Next references below: $16.82, then the lower implied rail at $16.29.
5 · Three defined-risk structures
Prices are end-of-day midpoints as of Friday, September 11. All structures are hypothetical. Verify live prices before trading — these will be stale by the open.
If you lean bullish (the featured structure): call debit spread
- Trade: Buy the September 18 $17.50 call, sell the September 18 $18.50 call.
- Debit: $0.25 ($0.335 paid, $0.085 collected) · Max profit: $0.75 per share ($75 per spread) · Max loss: $0.25 ($25) · Break-even: $17.75
- Why it fits: with options priced about 7 vol points below what SOFI has actually delivered and an IV rank of 4.75/100, you want to be the buyer of premium, not the seller. The spread's short strike sits at the $18.50 call shelf where Friday's buyers clustered, and its full payout zone starts right at the $18.00 max-pain strike. A debit spread means you pay once, up front, and your entire risk is that payment.
- Makes sense only if: you think the bounce the chart models describe carries into the $17.80–$18.50 zone, and you accept that four days leaves no room for a second attempt.
- Invalidated if: SOFI closes below $17.00.
- Managing it: take profit at roughly 60–70% of the spread's width rather than holding for the last few cents; because the near-term flow is turning up inside a still-falling monthly trend, early profit-taking is the right default. If the position is flat or worse by September 17, close it rather than paying for one more session of hope.
- Liquidity note: the $17.50 calls quoted $0.33/$0.34 (a penny wide, about 3% of mid — easy fills); the $18.50 calls also quoted a penny wide at $0.08/$0.09, but that penny is roughly 12% of mid, so use limit orders on the spread as a whole, not leg by leg.
- Analyze this position →
If you expect the range to hold: iron condor between the wall and max pain
- Trade: Sell the September 18 $17.00 put / buy the $16.50 put, and sell the September 18 $18.00 call / buy the $18.50 call.
- Credit: $0.23 ($0.14 from the put side, $0.09 from the call side) · Max profit: $0.23 ($23) · Max loss: $0.27 ($27) · Break-evens: $16.77 and $18.23
- Why it fits: a credit structure means you collect cash up front and keep it if price stays put. The short strikes are the two most meaningful strikes on the board for this expiration — the $17.00 put wall below and the $18.00 max-pain strike above — and the break-evens sit just inside the options-implied rails. Health warning: you are selling premium that has not been rich lately — the gap between implied and delivered movement is negative, so this trade is a bet on the walls holding, not on premium being expensive.
- Makes sense only if: you expect the chop scenario, and you are comfortable risking slightly more than you can make.
- Invalidated if: SOFI closes outside $17.00–$18.00 — at that point the untested side's credit no longer covers the tested side.
- Managing it: close at roughly 50% of max credit; with only four sessions, exit the whole structure by September 17 rather than carrying expiration-day gamma. If either short strike is breached on a closing basis, close rather than roll — there isn't time to repair.
- Liquidity note: the $17.00 puts traded a penny wide at $0.26/$0.27 (about 4% of mid) and the $18.00 calls a penny wide at $0.17/$0.18 (about 6%); the $16.50 put and $18.50 call wings are cheap enough that the same penny is 8–12% of mid, so expect to give up a cent or two on the wings.
- Analyze this position →
If you lean bearish: put debit spread
- Trade: Buy the September 18 $17.50 put, sell the September 18 $16.50 put.
- Debit: $0.38 ($0.50 paid, $0.125 collected) · Max profit: $0.62 ($62) · Max loss: $0.38 ($38) · Break-even: $17.13
- Why it fits: this is the structure for traders who weight the tape over the flow — price is below its 20-, 50- and 200-day averages, the five-day move was -6.4%, and the September 18 expiration's own dealer gamma estimate suggests hedging would amplify a slide through $17.00. Buying the spread rather than selling a call spread keeps you on the right side of a cheap-premium week.
- Makes sense only if: you expect the $17.00 put wall to fail, which is exactly the scenario our bullish read is built against — position it small.
- Invalidated if: SOFI closes above $17.64.
- Managing it: the long strike is already slightly in the money, so this decays faster than it looks; take profit if price touches $16.80 rather than waiting for the full $16.50 payout, and close by September 17 regardless.
- Liquidity note: the $17.50 puts quoted $0.49/$0.51 (about 4% of mid) and the $16.50 puts $0.12/$0.13 (a penny, but about 8% of mid).
- Analyze this position →
If none of these: no trade
There is a perfectly honest case for standing aside. Four sessions is a short runway, total option volume ran at 0.78× its 20-day average, and the stock's five-day realized movement is less than half its twenty-day pace — a quiet stock in a quiet chain. Premium sellers are being asked to take the wrong side of a negative implied-versus-delivered gap at an IV rank of 4.75, and premium buyers are betting a four-day window is enough for a bounce that the chart models themselves describe as tactical rather than structural. If your edge here is "the flow looks bullish," note that the flow has been leaning bullish for two weeks while price fell 6%. Waiting for a close back above $17.64, or a clean defense of $17.00, costs nothing.
6 · Quick FAQ
What is SOFI's expected move into September 18? About ±$1.03, or ±5.93% — a $16.29 to $18.35 range around Friday's $17.32 close, per the options market's straddle pricing as of September 11.
Is SOFI expected to go up or down over the next four days? Options positioning as of September 11 leans bullish — call open interest is building far faster than put open interest, 25-delta calls cost more than equivalent puts, and sentiment reads positive at every expiration bucket — but that's a read of what traders have done, not a forecast. The actionable map is the $16.29–$18.35 range and the $17.00 / $18.00 levels.
Are SOFI options expensive right now? No. IV rank of 4.75/100 says option prices are lower than about 95% of the past year's readings, and on top of that they're running roughly 7 vol points below the movement SOFI has actually delivered over the past month — thinner than about 58% of this stock's own recent readings. That combination favors owning premium over collecting it.
Where is SOFI's biggest options support and resistance? The put wall is $17.00 and the call wall is $22.00 for the September 18 expiration — and the all-expiration totals agree on both strikes. Max pain for that date is $18.00.
What invalidates this week's read? A close below $17.00.
Methodology & disclosures. Data: end-of-day options-chain snapshot for SOFI, 2026-09-11, generated 2026-09-14T03:23:40Z. Prices shown are midpoints and will differ from live markets. Momentum/positioning scores and volatility-premium comparisons are descriptive measurements of past option flow and past price movement — not investment advice, signals, forecasts, or guarantees. All trade structures are hypothetical. Every structure shown has a defined maximum loss; you can lose the entire max-loss amount. Options involve substantial risk and are not suitable for all investors.