SOFI Options Outlook: Will the $16.50 Put Wall Hold Through September 25?
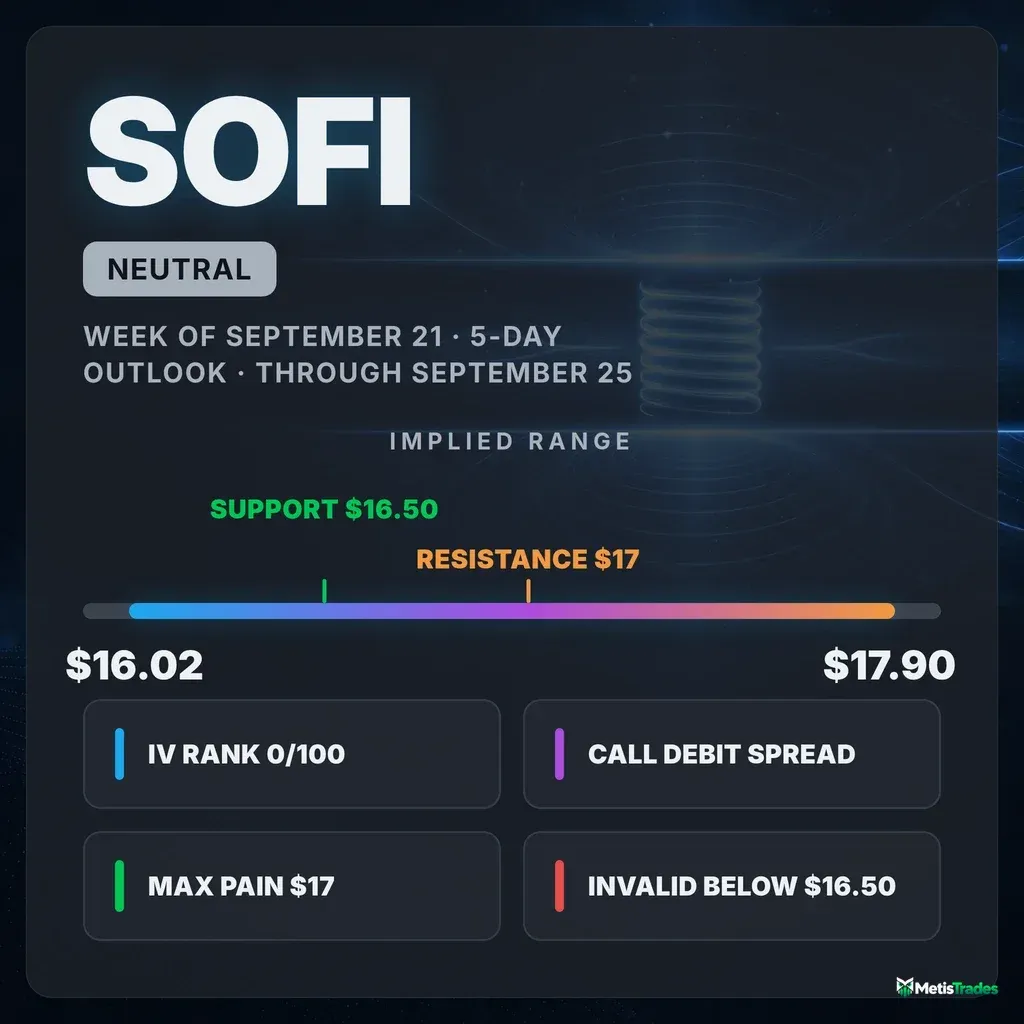
SOFI's options market is pricing a $16.02–$17.90 range into the September 25 expiration, with the heaviest call open interest and max pain both parked at $17.00. Here is what the positioning actually says — and three defined-risk ways to trade a market that refuses to pick a side.
Listen to this analysis — prefer audio? This SOFI outlook is also available as a podcast episode:
The options market implies a $16.02–$17.90 range into the September 25 expiration; here's what's driving it and three defined-risk ways to trade it.
Published Sunday, September 20, 2026 · Data as of Friday, September 18 close
Explore the live SOFI options data in the Detailed Options Analyzer →
Quick answer
| Item | Answer |
|---|---|
| Market bias | Neutral |
| Options-implied range (into Sept 25) | $16.02 – $17.90 (±5.54%, about ±$0.94) |
| Major support | $16.50 (put wall, Sept 25 expiration) |
| Major resistance | $17.00 (call wall, Sept 25 expiration) |
| Max pain (Sept 25) | $17.00 |
| Dealer gamma regime (estimate) | Positive on the whole-chain estimate — hedging tends to dampen moves; flip level ≈ $20, and spot sits well below it |
| Volatility condition | Falling — IV rank 0/100 · premium thin: options priced about 6.7 vol points below delivered movement |
| Technical check | Mixed (neutral at 3 days, bearish at 5 days) |
| Best-fitting strategy | Call debit spread ($17/$17.50, Sept 25) — for traders who want cheap long-premium exposure rather than to sell it |
| Analysis invalidated if | SOFI closes below $16.50 |
1 · What matters today
SOFI closed Friday, September 18 at $16.96, and the options market is pricing a move of roughly $0.94 either way into the September 25 expiration — a $16.02 to $17.90 range, derived from what straddles cost. Our read of the flow lands squarely neutral: leading positioning, momentum, short-dated sentiment and skew are pulling in different directions and roughly cancelling each other out. The two levels that matter are close by. The heaviest pile of open call contracts for that expiration sits at $17.00 — which is also where max pain sits, the price at which the most option value expires worthless — and the heaviest put pile at $16.50. Between those two, expiration weeks tend to grind rather than trend. Implied volatility is at the very bottom of its 52-week range, so options are cheap in absolute terms. The chart models split: neutral at three days, bearish at five. A close below $16.50 is what breaks this read.
2 · What the options market is pricing
What changed this week
The stock did less than the headlines around it: SOFI is down 2.08% over the past five sessions and 5.36% over the past twenty, closing at $16.96 after a snapback from Thursday's low. The bigger change was in price of protection, not direction. At-the-money implied volatility — the market's estimate of how much SOFI will move, baked into option prices — fell to 43.9%, down 4.3% in a single day, 4.8% over five days and 10.0% over thirty, and now sits below both its 30-day average (48.1%) and its 90-day average (56.1%).
Flow tilted modestly put-heavy relative to this name's own habit. Put volume ran at 0.58 contracts for every call — above the 14-day average of 0.48 and the 7-day average of 0.52, though still comfortably call-dominated in absolute terms. Open interest told the opposite story: the put/call open-interest ratio slipped to 0.56 from 0.57 over five days, so puts are being closed, not accumulated. The single biggest build in contracts currently held open was the September 25 $17 call, which added 8,112 contracts to reach 12,262 on 12,505 shares of turnover — traders spent the day building the very wall that now caps this expiration. (Into Friday's settled expiry, the $19 and $20 puts shed 12,149 and 10,264 contracts of open interest respectively; that is closed history, not a live level.)
One note on the bigger picture: the short-, medium- and long-term trend reads all point the same way — down 2.1% over the past week, 5.4% over the past month and 8.9% over roughly two and a half months — so the near-term flow and the broader trend are not fighting each other here. The most recent momentum crossover, on September 14, turned from bullish to bearish, though it was one of the weakest such turns in the record.
Expected move
Into September 25, the options market is pricing a move of about ±$0.94, or ±5.54% — a $16.02 to $17.90 band around Friday's $16.96 close. That number comes from what a straddle (buying the at-the-money call and put together) costs; it's the market's one-standard-deviation guess, not a promise.
| Expiration | Implied move | Range around $16.96 |
|---|---|---|
| Sept 25 (7 days) | ±5.54% | $16.02 – $17.90 |
| Oct 2 (14 days) | ±8.13% | $15.58 – $18.34 |
| Oct 9 (21 days) | ±10.28% | $15.22 – $18.70 |
| Oct 16 (28 days) | ±12.13% | $14.90 – $19.02 |
The ladder steps up smoothly — no kink, no bulge at any single rung, which is what a chain with no scheduled event inside the window looks like. Comparing option prices across expiration dates, the Sept 25 contracts carry a 40.0% at-the-money volatility against 43.8% at Oct 16: the front is the cheapest part of the curve.
Volatility
IV rank is 0/100. That means today's implied volatility is at the very floor of its past-year range — cheaper than 100% of the last year's readings. IV percentile agrees at 0. Direction is down across every window we measure. Front-month interpolated volatility and the term-structure slope are unavailable today (a weekly-expiry-day artifact, not missing data), so we'll leave that comparison alone.
Underneath, actual movement has been decelerating fast. The 5-day-versus-20-day realized volatility ratio sits at 0.66 — well below its own recent norm for this stock, meaning the last week has been noticeably calmer than the month that preceded it. Twenty-day realized volatility is still 50.6%, inflated by the early-September slide; the 10-day figure is 29.3%.
Premium rich or cheap. The volatility risk premium — the gap between how much movement options are priced for and how much SOFI has actually delivered — is running at about negative 6.7 vol points. When that number is positive, option sellers have been collecting more than realized movement cost them; here it's the reverse, and has been for two weeks straight. Against this stock's own recent readings, today's gap is richer than about 38% of them, so it isn't an extreme — just persistently on the cheap side. Combine IV rank 0 with a negative premium over delivered movement and the verdict is straightforward: this is a week to own option premium rather than sell it, and the gap has widened, not closed, over the past five sessions. One caveat that cuts the other way: much of that realized-vol reading comes from the sharp early-September decline sitting inside the 20-day window, while the last ten sessions have been considerably quieter — so the "cheapness" is partly a backward-looking artifact. The next scheduled earnings report is November 9, far outside this window, so none of this premium is event-inflated.
Skew and sentiment
Skew measures whether puts and calls the same distance from the stock price cost the same. Usually they don't — puts are pricier, because traders pay up for crash protection. SOFI is the exception right now: 25-delta puts carry a 44.3% implied volatility against 45.0% for 25-delta calls, so calls are about 0.7 vol points richer than equidistant puts. That's flatter than this name's own 60-day norm of roughly 0.2 vol points call-rich, and it says nobody is paying up for downside insurance here — if anything, the demand is on the upside.
The volume picture is mixed against that. Today's put/call volume ratio of 0.58 is unusually put-tilted compared with this stock's own recent history, even though the raw number still means calls dominate. At the same time, the peer-relative flow reading is the single most extreme observation in the file: six call contracts cleared the 95th-percentile volume bar for their peer group against zero puts, a call-sweep concentration well above the norm for this name.
Sentiment in short-dated options leans mildly positive across the curve: the 0–7 day bucket reads +25, the 7–30 day bucket +12, and the longer 60–120 day bucket +31 — a "bullish recovery" profile where positioning is building further out rather than up front. Note that the front bucket's read is thin today: it's driven entirely by open-interest shifts, with no usable risk-reversal or delta-weighted volume input.
The key levels map
| Level | Price | Why it matters |
|---|---|---|
| 200-day moving average | $19.52 | 13.1% overhead; the long-term trend line is nowhere near in play this week |
| Call wall, whole chain (all expirations) / gamma flip estimate | $20.00 | 251,455 call contracts open — the chain's real ceiling, and the rough flip level where the dealer-hedging estimate changes sign |
| Top of implied range (Sept 25) | $17.90 | One standard deviation up; a close above it would be a 1-in-6 outcome by the market's own math |
| 20-day moving average | $17.84 | Price sits 4.95% below it — the near-term drift is still downhill |
| 50-day moving average | $17.72 | 4.27% overhead; the chart models treat this zone as the upside target on a breakout |
| Swing resistance | $17.64 | Prior pivot cluster from the daily feed |
| Second call shelf (Sept 25) | $17.50 | 8,695 calls open — the next barrier if $17.00 gives way |
| Chart-model resistance | $17.10 / $17.05 | Upper Bollinger band and EMA34 confluence flagged by both technical reports |
| Call wall (Sept 25) · max pain | $17.00 | 12,262 calls open, the heaviest for this expiration, and the max-pain strike; also the largest total gamma strike across the whole chain |
| Spot | $16.96 | Friday's close, four cents under the wall |
| Swing support | $16.86 | Nearest pivot below the market |
| Chart-model support | $16.69 / $16.65 | Lower Bollinger band; the 5-day report's breakdown trigger |
| Put wall (Sept 25) | $16.50 | 11,557 puts open — the floor this expiration is built on, and the level that invalidates this read |
| Swing support | $16.39 | First catch below the put wall |
| Bottom of implied range (Sept 25) | $16.02 | One standard deviation down |
| Put wall, whole chain (all expirations) | $15.00 | 129,114 puts open — the chain's structural floor, far below this week's action |
| 52-week low | $14.88 | Price sits just 13.98% above it; the 52-week range position is 11.7/100 |
Worth flagging plainly: the whole-chain walls ($20.00 call, $15.00 put) and the September 25 expiration's own walls ($17.00 call, $16.50 put) sit in completely different places. The aggregate figures are dominated by far-dated January and December open interest. For this week, the $17.00/$16.50 pair is the map.
Positioning and unusual flow
Market makers hedge the options they've sold, and the direction of that hedging depends on their net position. One rough estimate of that net position for the whole chain reads positive — the regime in which hedging tends to dampen moves rather than amplify them — with a flip level around $20. But spot is sitting roughly 18% below that flip estimate, which under the same rough model is the side where hedging accelerates moves rather than cushioning them. The September 25 expiration's own estimate is technically positive but so close to zero (+143 in raw gamma units against +19,510 for the full chain) that it should be read as "no meaningful pinning force from this expiration alone." Treat all of this as an estimate built on an assumed dealer convention, not observed inventory.
Three flow items stood out on Friday, none of them expired:
- Oct 9 $17.50 calls — 14,605 contracts traded against 5,415 open, $708,341 of premium changing hands. That was the single biggest dollar print in the chain, and it's an upside bet three weeks out, roughly 3% above spot.
- Sept 25 $17 calls — 12,505 traded, open interest up 8,112 to 12,262, $450,179 of premium. This is the flow that built this week's call wall; whether it's buying or selling, the resulting open interest is what sits over the market.
- Oct 2 $16.50 puts — 8,465 traded against 4,625 open, $287,810 of premium. Downside protection being placed exactly at the strike that anchors the near-term floor.
One curiosity: the Sept 25 $14 puts traded 6,829 contracts against 940 open — more than seven times turnover — at a penny each. That's a few thousand dollars buying a very long tail. It's noise in dollar terms, but it tells you somebody wanted cheap disaster insurance rather than the $16.50s.
3 · Technical check
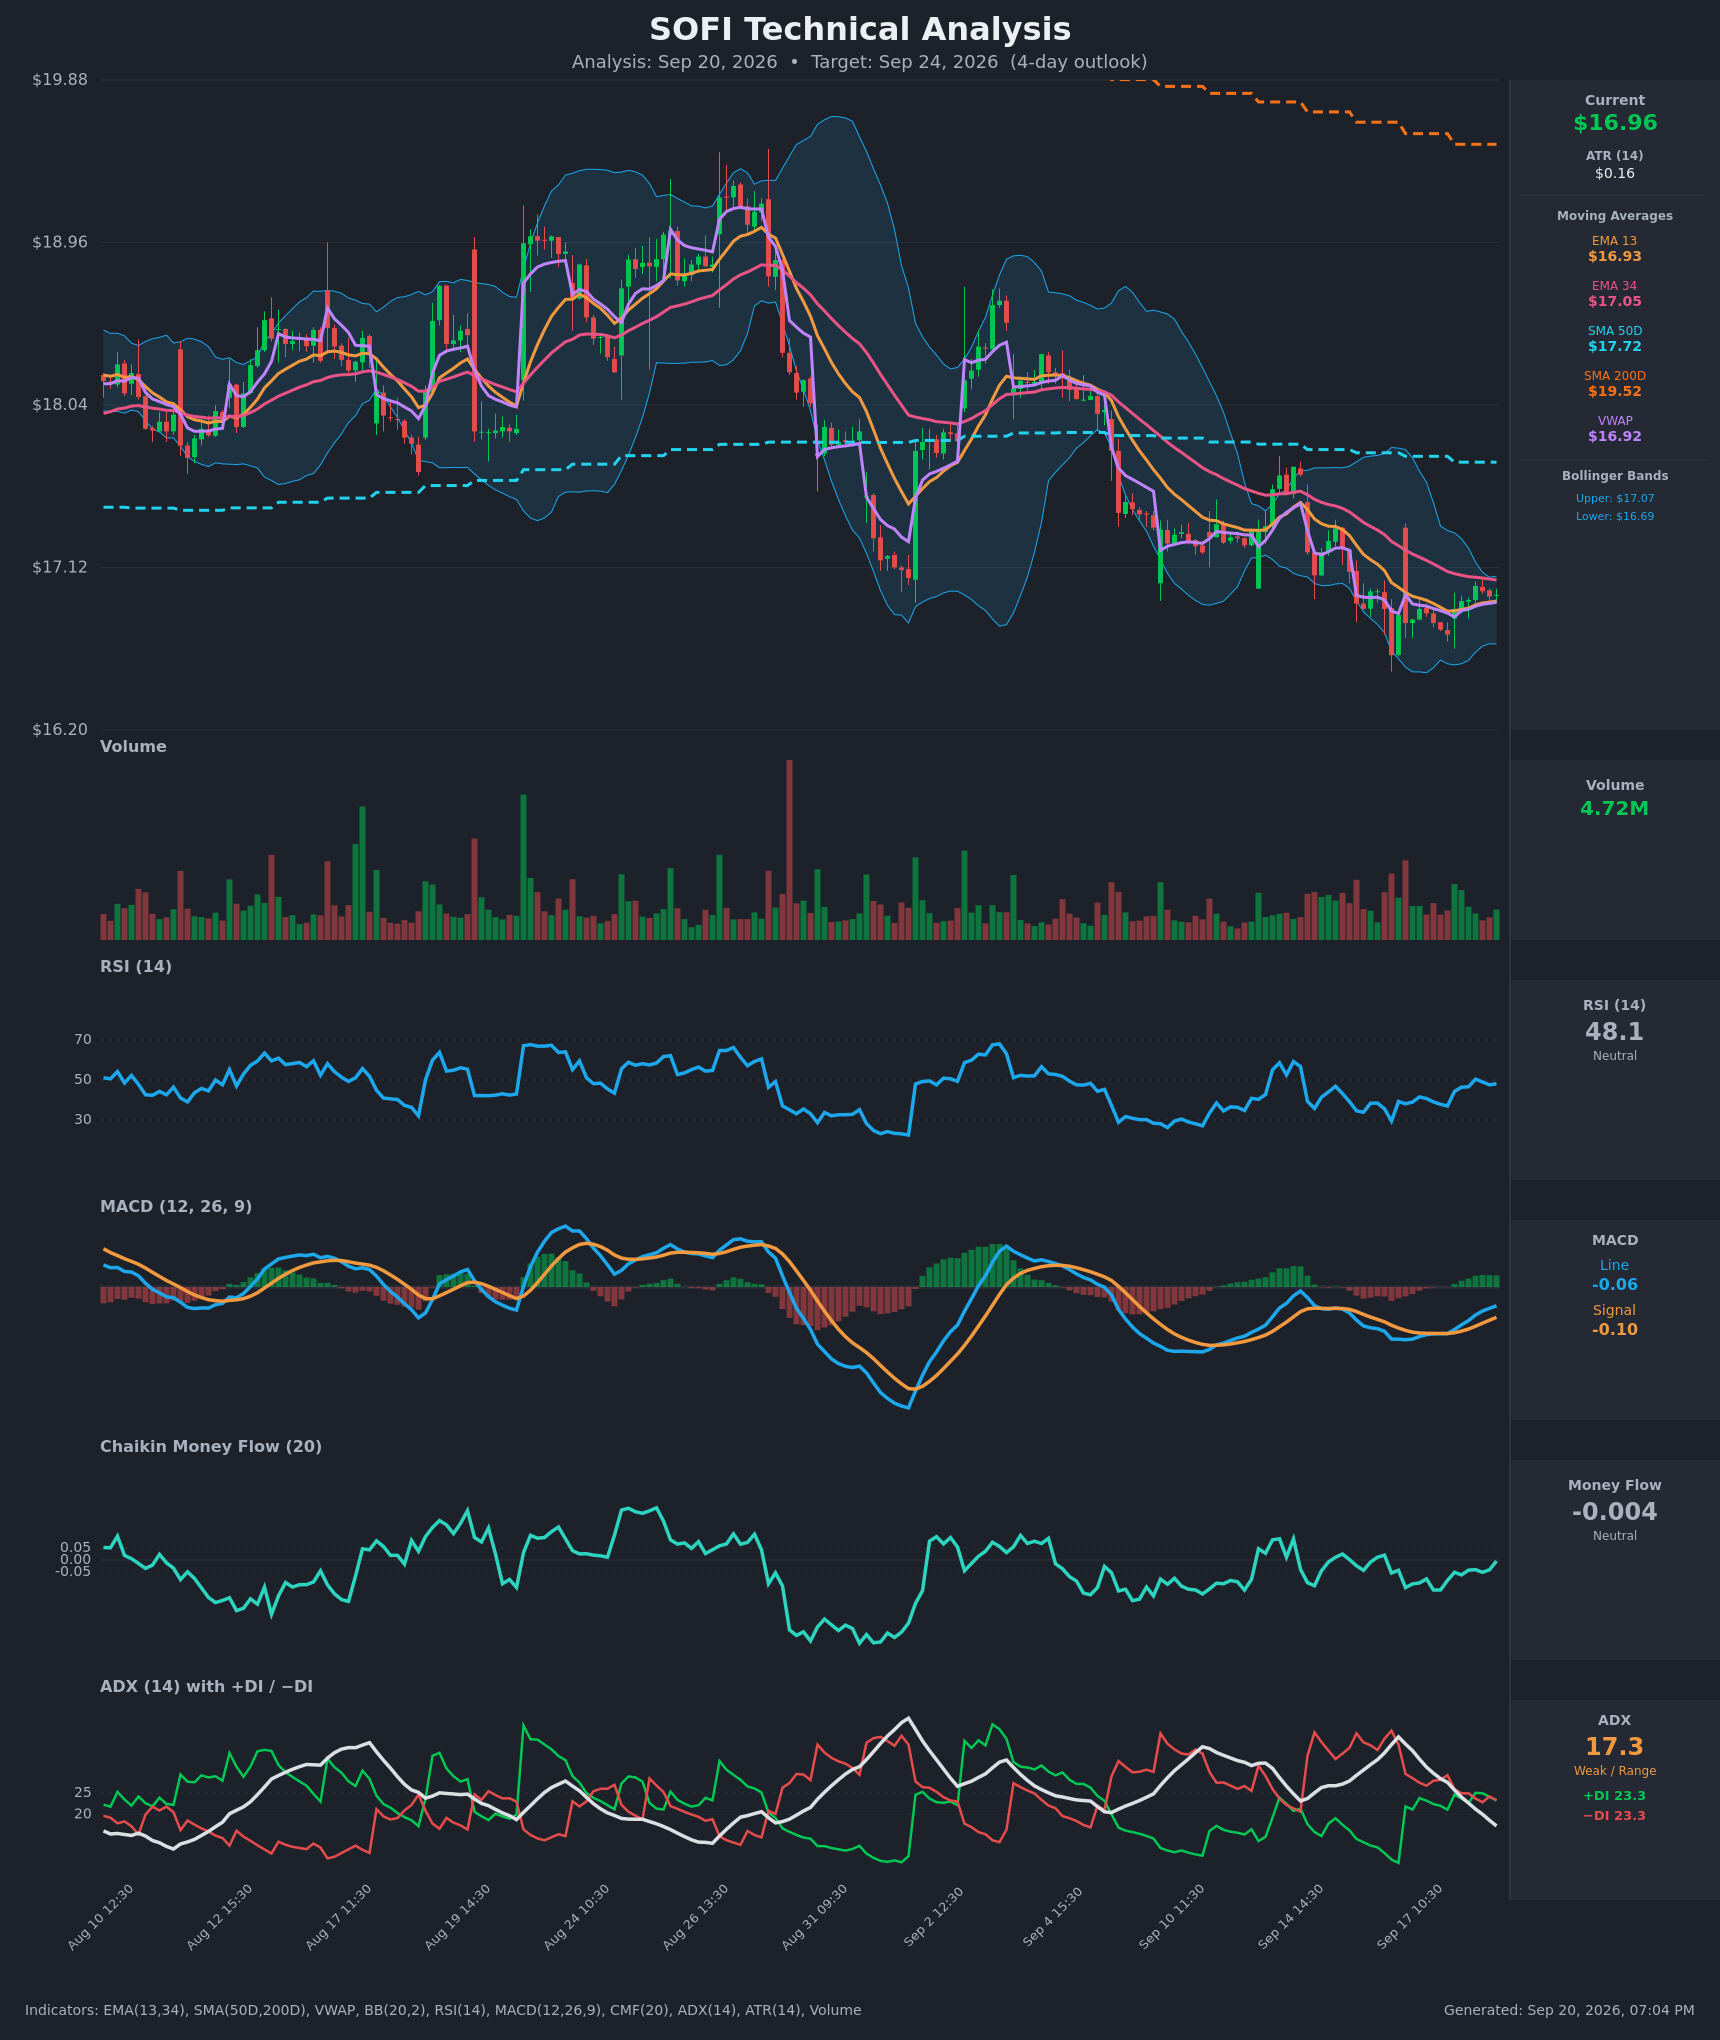
The near-term chart model, run to a September 23 checkpoint, reads neutral: target $16.90, projected range $16.55 to $17.30, with support at $16.65 and resistance at $17.10. Its case is a genuine absence of trend — ADX at 17.3 with +DI and −DI dead level at 23.3, RSI at 48.1, and Bollinger bands compressed to roughly 2% wide. That confirms the options read: a neutral direction with a target comfortably inside the $16.02–$17.90 implied band.
The five-day model, run to September 25 — the same date this article is anchored to — reads bearish: target $16.65, projected range $16.20 to $17.20, support $16.69, resistance $17.05. Its dominant scenario is a breakdown through $16.69 toward $16.30–$16.10, invalidated on a sustained close above $17.20. Direction-wise that diverges from the flat options read, though the target itself still sits inside the implied range. The decisive technical observation on that side is structural rather than momentum-based: price remains below the EMA13, EMA34, 50-day and 200-day averages, and the bounce off Thursday's low has come without volume or money-flow confirmation (CMF is flat at −0.004).
Model vs. Market: The options market implies $16.02–$17.90 into September 25 and clusters its positioning at $17.00; the 5-day technical model targets $16.65. That's the whole tension this week — the chart says drift to the lower half of the range, the open interest says gravitate to the top of it.
How it shapes the trades below: it doesn't move the bias, but it does argue against shading any short strike toward the upside. The range structure below is built symmetrically around the walls rather than tilted higher, and the bearish structure is sized to the chart model's own target.
Full technical write-ups: 3-day report → · 5-day report →
4 · Three ways the next five days can go
If SOFI pushes above the call wall ($17.00): the heaviest call open interest for this expiration sits right there, and strikes with that much open interest overhead tend to slow rallies as hedging flows lean against them. A clean break leaves the next shelf at $17.50 (8,695 calls open), then thin positioning until the 20-day moving average at $17.84 and the top of the implied range at $17.90. Both technical reports put their resistance confluence at $17.05–$17.10, just above the wall — which is why $17.20 is the level the 5-day model itself treats as its own undoing.
If SOFI drifts between the walls ($16.50–$17.00): this is the base case that the positioning describes. Max pain for September 25 sits at $17.00, and expirations sometimes gravitate toward the strike where the most option value expires worthless. With the front-week gamma estimate essentially at zero, there's no strong pinning force — just a narrow corridor with heavy open interest on both sides and a market that has realized only 29% volatility over the past two weeks. A 50-cent corridor against a ±94-cent implied move is a tight fit, though; the market is pricing a break, not a pin.
If SOFI breaks below the put wall ($16.50): the next catch is swing support at $16.39, then a gap down to $15.65 and the $14.90 area near the 52-week low of $14.88. This is also where the fragility argument lives: spot sits roughly 18% below the $20 gamma flip estimate, and one rough estimate suggests that below such a flip level market-maker hedging amplifies selling rather than cushioning it. The put wall is where the protection was bought — once price trades through it, the hedges that were supporting the market stop supporting it.
5 · Three defined-risk structures
Prices are end-of-day midpoints as of 2026-09-18. All structures are hypothetical. Verify live prices before trading — these will be stale by the open.
A note on the ordering: with implied volatility at the floor of its yearly range and priced below what the stock has actually delivered, the long-premium (debit) structures lead here. You pay to get in, your maximum loss is what you paid, and you're buying something that is historically cheap for this name rather than selling something that isn't rich.
If you lean bullish: Sept 25 $17/$17.50 call debit spread
- Trade: Buy the Sept 25 $17 call, sell the Sept 25 $17.50 call
- Debit: $0.185 ($18.50 per spread) · Max profit: $31.50 · Max loss: $18.50 · Break-even: $17.185
- Why it fits: You're paying for the move through the call wall rather than betting it holds, and with IV rank at 0 and the volatility risk premium negative, that optionality is as cheap as it has been all year. Risking $18.50 to make $31.50 needs roughly a 1.3% move to break even and 3.2% to max out — both well inside the ±5.54% the market is pricing.
- Makes sense only if: you think the $17.00 open-interest cluster acts as a magnet rather than a ceiling, or that the call-sweep concentration in this name (six contracts at the peer 95th percentile against zero puts) is pointing somewhere.
- Invalidated if: SOFI closes below $16.50.
- Managing it: this is a five-day trade — close it into strength rather than holding for the last few cents of intrinsic value, and cut at roughly half the debit if price loses $16.86. With the medium- and long-term trend reads both still pointing down, take profit early rather than pressing.
- Liquidity note: the $17 calls quote $0.35/$0.37 (2¢ wide, $450,179 of premium traded Friday) and the $17.50s $0.17/$0.18 (1¢ wide, $133,613 traded). Tight in dollars, but that penny or two is 5–6% of the mid on options this cheap — use limit orders and expect to pay the spread once.
- Analyze this position →
If you expect the range to hold: Sept 25 $16/$16.50/$17.50/$18 iron condor
- Trade: Sell the $16.50 put and buy the $16 put; sell the $17.50 call and buy the $18 call, all Sept 25
- Credit: $0.19 ($19 per condor) · Max profit: $19 · Max loss: $31 · Break-evens: $16.31 and $17.69
- Why it fits: the short strikes sit exactly on the put wall and the second call shelf, the two strikes with the most open interest bracketing spot. Realized movement over the last ten sessions (29.3% annualized) has been far quieter than the 40.0% the Sept 25 contracts are priced at.
- Health warning: you're selling premium that hasn't been rich lately — over the past two weeks, implied volatility has run below the stock's 20-day delivered movement every single day. Both break-evens also sit inside the implied range, so this position loses if SOFI simply makes the move the market is already pricing.
- Makes sense only if: you specifically believe the Bollinger squeeze the technical reports describe resolves as more chop rather than as an expansion — and you're comfortable risking $31 to make $19.
- Invalidated if: SOFI closes below $16.50 (or above $17.50 on the other side).
- Managing it: close at roughly 50% of max credit; exit regardless by September 24 to avoid expiration-day gamma; if either short strike closes in the money, close rather than hope.
- Liquidity note: the $16.50 puts quote $0.18/$0.19 and the $17.50 calls $0.17/$0.18 — both a penny wide with real volume behind them. The wings are the problem: the $18 calls and $16 puts both quote $0.08/$0.09, roughly 12% of mid, so four legs of slippage can eat a meaningful share of a $19 credit.
- Analyze this position →
If you lean bearish: Sept 25 $17/$16.50 put debit spread
- Trade: Buy the Sept 25 $17 put, sell the Sept 25 $16.50 put
- Debit: $0.205 ($20.50 per spread) · Max profit: $29.50 · Max loss: $20.50 · Break-even: $16.795
- Why it fits: this is the structure that matches the 5-day chart model's $16.65 target almost exactly, and it sells the strike where the protection is thickest (11,557 puts open at $16.50) to fund the one where it's cheapest to own. With 25-delta puts trading below 25-delta calls in volatility terms, the downside side of this chain is the less crowded one to buy.
- Makes sense only if: you weight the aligned bearish trend reads — price below every major moving average, down 8.9% over roughly two and a half months — above the mildly positive short-dated options sentiment.
- Invalidated if: SOFI closes above $17.20 — the level the 5-day technical model names as its own kill switch, just above the call wall.
- Managing it: take profit at the put wall rather than through it; the first test of $16.50 is where hedging flows are thickest, and waiting for max value means waiting for a break that may not come inside five days.
- Liquidity note: the $17 puts quote $0.38/$0.40 (2¢, $170,547 of premium traded) and the $16.50 puts $0.18/$0.19 (1¢, $84,416 traded). Both are among the five most-traded contracts in the expiration.
- Analyze this position →
If none of these: no trade
There is a real case for standing aside this week, and it isn't laziness. The two walls that define the thesis are only 50 cents apart while the market is pricing a 94-cent move — which means the corridor everyone would like to sell is narrower than the move the options themselves expect. Credit structures here are selling volatility that has been priced below delivered movement for two straight weeks, and debit structures have to overcome bid-ask spreads worth 5% of the mid on the liquid strikes and 12% on the wings. Meanwhile the directional signal is a genuine zero: leading positioning, momentum, short-dated sentiment, skew and wall position land on a composite of −1 out of 100. When the flow has no opinion and the premium isn't rich enough to get paid for selling it, the honest answer is to wait for the squeeze to break and trade the resolution.
6 · Quick FAQ
What is SOFI's expected move this week? About ±$0.94, or ±5.54%, into the September 25 expiration — a $16.02 to $17.90 range, per the options market's straddle pricing as of the September 18 close.
Is SOFI expected to go up or down over the next five days? Options positioning as of September 18 is genuinely neutral — the five inputs we weigh net out to essentially zero, with mildly positive short-dated sentiment offset by spot sitting pinned right beneath the call wall — but that's a read of what traders have done, not a forecast. The actionable map is the $16.02–$17.90 range and the $16.50/$17.00 levels.
Are SOFI options expensive right now? No. IV rank of 0/100 says option prices are lower than every reading of the past year; on top of that, they're running about 6.7 vol points below the movement SOFI has actually delivered over the past 20 days — a gap richer than only about 38% of this stock's own recent readings. The verdict favors owning premium rather than collecting it, with the caveat that the "delivered movement" figure is inflated by the early-September slide and the last two weeks have been much calmer.
Where is SOFI's biggest options support and resistance? For the September 25 expiration, the put wall is $16.50 (11,557 contracts open) and the call wall is $17.00 (12,262 contracts open). Across the whole chain including far-dated months, those clusters sit much wider, at $15.00 and $20.00.
What invalidates this week's read? A close below $16.50.
Methodology & disclosures. Data: end-of-day options-chain snapshot for SOFI, 2026-09-18, generated 2026-09-20T19:04:44.874Z. Prices shown are midpoints and will differ from live markets. Momentum/positioning scores and volatility-premium comparisons are descriptive measurements of past option flow and past price movement — not investment advice, signals, forecasts, or guarantees. Earnings dates and reported results are from the data provider's earnings feed as of 2026-09-20T19:04:44.874Z; report dates can change. All trade structures are hypothetical. Every structure shown has a defined maximum loss; you can lose the entire max-loss amount. Options involve substantial risk and are not suitable for all investors.