SOXL Options Are Pricing an $18.85 Move — Our Read Sees a Pin Near $140
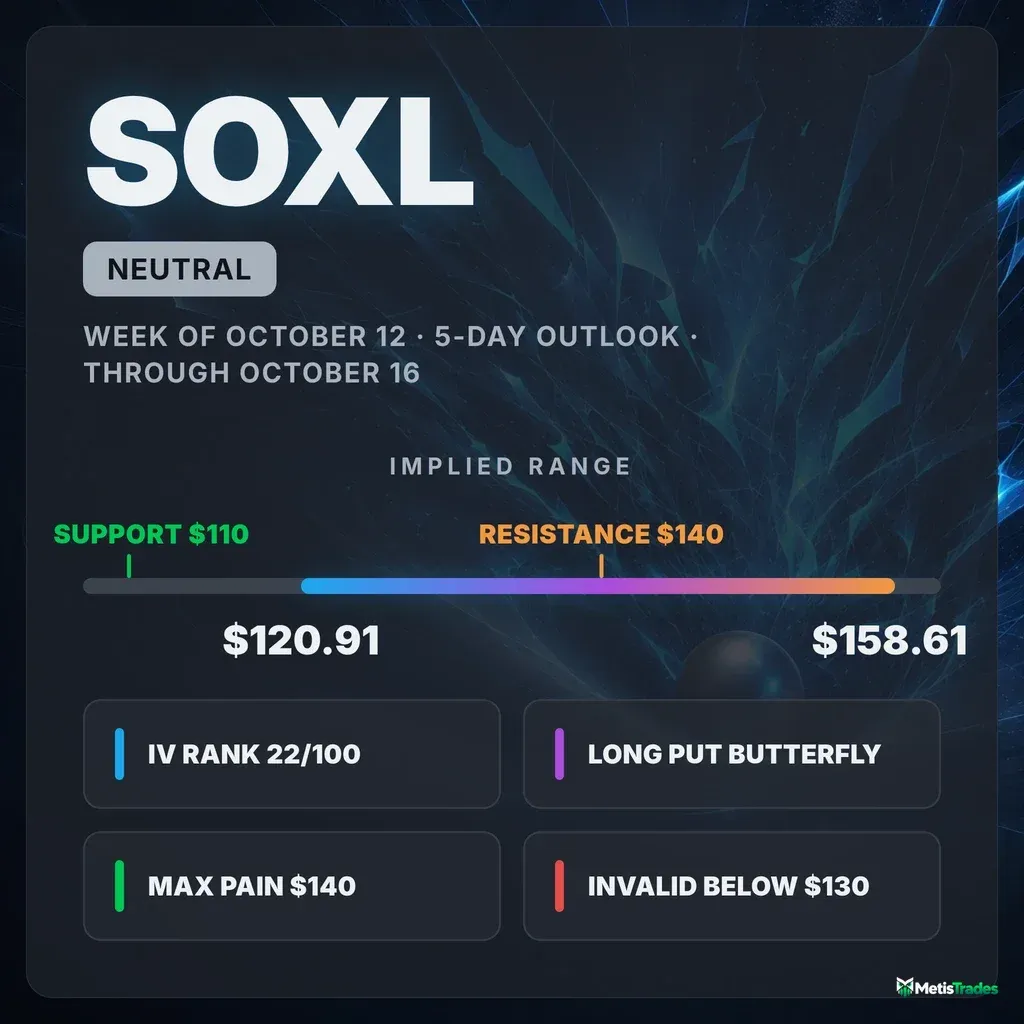
SOXL options imply a $120.91–$158.61 range into the October 16 expiration, and the 5-day call wall and max pain both sit at $140, almost exactly where the stock closed. Here is what is driving the neutral read, where the chart models disagree, and three defined-risk ways to trade it.
Listen to this analysis — prefer audio? This SOXL outlook is also available as a podcast episode:
The options market implies a $120.91–$158.61 range for SOXL into the October 16 expiration, and the heaviest positioning sits right at $140. Below: what is driving that, where the chart models disagree, and three defined-risk ways to trade it.
Published Sunday, October 11, 2026 · Data as of Friday, October 9, 2026 close
Explore the live SOXL options data in the Detailed Options Analyzer →
Quick answer
| Item | Answer |
|---|---|
| Market bias | Neutral |
| Options-implied range (into October 16) | $120.91 – $158.61 (±13.49%, ±$18.85) |
| Major support | $110.00 (put wall, October 16 expiration) |
| Major resistance | $140.00 (call wall, October 16 expiration) |
| Max pain (October 16) | $140.00 |
| Dealer gamma regime (estimate) | Negative — hedging tends to amplify moves; no flip level could be estimated today |
| Volatility condition | Falling — IV rank 22.24/100 · premium thin: options priced ~9.4 vol pts below delivered movement |
| Technical check | Diverges (bearish, 3-day and 5-day models, both targeting $136.50) |
| Best-fitting strategy | Long put butterfly centered on $140 (October 16), if you expect a pin |
| Analysis invalidated if | SOXL closes below $130 |
1 · What matters today
Our read of SOXL options positioning is neutral. The main reason is that the stock closed at $139.76, almost on top of $140. That strike holds the biggest pile of open call contracts for the October 16 expiration, and it is also that expiration's max pain (the price where the most option value would expire worthless). Expirations sometimes gravitate toward that kind of level. The options market is pricing a move of about $18.85 in either direction over the next five trading days, which gives a $120.91–$158.61 range. That is a wide band, because SOXL is a leveraged fund that routinely moves 5% a day. The level that changes the picture is $130, where put positioning and hedging pressure cluster. A close below it breaks the pin story. Both chart-based models lean bearish, toward $136.50, so the technical read diverges from the options read.
2 · What the options market is pricing
What changed this week
The week was a round trip. SOXL fell 14.6% over five sessions, from $164.27 on October 5 to Friday's $139.76 close, with most of the damage in back-to-back gap-downs on October 7 and October 8. Traders responded by loading up on puts. The put/call open-interest ratio (open interest means contracts currently held open) jumped from 0.70 to 1.63 in five days. That means for every call held open there are now 1.63 puts. The 7-day average is 1.11 and the 14-day average is 0.98, so this is a sharp build in downside protection. It is also unusually heavy for SOXL specifically, judged against this fund's own recent history rather than the broader market.
The trading tape tells a different story. Friday's put/call volume ratio was just 0.64, below its 7-day average of 0.78, and total option volume ran 1.41× its 20-day norm. Traders were buying calls into the dip even as put positions piled up.
Our flow composite reflects that whiplash. It swung from mildly positive over the prior week to firmly negative in the last two sessions, and a fresh bearish crossover printed on Friday. The longer trend tells yet another story. The past week's 14.6% drop runs against a fund that is still up 14.7% over roughly a month and 21.8% over about two and a half months. The near-term flow and the bigger trend point different ways, which is a reason to keep any directional trade short-dated.
The biggest live open-interest changes were:
- The October 12 $150 calls added 1,957 contracts, going from 85 to 2,042.
- The October 16 $115 and $110 puts each added roughly 1,100 contracts, stacking onto the put wall.
Into Friday's October 9 expiration, the $150 calls had added 4,420 contracts of open interest. Those were upside bets that expired worthless as the stock closed nearly $10 below them, and that expiration is now settled history.
Expected move
The expected move is the move the options market is pricing in, derived from what straddles cost. For the October 16 expiration it works out to ±$18.85, or ±13.49% around the $139.76 snapshot price. That is the size of the move, not a price target.
| Expiration | Implied move | Range around $139.76 |
|---|---|---|
| October 12 | ±5.46% | $132.13 – $147.39 |
| October 16 | ±13.49% | $120.91 – $158.61 |
| October 23 | ±19.25% | $112.86 – $166.66 |
| November 6 | ±29.26% | $98.87 – $180.65 |
The step from the October 12 rung to the October 16 rung is larger than time alone explains. At-the-money IV is about 60% for the three-day contract and about 97% for the seven-day one, so the market is charging noticeably more per day for the back half of the window. Our inputs contain no scheduled catalyst to explain that gap. The data simply shows it, and it is worth knowing if you are tempted to sell the shorter contract.
Volatility
Implied volatility (IV) is the market's estimate of how much SOXL will move, baked into option prices. At-the-money IV is 105.46%. That sounds enormous, but it is normal territory for a 3× leveraged semiconductor fund. IV rank, which shows where today's IV sits versus the past year, is 22.24/100. In other words, options are cheaper than about 78% of the past year's readings.
IV is also drifting lower:
- It fell 5.1% on Friday and is down 6.4% over 30 sessions.
- It sits below both its 30-day average (110.3%) and its 90-day average (148.9%).
The front-month term-structure read, which compares option prices across expiration dates, is unavailable today because of the expiry-day snapshot. The ladder above already shows longer expirations carrying slightly higher IV.
Movement itself has decelerated relative to the past month. The 5-day versus 20-day realized-volatility ratio is 0.63, which is below its own norm for this fund. That is true even after the selloff, because September's swings were bigger. The VIX is near the bottom of its 52-week range (rank about 8), and SOXL's IV has tracked it fairly closely over the past 60 sessions.
Premium rich or cheap? The volatility risk premium is the gap between how much movement options are priced for and how much SOXL has actually delivered. When it is positive, option sellers have been collecting more than realized movement cost them. Right now it is negative. Options are priced about 9.4 vol points below the 114.9% realized volatility SOXL has delivered over the past 20 days. On its percentile, a reading of 60/100 means it is still less thin than about 60% of this fund's recent readings, since negative gaps have been common for SOXL lately. The gap briefly turned positive around September 30 and October 1, went negative again on October 2, and widened back out on Friday after narrowing midweek. The combination of IV rank near 22 and a negative premium over delivered movement does not favor collecting premium this week. If you are going to trade, defined-risk debit structures are the better fit.
Skew and sentiment
Skew means that puts and calls the same distance from the stock price don't cost the same. When puts are pricier, traders are paying up for crash protection. A full-chain 25-delta skew reading is not available in today's snapshot, so there is no chain-wide number to compare against the norm. The shortest-dated options do give a clue. There, puts carry only about 6 vol points more premium than equivalent calls, against a roughly 47-point norm over the past 50 sessions. Near-dated downside protection is unusually cheap relative to upside calls, which fits the call chasing seen in Friday's volume.
Sentiment by expiration is split, and our summary label is "Mixed":
- 0–7 days: leans clearly bullish. Call open interest in this window grew by about 20,400 contracts versus about 8,400 for puts, and delta-weighted volume favored calls.
- 7–30 days: leans bearish, with puts building and put-side flow dominating.
The short-term window is more bullish than its 7-day average, and the 7–30 day window is more bearish than its own. Traders are buying near-dated upside while hedging the following month, which is consistent with a market that expects chop rather than a clean trend.
The key levels map
| Level | Price | Why it matters |
|---|---|---|
| 100-day moving average | $164.40 | Where the early-October rally stalled; far overhead |
| Unfilled gap zone | $150.48 – $158.91 | Left by the October 8 gap-down; thin trading above $150 |
| Implied range high (October 16) | $158.61 | Top of the ±1σ expected move |
| Whole-chain call wall / #2 gamma strike | $150.00 | Heaviest call open interest across all expirations (19,151 contracts) |
| Swing resistance | $150.08 | Recent pivot cluster, stacked on the $150 strike |
| Max pain (October 12) | $147.00 | Where the three-day expiration's option value is minimized |
| Swing resistance | $144.34 | Nearest overhead pivot; also near both chart models' invalidation |
| 20-day moving average | $140.40 | Price sits just under it |
| Call wall + max pain (October 16) / #1 gamma strike | $140.00 | 4,754 calls open for October 16; the pin magnet for this window |
| Spot (snapshot) | $139.76 | Friday's close |
| Swing support / gamma strike | $135.21 / $135 | First support; heavy put open interest at $135 |
| Gamma strike | $130.00 | 13,804 puts open across the chain; this article's kill switch |
| 50-day moving average | $130.75 | Next structural support; both chart models' downside target zone |
| Swing supports | $128.48 / $124.88 | Pivots below the $130 cluster |
| Implied range low (October 16) | $120.91 | Bottom of the ±1σ expected move |
| 200-day moving average | $120.36 | Long-term trend line; still well below price |
| Put wall (October 16) | $110.00 | Biggest put pile for the window (5,953 contracts), still growing |
| Whole-chain put wall | $100.00 | Heaviest put open interest across all expirations (16,266) |
The October 16 walls are not the same as the whole-chain walls. Across all expirations combined, the heaviest call strike is $150 and the heaviest put strike is $100. For the five-day window, the walls are $140 and $110.
Positioning and unusual flow
Market makers hedge the options they have sold. One rough estimate says the chain sits in negative gamma, both overall and for the October 16 expiration specifically. In that regime, dealer hedging tends to amplify moves rather than dampen them. That estimate rests on an assumed dealer positioning convention, and no gamma-flip level could be computed today. It means the $140 pin is a magnet, not a floor. If price breaks away from it, hedging flows can push the move further.
A few flows stood out:
- October 16 $140 puts: about $1.83 million of premium changed hands on 2,372 contracts, the biggest dollar flow in the chain. That is traders buying protection right at the pin.
- October 12 $140 calls: 4,940 contracts against just 191 open, about $1.43 million in premium. These are short-term upside bets that need a quick bounce.
- October 12 $146 calls: 1,276 contracts against just 14 open, a 91× turnover. Someone is speculating on a two-day snap-back above $146.
- October 16 $139 calls: 858 contracts against 81 open, about $646,000 in premium. More near-the-money call buying aimed at this window.
3 · Technical check
Both chart-based models lean bearish, which diverges from the neutral options read.
- 3-day model (targets October 14): $136.50, with a projected range of $134.50 to $144.00.
- 5-day model (targets October 16): also $136.50, with a projected range of $132.00 to $141.50.
Both targets sit comfortably inside what options are pricing, so the disagreement is about direction, not magnitude. The two most telling indicators:
- ADX at 38.5, with sellers dominating. ADX measures trend strength, and this reading confirms a strong downtrend. However, it is flattening, which often precedes consolidation.
- Chaikin Money Flow at −0.052. CMF tracks money moving into or out of the stock, and it has slipped just into mild selling pressure.
Both write-ups describe a bearish flag forming above support near $131–$135. The dominant scenario's invalidation is a close above $144 (3-day) or $143.50 (5-day).
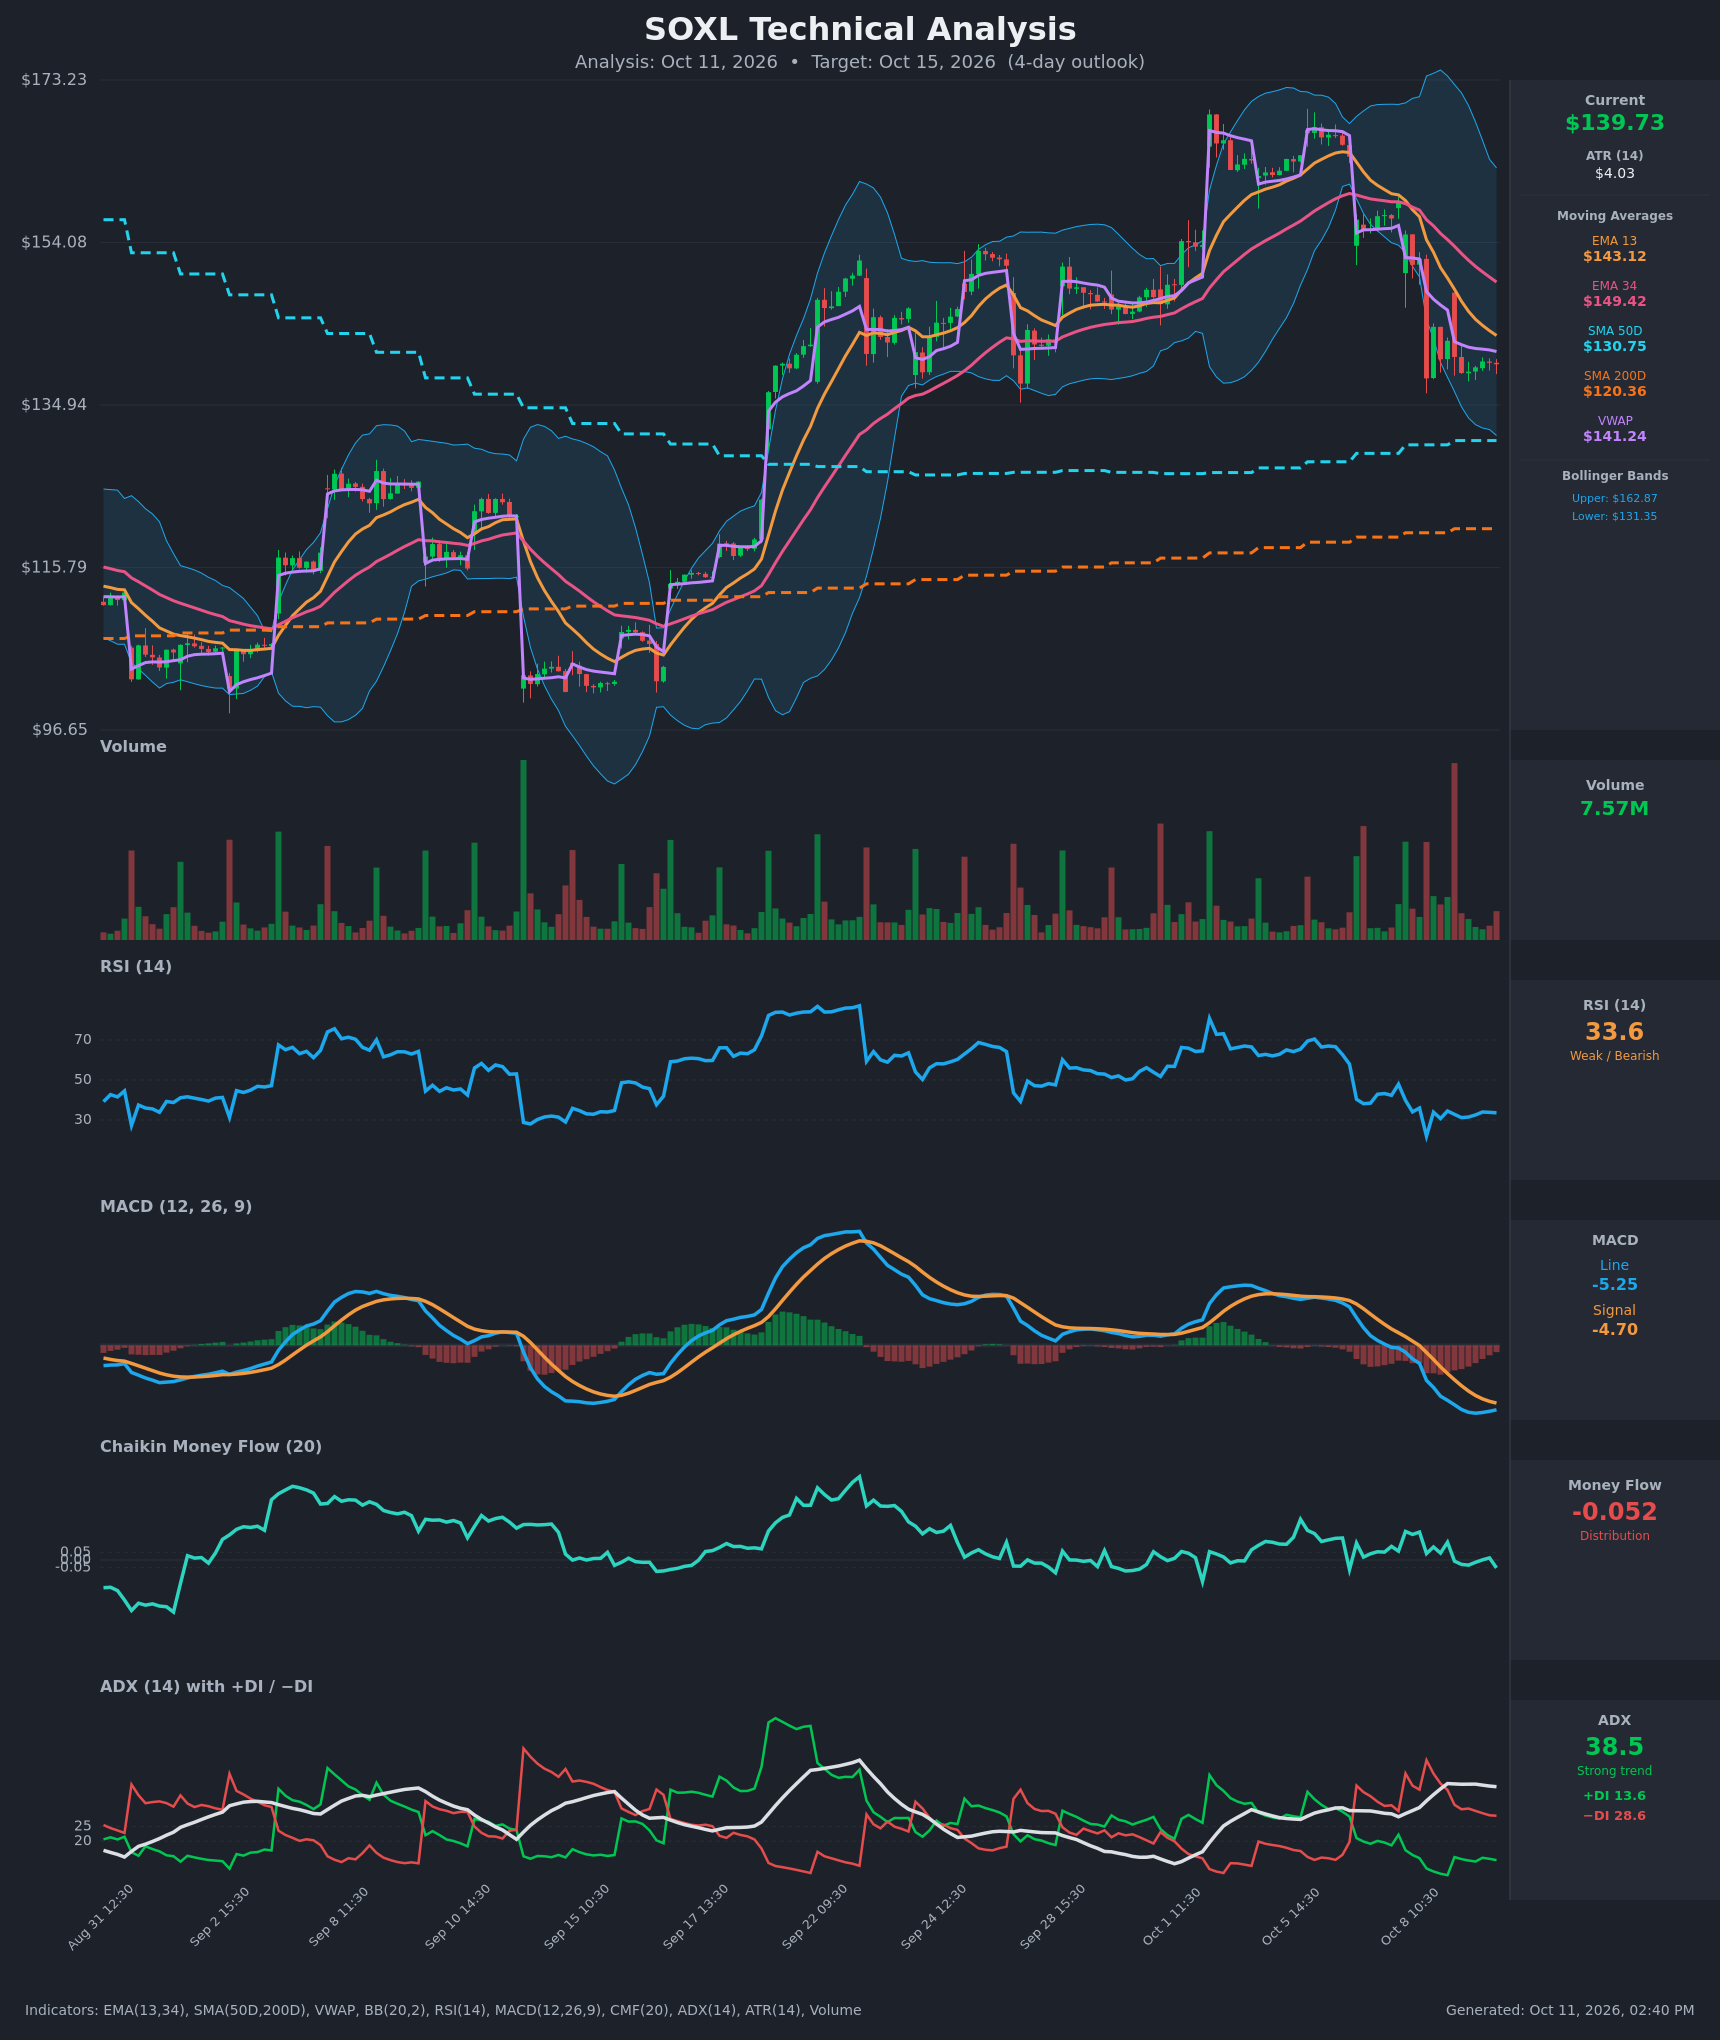
Model vs. Market: The options market implies $132.13–$147.39 into the October 12 expiration; the 3-day technical model targets $136.50. A move to $136.50 would land just under the $140 pin but well above the $130 kill switch. That outcome is close enough to $140 that the market's "stay near here" pricing and the chart's "drift lower" call could both be roughly right.
The technical lean shaped strike selection in one way: the bearish structure below is centered to profit around the models' $136.50 target and the $130–$131 support cluster.
Full technical write-ups: 3-day report → · 5-day report →
4 · Three ways the week can go
If SOXL pushes back above the call wall ($140) and through $144.34: The October 16 call wall is already at the money, so the first test is reclaiming it with conviction. Above $144.34 swing resistance, the next heavy positioning is the whole-chain $150 call wall, which is also the bottom edge of the unfilled gap left on October 8. In a negative-gamma regime, a clean move through $144 could travel quickly toward $150 before call open interest starts to slow it.
If SOXL drifts around $140: This is the pin case. October 16 max pain and the call wall both sit at $140, and the largest gamma concentration in the whole chain is at that strike. Expiring open interest tends to pull price toward that kind of level as expiration approaches, especially when volume fades, as it did late in the week. This is the scenario the options data supports most directly.
If SOXL breaks below $135 and then $130: There is heavy put open interest at $135 and $130, and the 50-day average sits at $130.75. If hedging pressure in a negative-gamma regime turns those put strikes into accelerants rather than cushions, the $130 area becomes the line where the pin thesis fails. Below it, the next significant positioning is the October 16 put wall at $110. In between, there are only swing supports at $128.48 and $124.88.
5 · Three defined-risk structures
Prices are end-of-day midpoints as of October 9, 2026. All structures are hypothetical. Verify live prices before trading, because these will be stale by the open.
The structures below are all debit spreads, where you pay up front and your loss is capped at what you paid. Premium over delivered movement is negative this week, so selling naked premium into a negative-gamma tape offers little cushion.
If you expect the range to hold: long put butterfly ($130/$140/$150)
- Trade: Buy 1 October 16 $130 put, sell 2 October 16 $140 puts, buy 1 October 16 $150 put.
- Debit: $2.20 ($220 per butterfly) · Max profit: $7.80 ($780) if SOXL settles exactly at $140 · Max loss: $2.20 ($220) · Break-evens: $132.20 and $147.80.
- Why it fits: Max pain, the five-day call wall, and the chain's largest gamma strike all sit at $140, within a quarter of a point of spot. A butterfly pays the most at exactly that pin. Because it is a debit structure, you are not short naked premium in a week when options are priced below delivered movement.
- Makes sense only if: You believe the $140 magnet outweighs the negative-gamma tendency to break away from it.
- Invalidated if: SOXL closes below $130 or above $150.
- Managing it: Butterflies gain most in the final days. Consider closing if the position is worth roughly double the debit. Exit by the October 15 close rather than holding into the October 16 settlement, to avoid pin and assignment risk on the short strikes.
- Liquidity note: The $130 puts traded 45¢ wide (about 12% of mid), the $140 puts 65¢ wide, and the $150 puts $1.15 wide. Every leg is above a 5% spread, so enter as a single limit order near the mid and expect some slippage.
- Analyze this position →
If you lean bullish: bull call spread ($140/$150)
- Trade: Buy the October 16 $140 call, sell the October 16 $150 call.
- Debit: $3.88 ($387.50) · Max profit: $6.13 ($612.50) at $150 or higher · Max loss: $3.88 ($387.50) · Break-even: $143.88.
- Why it fits: Near-dated sentiment and Friday's call-heavy volume lean bullish, and the bigger trend over the past one to two and a half months is still up. The short strike sits at the whole-chain $150 call wall, where upside positioning thickens.
- Makes sense only if: SOXL reclaims $144.34 early in the window. A short-term downtrend is fighting the longer uptrend, so this needs to work fast.
- Invalidated if: SOXL closes below $135.
- Managing it: Take profits around half of max profit, because a short-term move against the bigger trend argues for banking gains early. Exit regardless by the October 15 close.
- Liquidity note: The $140 calls traded 50¢ wide and the $150 calls 25¢ wide (about 7% of mid each). That is workable, but use limit orders.
- Analyze this position →
If you lean bearish: bear put spread ($140/$130)
- Trade: Buy the October 16 $140 put, sell the October 16 $130 put.
- Debit: $3.95 ($395) · Max profit: $6.05 ($605) at $130 or lower · Max loss: $3.95 ($395) · Break-even: $136.05.
- Why it fits: The put/call open-interest ratio more than doubled in five days, flow momentum turned negative, and both chart models target $136.50, with flag-breakdown targets near $131–$135. The short $130 strike sits at the heavy put and gamma cluster just above the 50-day average.
- Makes sense only if: SOXL fails to reclaim the $140–$141 area early in the week.
- Invalidated if: SOXL closes above $144.
- Managing it: Close at about 50% of max profit. If SOXL tags $131–$132 early, take the money rather than waiting for settlement. Exit by the October 15 close.
- Liquidity note: The $140 puts traded 65¢ wide (about 8% of mid) and the $130 puts 45¢ wide (about 12%). Expect to give up a little on the fill.
- Analyze this position →
If none of these: no trade
Standing aside is a reasonable call this week. The positioning signals genuinely disagree:
- Near-dated calls are being bought while next-month puts build.
- The short-term trend is down while the longer one is up.
- The options read is neutral while the chart models are bearish.
Option prices are low versus the past year but still thin relative to how much SOXL has actually been moving. That leaves no clear premium edge for sellers. Every bid-ask spread in this expiration is wide in percentage terms, which eats into small-edge trades. If you cannot watch the position daily in a leveraged fund that can gap 5–7% overnight, no position is a legitimate choice.
6 · Quick FAQ
What is SOXL's expected move this week? About ±$18.85 (±13.49%) into the October 16 expiration, based on straddle pricing as of the October 9 close. That gives an implied range of $120.91 to $158.61.
Is SOXL expected to go up or down over the next week? Options positioning as of October 9 is neutral. Price is sitting on the $140 max-pain and call-wall strike while near-dated calls and next-month puts both build. That is a read of what traders have done, not a forecast. The actionable map is the $120.91–$158.61 range, with $140 as the magnet and $130 as the line that breaks the pin story.
Are SOXL options expensive right now? IV rank is 22.24/100, so option prices are lower than about 78% of the past year's readings. On top of that, they are running about 9.4 vol points below the movement SOXL has actually delivered. Taken together, premium is not rich enough to favor selling it this week.
Where is SOXL's biggest options support and resistance? For the October 16 expiration, the put wall is $110 and the call wall is $140. Across all expirations, the heaviest strikes are $100 (puts) and $150 (calls).
What invalidates this week's read? A close below $130.
Methodology & disclosures. Data: end-of-day options-chain snapshot for SOXL, 2026-10-09, generated 2026-10-11T14:40:39.177Z. Prices shown are midpoints and will differ from live markets. Momentum/positioning scores and volatility-premium comparisons are descriptive measurements of past option flow and past price movement — not investment advice, signals, forecasts, or guarantees. All trade structures are hypothetical. Every structure shown has a defined maximum loss; you can lose the entire max-loss amount. Options involve substantial risk and are not suitable for all investors.