SOXL Options Are Pricing an $18 Move Into September 21 — The Chart Models See Half That
SOXL's options market implies a $103.88–$139.76 range into the September 21 expiration, while the 7-day chart model projects a band barely a third that wide. Here's what the positioning actually says, where the levels sit, and three defined-risk ways to trade the gap.

The options market implies a $103.88–$139.76 range into the September 21 expiration; here's what's driving it and three defined-risk ways to trade it.
Published Sunday, September 13, 2026 · Data as of Friday, September 11, 2026 close
Explore the live SOXL options data in the Detailed Options Analyzer →
Quick answer
| Item | Answer |
|---|---|
| Market bias | Neutral with a bearish tilt |
| Spot (Friday, September 11 close) | $121.82 |
| Options-implied range (into September 21) | $103.88 – $139.76 (±14.73%, or ±$17.94) |
| Major support | $90.00 (put wall, September 21 expiration) |
| Major resistance | $116.00 (call wall, September 21 expiration — already below spot) |
| Max pain (September 21) | $125.00 |
| Dealer gamma regime (estimate) | Positive across the whole chain — hedging tends to dampen moves; flip level ≈ $130 (estimate). The September 21 expiration's own book is estimated slightly negative |
| Volatility condition | Falling — IV rank 26/100 · premium rich: options priced ~4.4 vol points above delivered movement |
| Technical check | Mixed — 4-day model bullish ($122.50 target), 7-day model bearish ($119.80 target) |
| Best-fitting strategy | Defined-risk call credit spread above the max-pain shelf |
| Analysis invalidated if | SOXL closes above $130.00 |
1 · What matters today
SOXL closed Friday, September 11 at $121.82 after a 14% five-day bounce, and the options market is pricing another ±$17.94 (±14.73%) between that close and the September 21 expiration — a range of $103.88 to $139.76. That's the move the options market is pricing in, derived from what straddles cost. Our read of the chain lands neutral with a bearish tilt: the leading positioning read flipped negative on Friday even as price climbed, put-side sweeps outnumbered call sweeps 13 to 7, and spot is already sitting above the little call open interest the September 21 line actually carries. Balancing that, five-day price momentum is firmly positive and near-dated flow is calm. Max pain for September 21 sits at $125. The level that ends the argument: a close above $130. The two chart models split — bullish at four days, bearish at seven.
2 · What the options market is pricing
What changed this week
The week was a violent round trip. SOXL is +14.13% over the last five trading days but −16.03% over the last twenty — and the fund gapped 7.56% lower on September 10 before gapping 4.28% higher on September 11. Implied volatility — the market's estimate of how much SOXL will move, baked into option prices — came off hard with the bounce: at-the-money IV finished at 105.85%, down 7.14% on the day and down 39.83% over thirty days, sitting well under its 30-day average of 131.0% and its 90-day average of 155.9%.
Positioning tilted the other way. Put/call volume finished at 0.91 against a 7-day average of 0.75 and a 14-day average of 0.79 — for every call contract traded there were 0.91 puts, noticeably more put-heavy than the recent norm. Total option volume ran 1.42× its 20-day average. The biggest single open-interest build on the board was in the September 18 $90 puts, which added 2,524 contracts to 9,494 on 4,260 traded — deep crash insurance roughly 26% below spot. Put/call open interest, by contrast, eased to 0.87 from a 14-day average of 1.26, so the older put book is thinning even as new tail hedges go on.
Our short- and long-term trend reads are pointing in different directions, and that tension is the story of the week. Over the past week the read is bullish on a +14.1% price move; over the past month it is bearish on −16.0%; over roughly two months it is bearish on −43.9%. A one-week bounce inside a two-month drawdown is exactly the configuration that argues for shorter-dated structures and earlier profit-taking rather than swinging for a trend.
Expected move
Into the September 21 expiration the chain prices ±$17.94 around $121.82 — a $103.88 to $139.76 range. Here is the full ladder of tradeable expirations in front of it:
| Expiration | Implied move | Range around $121.82 |
|---|---|---|
| September 14 (3 days) | ±5.27% | $115.40 – $128.24 |
| September 16 (5 days) | ±10.22% | $109.37 – $134.27 |
| September 18 (7 days) | ±13.55% | $105.31 – $138.33 |
| September 21 (10 days) | ±14.73% | $103.88 – $139.76 |
Note the odd rung: September 21 adds only about 1.2 percentage points of range for three extra calendar days, because its at-the-money IV prints at 89.0% versus 97.8% for September 18. That is a thinly quoted Monday line, not a genuine volatility discount — treat its pricing with a little suspicion and its fills with a lot.
Volatility
At-the-money IV of 105.85% carries an IV rank of 26/100 — where today's IV sits versus the past year, meaning option prices are cheaper than roughly 74% of the past year's readings — with an IV percentile of 31. Direction is down: −7.14% on the day, +1.24% over five days, −39.83% over thirty. The front-month read is unavailable today (expiry day), so there is no clean term-structure comparison across expirations to quote.
Two readings versus this fund's own recent norm are worth flagging. First, 20-day realized volatility is 101.5% — which sounds enormous, and is, but it is unusually depressed for SOXL's own recent history. Second, spot is sitting about 6.7% below the estimated gamma-flip level, and unusually far below it versus its own norm. Separately, VIX sits near the bottom of its own 52-week range (rank 13/100) and this fund's IV has tracked it reasonably closely over the past sixty sessions.
Premium rich or cheap. The volatility risk premium — the gap between how much movement options are priced for and how much SOXL has actually delivered — is about 4.4 vol points (105.85% implied against 101.5% realized). When it is positive, option sellers have been collecting more than realized movement cost them. Where today's gap sits versus this fund's own recent readings: the 70th percentile, meaning richer than about 70% of them, and the gap is running above its own norm on our internal scaling too. The path matters: the premium was deeply negative in late August, swung positive on September 1, peaked near 22 vol points on September 8, and has compressed steadily since as the bounce burned off implied vol. So: IV rank 26 with a 70th-percentile premium over delivered movement modestly favors collecting premium this week — but 4.4 points of cushion on a fund that has gapped 7% in a session is a moat, not a fortress.
Skew and sentiment
A clean 25-delta skew reading — how much more expensive puts are than calls the same distance from spot — was unavailable on Friday, but the front-expiration risk reversal tells the story anyway: puts in the 0–7 day bucket priced about 8.4 vol points over calls against a 42-day baseline of 60.1 points. Puts are still dearer, but by nothing like the usual margin for this fund. Traders have stopped paying up for crash protection in the very front of the curve, which is what a relief bounce looks like in option prices.
Directional lean by expiration bucket is flat: +10 in the 0–7 day bucket and +14 in the 7–30 day bucket, both well inside the neutral band, which our read labels a Calm regime. Both are softer than their own 7-day averages (+23 and +40), so the near-dated bullish lean is fading rather than building. The one genuinely extreme reading: peer-relative sweep flow, where 7 call contracts versus 13 put contracts cleared the top-percentile volume bar — put-side sweeps dominating by a margin well above this fund's own norm. That is the single strongest bearish input in Friday's picture.
The key levels map
| Level | Price | Why it matters |
|---|---|---|
| Top of implied range (Sept 21) | $139.76 | Upper rail of what options price through the target expiration |
| 50-day moving average | $136.21 | Price sits 10.6% below it — the intermediate ceiling |
| Swing resistance | $135.02 | Heuristic swing-pivot cluster, not a guaranteed reaction zone |
| Call wall (Sept 18) / gamma flip estimate | $130.00 | 7,130 calls open — the heaviest call strike at the Sept 18 line, the largest total-gamma strike chain-wide, and the rough flip estimate. The kill switch |
| 7-day chart model resistance | $128.35 | Upper Bollinger band on the technical read |
| Max pain (Sept 21) | $125.00 | The price where the most option value at that expiration would expire worthless |
| Swing resistance | $124.88 | Nearest overhead price-structure level |
| Spot / 20-day MA | $121.82 / $120.14 | Friday's close sits 1.4% above the 20-day average |
| Max pain (Sept 18) / heavy gamma | $120.00 | The nearer expiration's magnet, and the second-largest gamma strike |
| 4-day model invalidation | $119.00 | The near-term chart model's stated break level |
| Swing support | $116.47 | First structural shelf below spot |
| Call wall (Sept 21) | $116.00 | Heaviest call OI in the target expiration — but only 100 contracts, and spot has already cleared it |
| Heavy put strike | $115.00 | 9,384 puts open chain-wide; short strike of this week's structures |
| 200-day moving average | $110.59 | Price is 10.2% above it — the long-term trend line still holds |
| Heavy put strike | $110.00 | 13,133 puts open chain-wide, 4,546 at the Sept 18 line |
| Swing support | $106.00 | Next structural shelf |
| Bottom of implied range (Sept 21) | $103.88 | Lower rail of what options price through the target expiration |
| Put wall (whole chain) | $95.00 | 13,593 puts open — the deepest pool across all expirations |
| Put wall (Sept 21) | $90.00 | The target expiration's own heaviest put strike, and 9,494 puts at the Sept 18 line |
One caveat on the aggregate figures: chain-wide the heaviest call strike computes to $114, but 20,025 of those 20,424 contracts sat at the September 11 expiration that has already settled. Treat it as history, not as a live ceiling.
Positioning and unusual flow
One rough estimate of dealer positioning puts the whole chain in a positive gamma regime — market makers hedge the options they've sold, and in this regime their hedging tends to dampen moves rather than amplify them — with a flip level around $130. Note the disagreement: the September 21 expiration's own book estimates negative, but that row is so thin (a 100-contract call wall, a 568-contract put wall) that its hedging footprint is negligible. For the next ten days the September 18 book, not the September 21 book, is where the real positioning lives.
Three non-expired flow items stood out on Friday:
- September 18 $130 calls — 2,034 contracts traded against 7,130 open, about $666,000 of premium, and a top-percentile print versus comparable contracts. This is the overhead pile that matters, and it is being actively worked.
- September 18 $90 puts — the single largest open-interest build on the board, +2,524 to 9,494 on 4,260 traded. Someone is paying roughly 30¢ a contract for protection 26% below spot.
- September 16 $116 puts — 1,128 contracts traded on 108 open, a turnover ratio above 10×. Fresh short-dated downside positioning just under the market.
The composite picture: crash insurance on one side of the book, an owned upside line at $130 on the other, and very little conviction in between.
3 · Technical check
The two chart models disagree, and the disagreement is informative. The 4-day model is bullish, targeting $122.50 inside a projected $117.00–$127.00 band — essentially "flat with a tick up." It leans on a money-flow reading that has stayed firmly in accumulation territory since the September 10 low, and on a short-term moving-average crossover that remains intact. That is a mild divergence from our bearish tilt, but a target 0.6% above spot is barely a disagreement at all.
The 7-day model is bearish, targeting $119.80 inside $114.50–$127.50, with the target date matching our outlook window exactly. It flags a fresh negative momentum crossover forming right at Friday's bar and a trend-strength reading that has collapsed from the high-30s in early September to 20.6, with directional indicators effectively tied — no trend, just chop. That confirms the options read: both describe a market with fading conviction and a mild downward pull, and its target sits comfortably inside the options-implied range.
Model vs. Market: The options market implies $105.31–$138.33 into the September 18 expiration; the 4-day technical model targets $122.50 inside a $117.00–$127.00 band. The chart model's entire range fits within the middle third of what options are pricing — the market is paying for a tail the chart doesn't see, and absorbing that gap is exactly what a premium seller gets paid for.
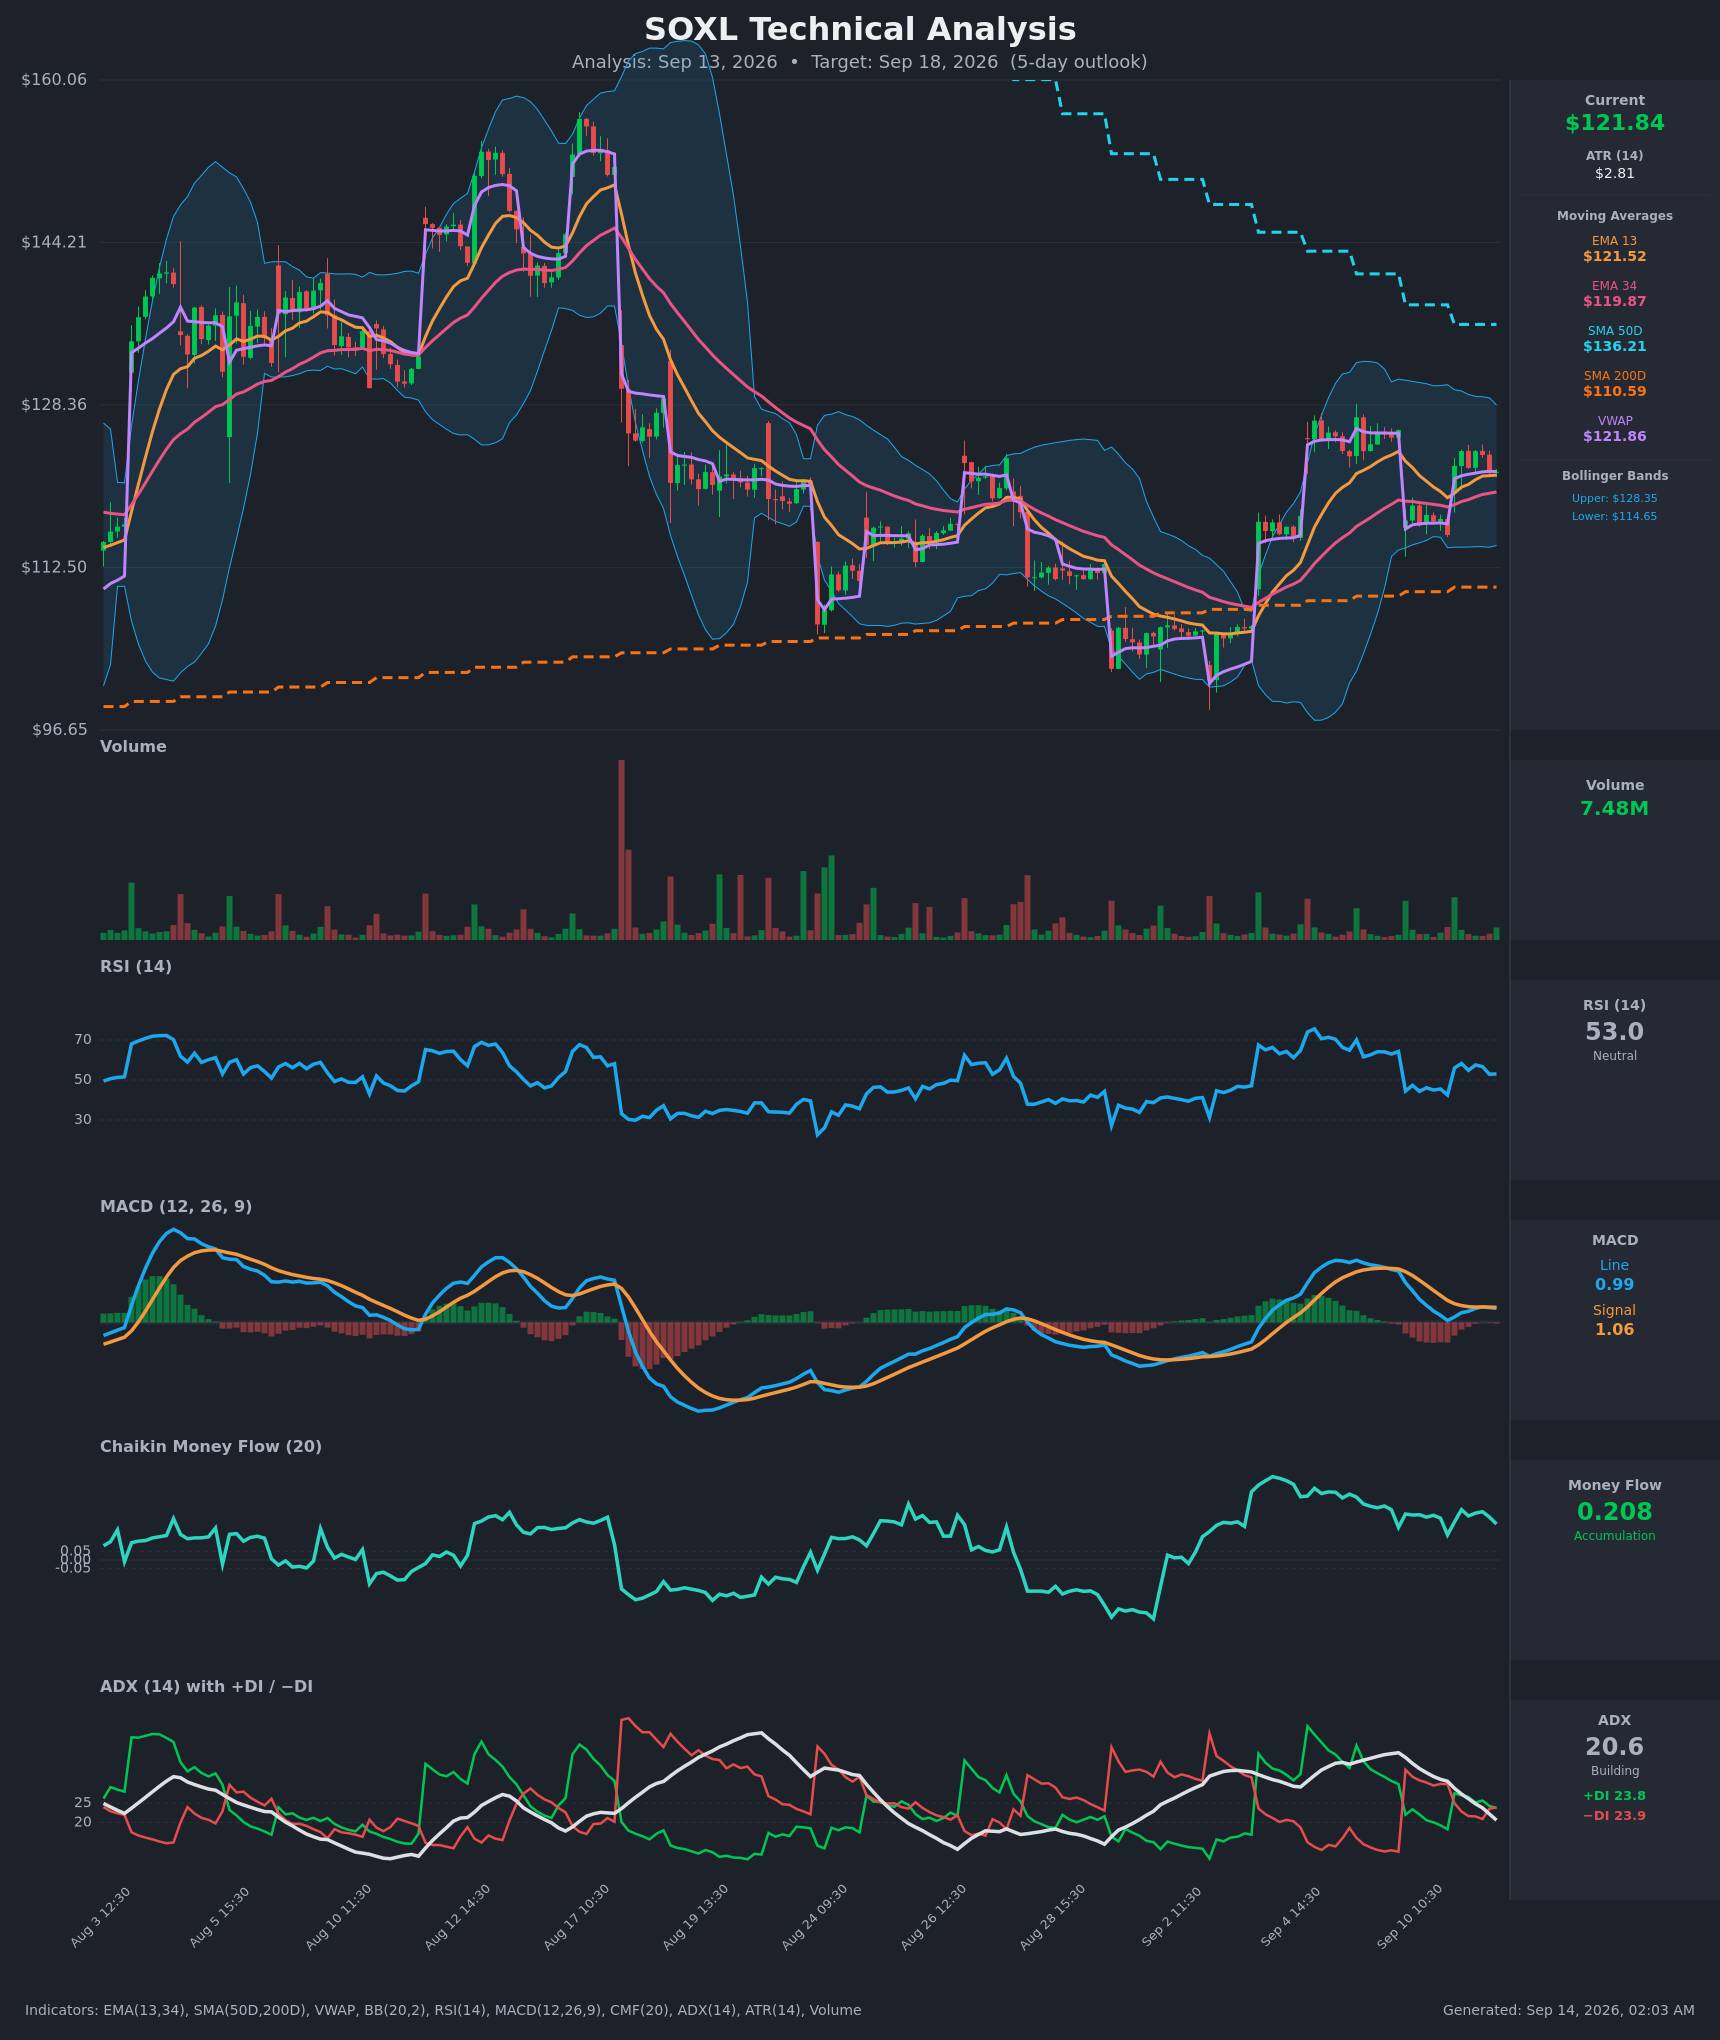
Net effect on the structures below: the 7-day model's $128.35 resistance and the options chain's $130 call pile agree, so the short call strikes sit at or under $130 rather than being pushed further out.
Full technical write-ups: 4-day report → · 7-day report →
4 · Three ways the next ten days can go
If SOXL pushes above $130: that is the heaviest call line at the September 18 expiration and the rough gamma-flip estimate. Positioning above it thins out quickly — the next meaningful markers are the $135 swing level and the 50-day average at $136.21. A clean break through $130 would mean the bounce has become a trend, and it is the level on which this article's read stands or falls.
If SOXL drifts between $115 and $130: the base case. Max pain for September 21 sits at $125 and for September 18 at $120 — expirations sometimes gravitate toward those strikes as expiring open interest is unwound. With the chain-wide dealer estimate in positive-gamma territory, hedging flows would tend to lean against extension in either direction, which is the same picture the 7-day chart model paints from a completely different angle.
If SOXL breaks below $115: there is a real put shelf at $110 (13,133 contracts open chain-wide) and a deeper one at $95, with the 200-day average at $110.59 in between. Spot is already sitting an unusually long way below the flip estimate for this fund; drop further and one rough estimate suggests market-maker hedging shifts toward amplifying selling rather than cushioning it. The $90 put build says somebody is explicitly paying for that scenario.
5 · Three defined-risk structures
Prices are end-of-day midpoints as of 2026-09-11. All structures are hypothetical. Verify live prices before trading — these will be stale by the open.
If you lean bearish: September 21 $125/$130 call credit spread
- Trade: Sell the September 21 $125 call, buy the September 21 $130 call
- Credit: $1.53 · Max profit: $153 · Max loss: $347 · Break-even: $126.53
- Why it fits: you collect a credit and win if SOXL sits anywhere below $125 at the target expiration — which is exactly where max pain for that line sits. The premium is running about 4.4 vol points over delivered movement (70th percentile for this fund), so selling rather than buying is the side with the statistical wind. The short strike also sits under the $128.35 resistance the 7-day chart model names and under the $130 call pile.
- Makes sense only if: you accept a near-the-money short strike on a 3x fund — the $125 call carries roughly a 46 delta, so this is close to a coin flip paid at better than even money, not a high-probability trade.
- Invalidated if: SOXL closes above $130.00.
- Managing it: take roughly 50% of the credit if it comes; given that the past week's bounce is fighting a two-month downtrend, don't hold for the last few cents — close by September 18 if the trade hasn't worked, and close rather than hope if SOXL settles through $125 with days left.
- Liquidity note: this is the weak point. The September 21 $125 call quoted $5.40 × $6.05 (65¢ wide, ~11% of mid) and the $130 call $3.40 × $5.00 ($1.60 wide, ~38% of mid). That Monday line is thinly quoted across the board. Enter as a spread order with a limit near $1.50 and walk away if you can't get filled close to it — paying up here hands back a third of the edge before the trade starts.
- Analyze this position →
If you expect the range to hold: September 18 $110/$115/$130/$134 iron condor
- Trade: Sell the $115 put, buy the $110 put, sell the $130 call, buy the $134 call — all September 18
- Credit: $2.33 · Max profit: $232 · Max loss: $268 · Break-evens: $112.68 and $132.33
- Why it fits: the short strikes are pinned to real positioning rather than round numbers — $130 is the heaviest call open interest at this expiration, and $115 sits just under the $116.47 swing shelf with 9,384 puts open chain-wide. This expiration is also where the liquidity actually is, which is why the condor moves here instead of to September 21. A credit of $232 against $268 of risk is close to even money, which is the market's honest way of saying a $115–$130 corridor is narrow for a fund with a ±13.55% expected move to that date.
- Makes sense only if: you genuinely believe the chop continues — this pays you roughly 1:1.15 for a range the options market itself does not expect to hold comfortably.
- Invalidated if: SOXL closes above $130.00 or below $115.00 before expiration — at that point manage the tested side rather than waiting for the break-even.
- Managing it: close at ~50% of max credit; roll or close the tested side rather than defending both; be out by the September 18 close either way, which lands three days before the outlook target.
- Liquidity note: excellent on three legs — the $115 puts traded 10¢ wide (2.7% of mid, 1,439 contracts), the $110 puts 5¢ wide (2.1%, 1,772 contracts), the $130 calls 25¢ wide (7.6%, 2,034 contracts). The $134 call wing is the loose one at 37¢ wide on 249 traded; use a limit on the package.
- Analyze this position →
If you lean bullish: September 18 $115/$110 put credit spread
- Trade: Sell the September 18 $115 put, buy the September 18 $110 put
- Credit: $1.38 · Max profit: $138 · Max loss: $362 · Break-even: $113.63
- Why it fits: if you read the 14% five-day bounce and the persistent accumulation signal on the chart as a base rather than a bear-market rally, this is the cheapest way to express it — you collect a credit and win as long as SOXL simply stays above $115. It is the put half of the condor above, run alone. Both strikes sit in the fattest put open interest on the board, so the fills are effortless.
- Makes sense only if: you're willing to risk $362 to make $138. The odds are on your side; the payoff is not.
- Invalidated if: SOXL closes below $115.00.
- Managing it: take 50% and go; with the short-term bounce running against a still-bearish two-month trend, holding a short put into the last day of a 3x fund's expiration is not where the remaining money is.
- Liquidity note: the $115 puts traded 10¢ wide on 1,439 contracts and the $110 puts 5¢ wide on 1,772 — among the tightest markets in the entire chain.
- Analyze this position →
If none of these: no trade
The premium is rich by this fund's own standards — but "rich" here means 4.4 vol points of cushion against an instrument that has realized over 100% annualized volatility and gapped 7.6% down and 4.3% up in consecutive sessions this month. A single gap through a short strike erases many weeks of collected credit, and every structure above pays roughly $1.40–$2.30 to risk $2.70–$3.60. Add the September 21 line's wide quotes, where slippage can eat a third of the edge on entry alone, and standing aside is a defensible answer even with the premium where it is. Our directional read is a tilt, not a conviction call: if you don't have a view on whether $130 or $115 breaks first, the honest position is none.
6 · Quick FAQ
What is SOXL's expected move this week? ±$17.94 (±14.73%) into the September 21 expiration — a range of $103.88 to $139.76 — per the options market's straddle pricing as of 2026-09-11.
Is SOXL expected to go up or down over the next week? Options positioning as of September 11 leans mildly bearish — the leading positioning read turned negative while price rose, and put-side sweeps outnumbered call sweeps — but that is a read of what traders have already done, not a forecast. The actionable map is the $103.88–$139.76 range and the $90 / $116 wall levels, with $130 as the line that changes the picture.
Are SOXL options expensive right now? Two lenses. IV rank of 26/100 says option prices are lower than roughly 74% of the past year's readings. On top of that, they're running about 4.4 vol points above the movement SOXL has actually delivered over the past twenty days — richer than about 70% of this fund's own recent readings. Net: cheap versus the year, modestly rich versus recent reality, which tilts marginally toward collecting premium in defined-risk form.
Where is SOXL's biggest options support and resistance? For the September 21 expiration, the put wall is $90.00 and the call wall $116.00 — though that call wall carries only 100 contracts and spot has already cleared it. The deeper pools sit at the September 18 line: 7,130 calls at $130 and 9,494 puts at $90.
What invalidates this week's read? A close above $130.00 — the heaviest call strike at the September 18 expiration and the rough gamma-flip estimate.
Methodology & disclosures. Data: end-of-day options-chain snapshot for SOXL, 2026-09-11, generated 2026-09-14T02:03:05.045Z. Prices shown are midpoints and will differ from live markets. Momentum/positioning scores and volatility-premium comparisons are descriptive measurements of past option flow and past price movement — not investment advice, signals, forecasts, or guarantees. All trade structures are hypothetical. Every structure shown has a defined maximum loss; you can lose the entire max-loss amount. Options involve substantial risk and are not suitable for all investors.