SOXL Options Are Pricing a $17.37 Move Into October 23. The Chart Model Sees a Slow Grind Lower
After a 33% five-session collapse, SOXL options price a $76.30–$111.04 range into the October 23 expiration, and premium is unusually rich against the stock's actual movement. Our positioning read is neutral, the chart model leans bearish, and here are three defined-risk ways to trade the gap.
Listen to this analysis — prefer audio? This SOXL outlook is also available as a podcast episode:
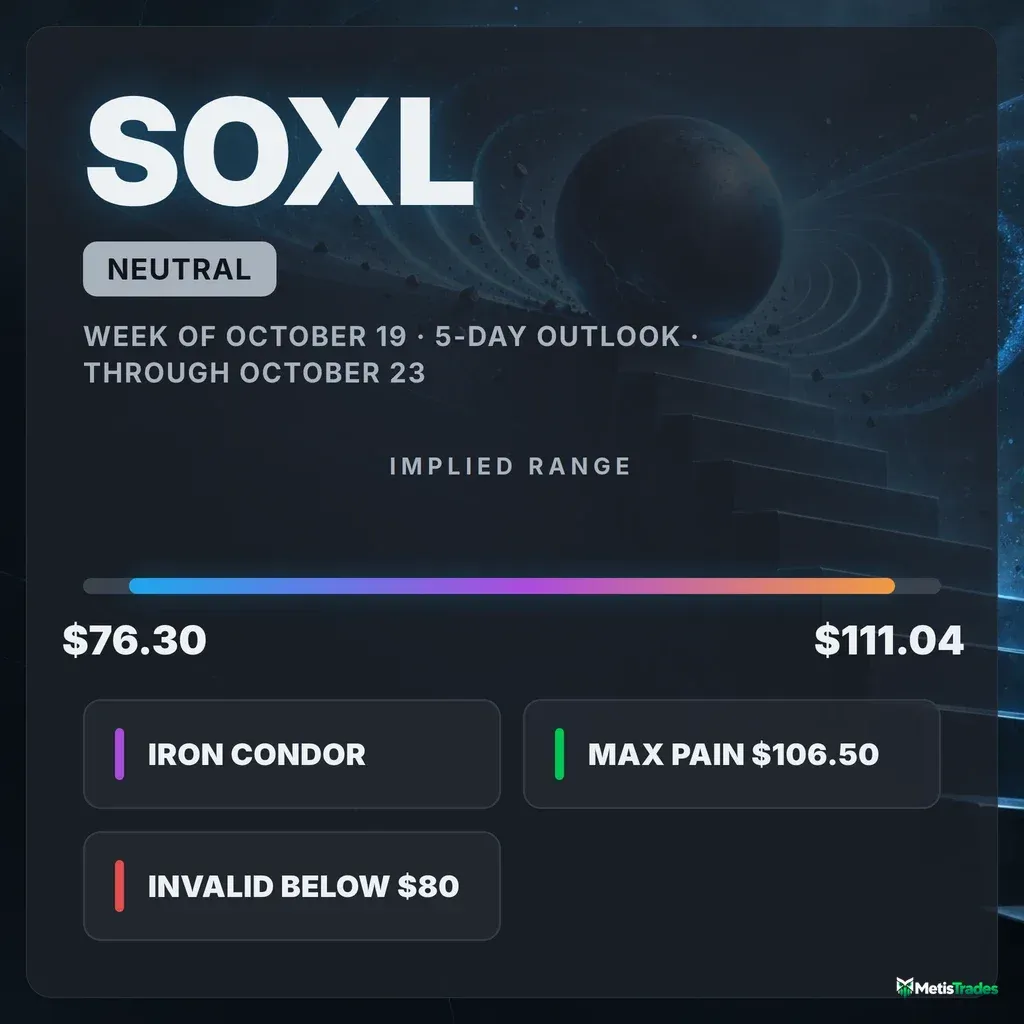
The options market implies a $76.30–$111.04 range into the October 23 expiration. Here is what's driving it and three defined-risk ways to trade it.
Published Sunday, October 18, 2026 · Data as of Friday, October 16, 2026 close
Explore the live SOXL options data in the Detailed Options Analyzer →
Quick answer
| Item | Answer |
|---|---|
| Market bias | Neutral |
| Options-implied range (into October 23) | $76.30 – $111.04 (±18.54%, about ±$17.37) |
| Major support | $80 put wall (October 23 expiration); nearer structural support at $91.50 |
| Major resistance | $150 call wall (October 23 expiration); nearer resistance at $99.25 and $106 |
| Max pain (October 23) | $106.50 |
| Dealer gamma regime (estimate) | Negative: hedging tends to amplify moves. Flip level: n/a (no flip estimate available) |
| Volatility condition | Rising. IV rank n/a today. Premium rich: options priced ~13.6 vol pts above delivered movement |
| Technical check | Diverges (bearish; 3-day target $90.80, 5-day target $91.50) |
| Best-fitting strategy | October 23 iron condor ($85/$80 puts, $105/$107.50 calls), only if you accept a lopsided risk/reward |
| Analysis invalidated if | SOXL closes below $80 |
1 · What matters today
SOXL, the 3x leveraged semiconductor ETF, closed Friday, October 16 at $93.67. That caps a roughly 33% drop in five sessions. The options market is now pricing a move of about $17.37 either way by the October 23 expiration, a range of roughly $76.30 to $111.04. That expected move is derived from what straddles cost.
Our positioning read comes out neutral. Price momentum is still heavily negative, but short-dated option flow has turned call-heavy, and spot sits low inside the expiration's widest option corridor. Those forces roughly cancel.
The standout fact is price. Options are unusually expensive compared with how much SOXL has actually been moving. That favors collecting premium over buying it, with strict risk limits.
The level that changes the picture is $80, the biggest pile of open puts for October 23. Both chart-model reads lean bearish, targeting the low $90s.
2 · What the options market is pricing
What changed this week
This was a liquidation week. SOXL fell 33.0% over five trading days, from $139.76 on October 9 to $93.67. It opened lower on five straight sessions, October 12 through October 16, and Friday's 5.74% gap-down left unfilled space up to $107.35.
Option volume ran at 2.3 times its 20-day average. Put/call volume ratio measures put activity relative to calls, and above 1 means puts dominate. It finished at 0.92, versus a 7-day average of 0.86 and a 14-day average of 0.84. Puts were a bit busier than normal, but there was no panic-style put stampede on the final day.
Our flow-momentum gauge printed −42. That is less negative than its 7-day average of −54 but far below its 14-day average of −17. The downside pressure is mostly the price drop itself feeding through, not a fresh wave of bearish bets.
Open interest means contracts currently held open. The largest open-interest jump on file was the November 20 $120 call, up about 19,000 contracts. However, total chain open interest jumped 50% in a way consistent with a data-coverage change, so we don't read that day-over-day change as new trader positioning.
The short- and long-term trend reads agree. SOXL is down over the past week, the past month (−24.3%) and the past two-plus months (−29.2%).
Expected move
The October 23 expiration carries an at-the-money implied volatility of 133.9%. Implied volatility is the market's estimate of how much SOXL will move, baked into option prices. That translates to a ±18.54% one-standard-deviation move, about ±$17.37 around the $93.67 snapshot price.
| Expiration | Implied move | Range around $93.67 |
|---|---|---|
| October 23 | ±18.54% | $76.30 – $111.04 |
| October 30 | ±25.79% | $69.51 – $117.83 |
| November 6 | ±31.09% | $64.55 – $122.79 |
| November 13 | ±34.67% | $61.19 – $126.15 |
The rungs widen more slowly than time alone would suggest. Front-week IV is the richest on the curve, so the market is charging the most, per day, for the next five sessions.
Volatility
The usual 52-week IV rank and the interpolated at-the-money IV are both unavailable today. Friday was an expiration day, which blanks those front-month readings, so we can't say where IV sits versus the past year.
What we can see is the direction. ATM IV climbed from about 105% on October 9 to roughly 119% by October 15. The October 23 contract now prices 133.9%, above the 30-day average of 110.3% but below the 90-day average of 146.5%.
Term structure compares option prices across different expiration dates. Read straight off the chain, it is inverted: IV slides from 133.9% in the front week to 117.5% for January. That is a stress signature, with near-term protection costing the most.
Two "vs its own norm" observations add color. These compare against SOXL's own recent history, so "unusual" means unusual for SOXL, not versus the broader market.
- Price momentum is running well below its usual range, even by this fund's standards.
- Despite the crash, 20-day realized volatility of about 111% is actually a bit below its recent norm, because September and early October were even wilder.
Premium rich or cheap? The volatility risk premium is the gap between how much movement options are priced for and how much SOXL has actually delivered. When it's positive, option sellers have been collecting more than realized movement cost them. As of the latest reading, options were priced about 13.6 vol points above SOXL's 20-day realized movement.
The VRP percentile shows where today's gap sits versus SOXL's own recent readings. At 92/100, this premium is richer than 92% of them. That is a sharp turn: the gap was negative as recently as October 9 and flipped positive on October 12, as option buyers rushed in faster than realized volatility caught up. SOXL is an ETF with no earnings report in play, so this richness has no scheduled-event explanation.
A 92nd-percentile premium over delivered movement favors collecting premium over the next five sessions, with defined risk, because the fund can still gap.
Skew and sentiment
Skew means that puts and calls the same distance from the stock price don't cost the same. When puts are pricier, traders are paying up for crash protection. Today 25-delta puts trade at 134.6% IV versus 116.8% for calls, a gap of about 17.8 vol points. The few recent readings on file averaged roughly 16 points over seven days and 13 points over fourteen, so downside protection got steeper into Friday. Traders are still paying a premium to protect against further drops.
Put/call open interest stands at 2.65, meaning 2.65 puts held open for every call, versus a 7-day average of 2.45 and a 14-day average of 1.71. The coverage caveat above applies to this figure too.
Sentiment by expiration date is split, and we read it as mixed:
- 0–7 days: strongly call-leaning at +78, versus a 7-day average of +30.
- 7–30 days: slightly put-leaning at −4, versus a 7-day average of −12.
Short-dated traders are reaching for a bounce while the one-month window stays cautious. Unusual call-side sweeps also ran somewhat above their norm for this fund on Friday.
The key levels map
| Level | Price | Why it matters |
|---|---|---|
| Call wall (October 23 expiration) | $150 | Heaviest call open interest for the expiration (2,958 contracts). Far above the implied range, so effectively out of play. |
| 20-day moving average | $141.49 | Price is 33.8% below it, a measure of how stretched the drop is. |
| 50-day moving average | $129.38 | Longer trend reference, 27.6% overhead. |
| 200-day moving average | $122.10 | Price is 23.3% below its long-term trend line. |
| Whole-chain call wall | $120 | Heaviest call strike across all expirations (32,064 contracts, mostly November 20). |
| Top of implied range | $111.04 | The options market's +1σ rail for October 23. |
| Unfilled gap | $107.35 | Thursday's close, left behind by Friday's gap-down. |
| Max pain (October 23) | $106.50 | The price where the most option value would expire worthless. Expirations sometimes gravitate toward it, but it sits 13.7% above spot. |
| Swing resistance | $106 | Recent pivot cluster, a heuristic level. |
| Whole-chain put wall / largest gamma strike | $100 | The biggest put pile across all expirations (59,369 contracts) and the strike with the most gamma, a natural magnet. |
| Swing resistance | $99.25 | First overhead pivot. |
| Chart-model resistance (VWAP) | $98.40 | Both technical reports' invalidation line. |
| Spot (Friday close) | $93.67 | Starting point. |
| Lower Bollinger Band | $91.84 | Chart-model support that price is pressing against. |
| Swing support | $91.50 | The only nearby price-structure support. |
| Large gamma strike | $90 | Second-largest gamma concentration in the chain. |
| Put wall (October 23 expiration) | $80 | Biggest put pile for the expiration (7,416 contracts). These often act like barriers, and this one is our invalidation line. |
| Bottom of implied range | $76.30 | The options market's −1σ rail for October 23. |
The October 23 expiration's own walls ($150 and $80) differ sharply from the whole chain's heaviest strikes ($120 and $100). For the next five sessions, we treat the expiration-specific levels as primary.
Positioning and unusual flow
Market makers hedge the options they've sold. Under a common but unverified convention, one rough estimate places them in a negative gamma regime, both across the whole chain and for October 23 specifically. In this regime their hedging tends to amplify moves rather than dampen them. That fits the week's one-way gaps and argues against expecting a quiet pin. No flip-level estimate is available in this export.
Friday's notable live flow, all in the October 23 expiration:
- $90 puts: 26,497 contracts traded, nearly four times the 6,823 left open, about $14.2 million in premium. This was the single heaviest live contract and sits right at the chart model's target zone.
- $100 calls: 5,296 contracts traded against just 507 open, about $2.25 million. Someone was buying a rebound toward the whole-chain put wall.
- $100 puts: 4,669 contracts, about $4.88 million.
Taken together, traders were both hedging into the low $90s and betting on a bounce to $100. That two-sided flow is a large part of why our read lands neutral.
3 · Technical check
Both chart-model reports, dated October 18, are fresh and anchored to essentially the same price ($93.68).
- 3-day report: bearish, target $90.80 by October 21, projected range $88.00–$95.00.
- 5-day report: bearish, target $91.50 for the October 23 window, projected range $89.00–$96.50.
Both targets sit comfortably inside the options-implied range. Their bearish direction against our neutral read makes this a Diverges. The most decisive indicator is trend strength: an ADX near 54, with sellers' directional index far above buyers'. Both reports also flag oversold momentum and a marginal MACD uptick, so they assign roughly one-in-three odds to a relief bounce. Both put invalidation at a close above $98.40.
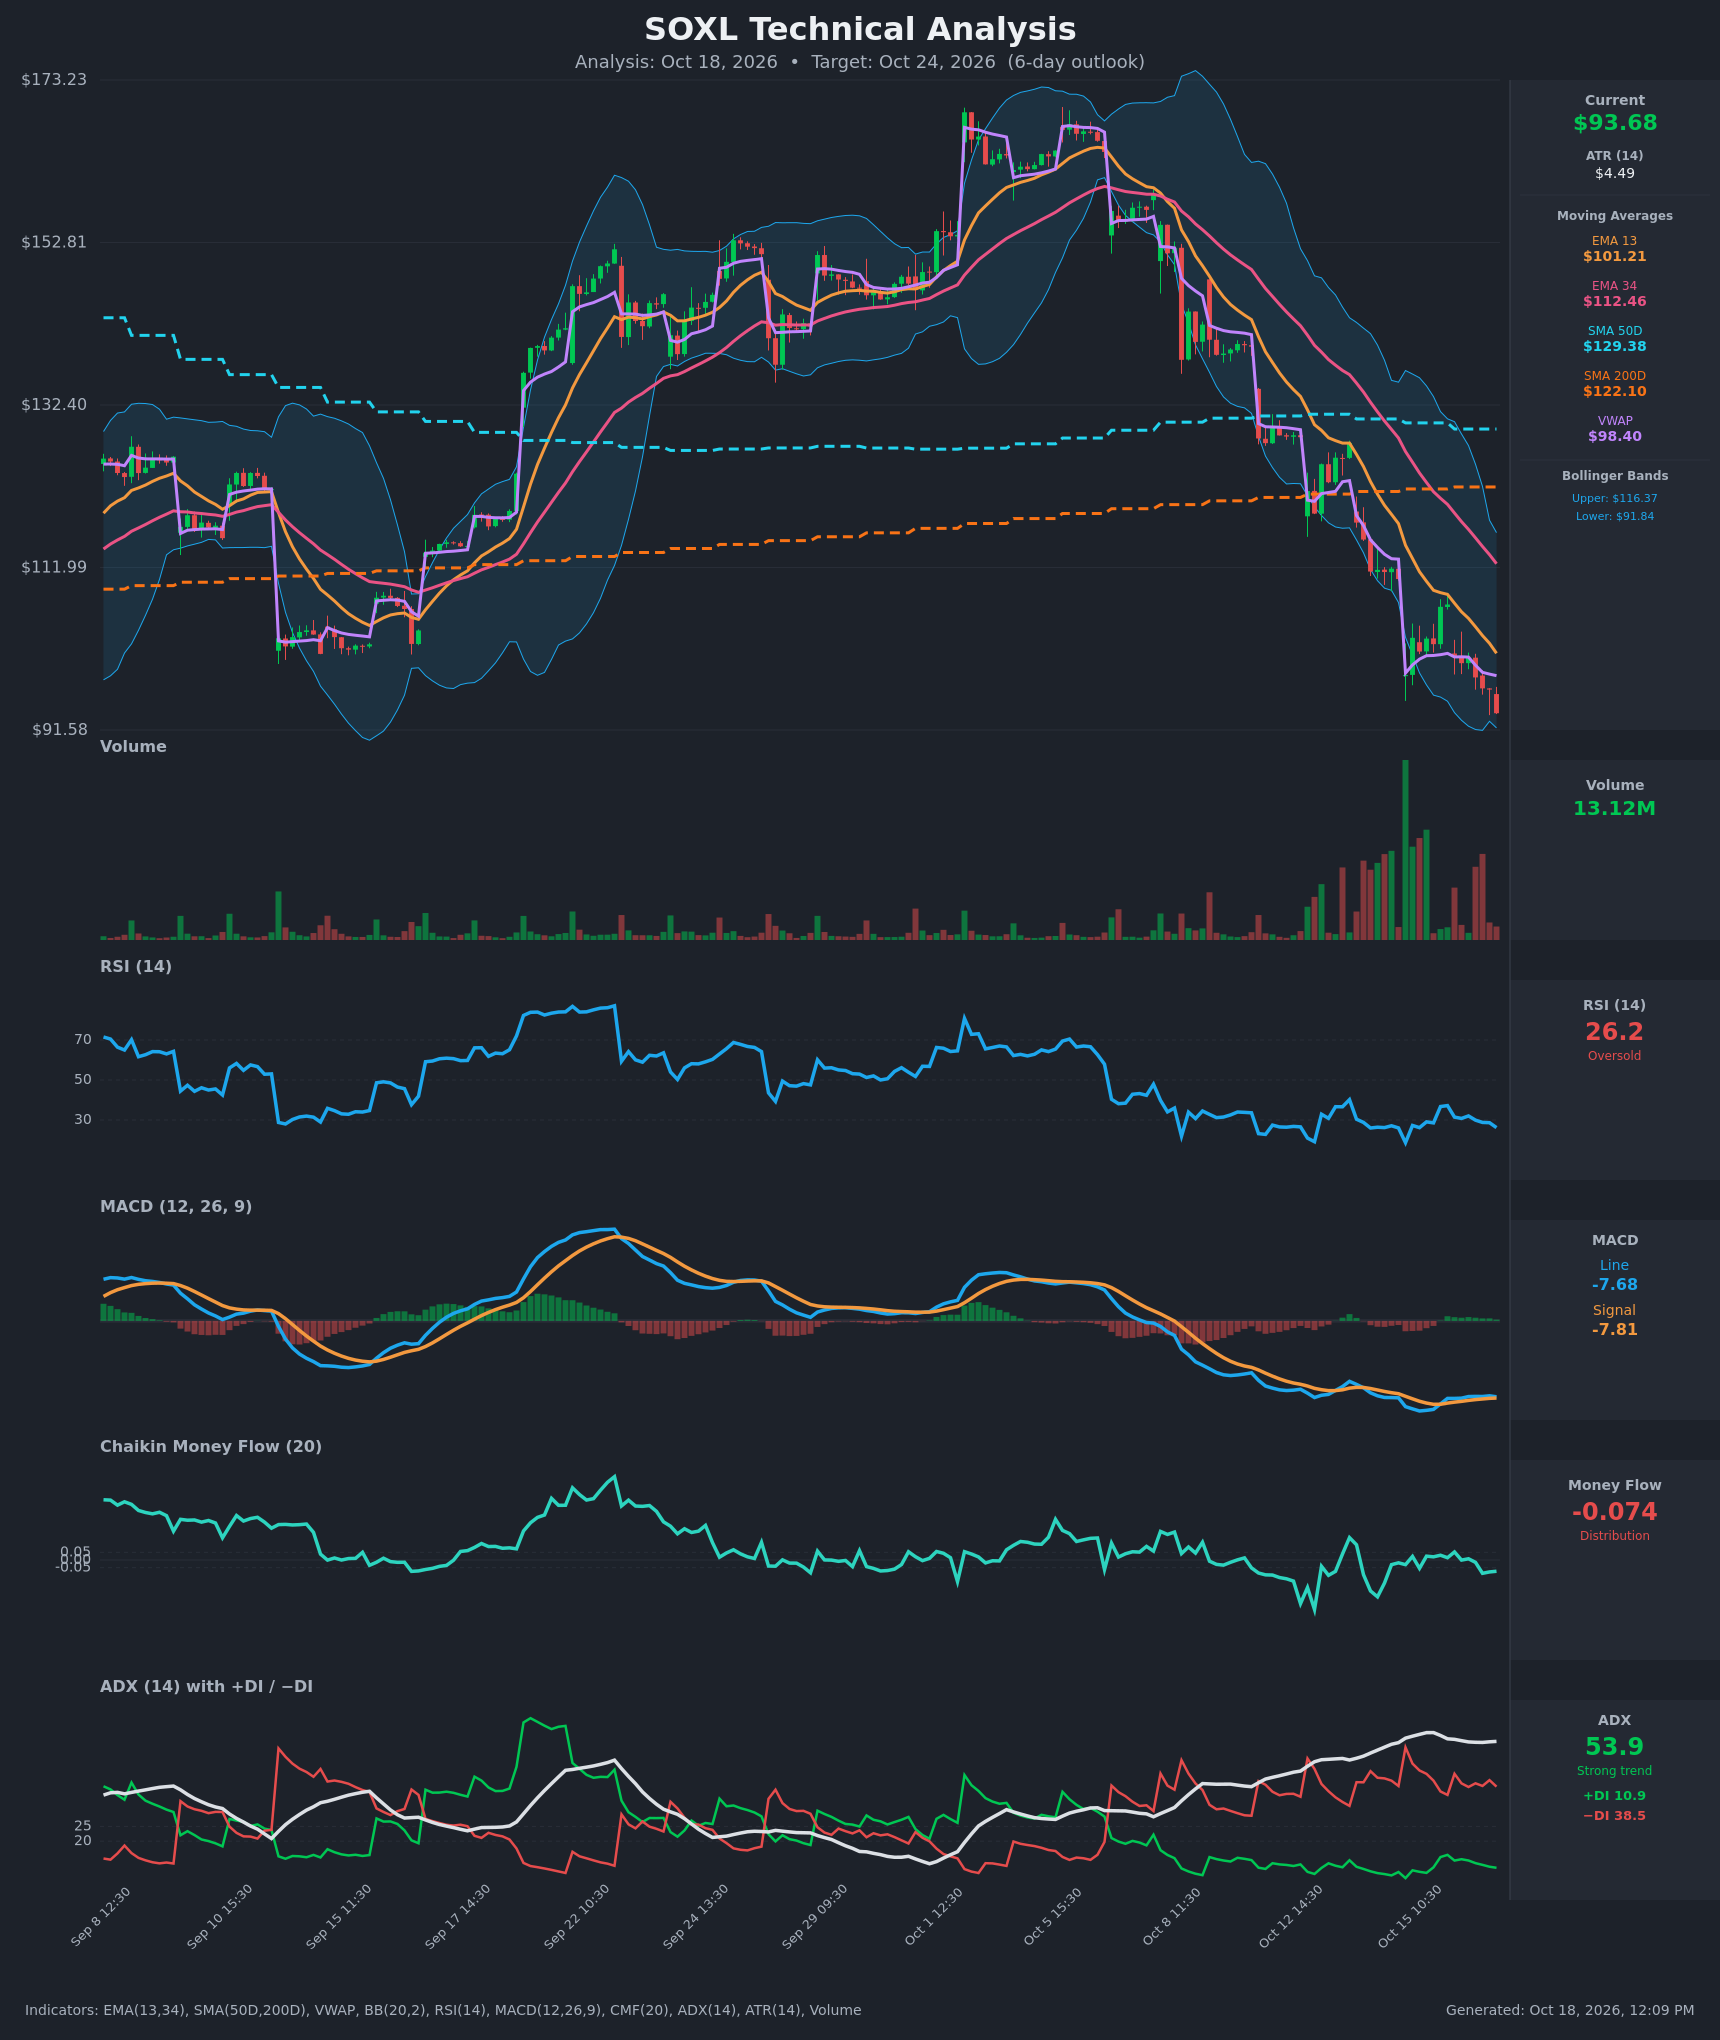
Model vs. Market: The options market implies $76.30–$111.04 into October 23; the 5-day technical model targets $91.50. The chart sees a slow drift a couple of dollars lower, while options are priced for a far larger swing in either direction. If SOXL simply grinds into the low $90s, the people who sold that expensive premium win.
The TA nudged strike selection in two ways. Our bearish spread targets the $95–$90 zone, and the short put of the range trade sits at $85, below both models' projected lows.
Full technical write-ups: 3-day report → · 5-day report →
4 · Three ways the next five days can go
If SOXL rebounds toward max pain and the gap ($106–$107.35): A rebound would run into thin positioning. The October 23 call wall sits far away at $150, so there is little call open interest to slow a squeeze. In a negative-gamma regime, a reclaim of $98.40–$100 could accelerate toward max pain at $106.50 and the gap fill at $107.35, roughly where the top of the range trade's call spread sits.
If SOXL chops between $88 and $100: This is the case both chart models and the rich premium point to. The whole-chain $100 put wall and the heavy $90 gamma strike bracket the action, and inflated option prices bleed as sessions pass without another gap. The credit structures below are built for this branch.
If SOXL breaks below $88 and heads for the $80 put wall: This is the acceleration case. With an estimated negative-gamma backdrop, hedging can add to selling rather than cushion it. The $80 wall is the last large concentration before the $76.30 lower rail. A close below $80 would mean the selling has overrun the market's own map, which is our invalidation.
5 · Three defined-risk structures
Prices are end-of-day midpoints as of October 16, 2026. All structures are hypothetical. Verify live prices before trading, because these will be stale by the open.
Because premium is running near the top of its recent range, the premium-selling structures lead. In a credit spread you collect cash up front and keep it if the stock stays away from your short strike. In a debit spread you pay up front and profit if the stock moves toward your target.
If you expect the range to hold: October 23 iron condor
- Trade: Sell the $85 put, buy the $80 put, sell the $105 call, buy the $107.50 call, all expiring October 23.
- Credit: $1.405 ($140.50 per condor)
- Max profit: $140.50 if SOXL closes between $85 and $105
- Max loss: $359.50 below $80 ($109.50 above $107.50)
- Break-evens: $83.60 and $106.41
- Why it fits: Premium is richer than 92% of SOXL's recent readings, and both chart models project a $88–$96.50 window. The short call sits just under max pain ($106.50) and swing resistance ($106). The long call sits just past the $107.35 gap. The long put sits on the $80 put wall.
- Makes sense only if: You accept a lopsided risk/reward, risking about $3.60 to make $1.40 on the downside, in exchange for a wide profit zone.
- Invalidated if: SOXL closes below $85 or above $105.
- Managing it: Close at about 50% of the credit. Reassess at the October 21 halfway checkpoint, and exit by October 22 rather than carrying it into expiration in a negative-gamma tape.
- Liquidity note: The $80 puts traded only 4¢ wide. The $85 puts were 73¢ wide (about 22% of mid) and the $107.50 calls 33¢ wide, so work limit orders near mid and expect some slippage.
- Analyze this position →
If you lean bullish: October 23 $90/$80 put credit spread
- Trade: Sell the October 23 $90 put, buy the October 23 $80 put.
- Credit: $2.95 ($295 per spread)
- Max profit: $295 if SOXL closes at or above $90
- Max loss: $705
- Break-even: $87.05
- Why it fits: You are selling the most heavily traded, richly priced put on the board ($90, 144% IV) and buying protection at the $80 put wall. Short-dated sentiment has also turned call-heavy.
- Makes sense only if: The $91.50 swing support and the lower Bollinger Band ($91.84) attract dip buyers.
- Invalidated if: SOXL closes below $88.
- Managing it: All three trend horizons still point down, so take profits early, around 50% of the credit. Close if SOXL settles below $90 rather than hoping for a recovery.
- Liquidity note: The $90 puts were 30¢ wide on $14 million of traded premium, and the $80 puts were 4¢ wide. Fills should be easy.
- Analyze this position →
If you lean bearish: October 23 $95/$90 put debit spread
- Trade: Buy the October 23 $95 put, sell the October 23 $90 put.
- Debit: $2.225 ($222.50 per spread)
- Max profit: $277.50 if SOXL closes at or below $90
- Max loss: $222.50
- Break-even: $92.78
- Why it fits: Both chart models target $90.80–$91.50, with trend strength firmly bearish. Selling the expensive $90 put offsets much of the rich premium you'd otherwise overpay for.
- Makes sense only if: The $91.84 lower band gives way with hourly closes below it.
- Invalidated if: SOXL closes above $98.40.
- Managing it: Take profits near $90. Cut the position if the October 21 checkpoint finds SOXL back above $96.50.
- Liquidity note: The $95 puts were 45¢ wide and the $90 puts 30¢ wide, both around 6% of mid. Acceptable, but use limits.
- Analyze this position →
If none of these: no trade
Rich premium is not free premium on a 3x leveraged fund that just gapped lower five sessions running. The estimated negative-gamma backdrop means one more overnight gap could blow through any short strike before you can react. Every credit structure here risks well more than it collects.
If you can't monitor the position daily, or can't stomach a full max loss in one session, standing aside beats selling this premium. Waiting for the October 21 checkpoint to show whether $91.50 holds is a legitimate choice.
6 · Quick FAQ
What is SOXL's expected move this week? About ±$17.37 (±18.54%) into the October 23 expiration, a $76.30–$111.04 range, per straddle pricing as of the October 16 close.
Is SOXL expected to go up or down over the next five days? Options positioning as of October 16 is neutral. Bearish price momentum is offset by call-heavy short-dated flow, so this is a read of what traders have done, not a forecast. The actionable map is the $76.30–$111.04 range, with $80 support and $150 call-wall resistance for October 23.
Are SOXL options expensive right now? IV rank is unavailable today because of Friday's expiration. On the second lens, options are running about 13.6 vol points above the movement SOXL has actually delivered, richer than 92% of the fund's own recent readings. That favors selling premium, with defined risk.
Where is SOXL's biggest options support and resistance? For October 23, the put wall is $80 and the call wall is $150. Across the whole chain, the heaviest strikes are $100 (puts) and $120 (calls).
What invalidates this read? A close below $80, the October 23 put wall.
Methodology & disclosures. Data: end-of-day options-chain snapshot for SOXL, 2026-10-16, generated 2026-10-18T12:09:09.829Z. Prices shown are midpoints and will differ from live markets. Momentum/positioning scores and volatility-premium comparisons are descriptive measurements of past option flow and past price movement — not investment advice, signals, forecasts, or guarantees. All trade structures are hypothetical. Every structure shown has a defined maximum loss; you can lose the entire max-loss amount. Options involve substantial risk and are not suitable for all investors.