SOXL Options Are Pricing a $15.71 Move Into Friday — Our Chart Model Sees $126.50
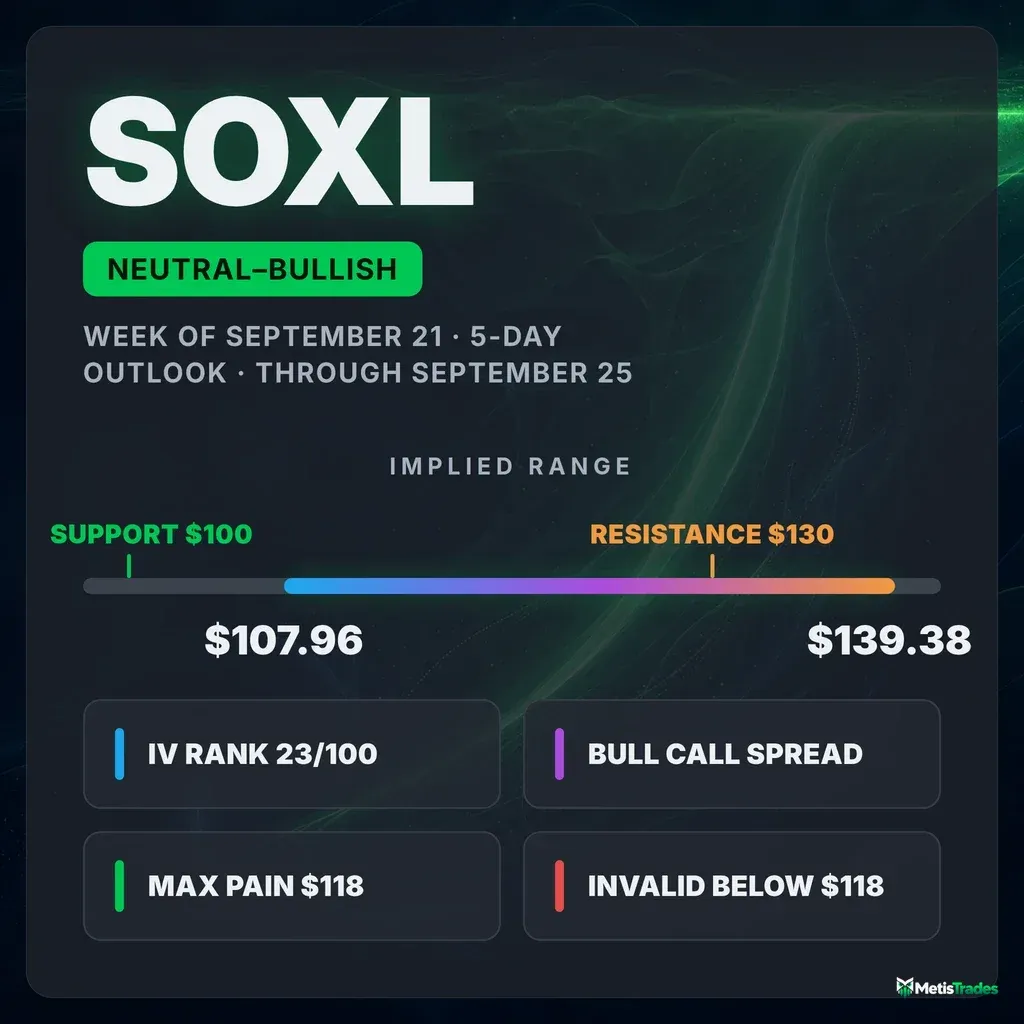
The options market implies SOXL trades between $107.96 and $139.38 by the September 25 expiration, while the chart model projects a band barely a quarter that wide. Here's what the positioning says, where the walls sit, and three defined-risk ways to trade the gap.
Listen to this analysis — prefer audio? This SOXL outlook is also available as a podcast episode:
The options market implies a $107.96–$139.38 range into the September 25 expiration; here's what's driving it, where the walls sit, and three defined-risk ways to trade it.
Published Sunday, September 20, 2026 · Data as of Friday, September 18 close · Export generated 2026-09-20 17:49 UTC
Explore the live SOXL options data in the Detailed Options Analyzer →
Quick answer
| Item | Answer |
|---|---|
| Market bias | Neutral-bullish (slightly bullish lean) |
| Spot (Friday, September 18 close) | $123.67 |
| Options-implied range (into September 25) | $107.96 – $139.38 (±$15.71, ±12.70%) |
| Major support | $100.00 (September 25 put wall) |
| Major resistance | $130.00 (September 25 call wall) |
| Max pain (September 25) | $118.00 |
| Dealer gamma regime (estimate) | Positive — hedging tends to dampen moves; flip level ≈ $121 |
| Volatility condition | Flat on the week, far lower over a month — IV rank 23/100 · premium thin: options priced about 6.9 vol points below delivered movement |
| Technical check | Confirms (bullish, 3-day and 5-day) — but with a far narrower target band |
| Best-fitting strategy | September 25 $125/$130 bull call debit spread |
| Analysis invalidated if | SOXL closes below $118 |
1 · What matters today
SOXL closed Friday, September 18 at $123.67 after a violent round trip: a 16.7% gap down on September 14 took it to $101.13, and four straight up-gaps clawed it all the way back. Our read of options flow leans mildly bullish — short-dated positioning turned decisively call-heavy, and for every call contract held open there are now just 0.78 puts, down from about 1.21 on a two-week average. Traders have been retiring downside protection, not adding it.
The map for the next five days is simple. The options market is pricing a $15.71 move either way into the September 25 expiration — a $107.96 to $139.38 range. Overhead, the heaviest pile of open call contracts sits at $130. The level that changes the picture is $118: a close below it kills this read. The chart models agree on direction but expect a much smaller move.
2 · What the options market is pricing
What changed this week
The five-day price change is a tidy +1.52%, which hides everything interesting. SOXL gapped down 16.66% on September 14, then gapped up on each of the next four sessions (+3.38%, +5.00%, +9.00%, +1.92%). The rebuild showed up in positioning rather than in volatility pricing: the market's estimate of future movement baked into option prices barely budged, up 0.22% day over day and 0.86% over five sessions, leaving IV rank at 23/100 against a 7-day average of 27.5 and a 14-day average of 30.8.
Where money actually moved was the call side. Call open interest grew by 12,138 contracts on Friday while put open interest shed 27,840. That dropped the put/call open-interest ratio — how many puts are held open for every call — to 0.78, versus a 7-day average of 1.21 and a 14-day average of 1.15. A week ago the chain leaned protective; on Friday it leaned long. The single biggest forward-looking build was the September 25 $130 call, which went from an unlisted strike to 7,401 contracts held open, with 2,221 changing hands for roughly $794,000 of premium. Into Friday's now-settled expiration, the $120 calls traded 16,055 contracts ($6.4 million of premium) — that flow is history, but it tells you where the week's fight was. Notably, total option volume ran at 0.96× its 20-day average: a huge price week on unremarkable option turnover.
One tension worth naming. The short- and medium-term trend reads are flat (price +1.5% over a week, +1.2% over 20 sessions), but the long read is firmly negative: SOXL is down 35.7% over roughly two months. The near-term flow and the bigger trend are pointing different ways, which argues for shorter-dated directional structures and taking profits early rather than pressing.
Expected move
Into September 25, the options market is pricing a move of ±$15.71, or ±12.70% — that's the move implied by what at-the-money straddles cost, the standard one-standard-deviation approximation. Around Friday's $123.67 close that maps to $107.96 on the downside and $139.38 on the upside.
| Expiration | Implied move | Range around $123.67 |
|---|---|---|
| September 21 (3 DTE) | ±5.19% | $117.25 – $130.09 |
| September 23 (5 DTE) | ±8.62% | $113.01 – $134.33 |
| September 25 (7 DTE) | ±12.70% | $107.96 – $139.38 |
| October 2 (14 DTE) | ±18.76% | $100.47 – $146.87 |
The rungs do not scale smoothly: the September 21 contracts carry an at-the-money volatility of about 57%, while September 25 carries about 92% and October 2 about 96%. Traders are pricing the first two sessions as comparatively calm and everything from mid-week onward as wide open.
Volatility
Chain-wide at-the-money implied volatility sits at 106.8% — enormous in absolute terms, but that is normal for a 3x leveraged semiconductor fund. The number that matters is IV rank: 23/100 means today's reading is cheaper than about 77% of the past year's. Implied volatility has compressed hard, down 33.9% over 30 days, and sits well under both its 30-day average (119.5%) and its 90-day average (154.7%). The front-month read is unavailable today — Friday was an expiration day, so that tenor can't be interpolated.
Two observations versus this stock's own recent history. Twenty-day realized volatility — how much SOXL has actually been moving — is running at 113.6%, which is below this name's own norm. But the five-day-to-twenty-day realized ratio is 1.57, a reading far above anything typical for SOXL: movement has accelerated sharply in the last week even as the monthly average stayed contained. That is exactly what a cluster of 5–16% gaps does to the math.
Premium rich or cheap? The gap between how much movement options are priced for and how much SOXL has actually delivered is currently negative: options are priced roughly 6.9 vol points below the stock's delivered 20-day movement. That gap sits at the 59th percentile against this stock's own recent readings — richer than 59% of them, which tells you SOXL usually prints an even more negative gap. On the path: the gap was about +22 vol points rich on September 8 and flipped negative around September 14, when the 16.7% gap-down entered the 20-day realized window. That flip is mechanical, not a trader signal. The combination — IV rank 23/100 and a negative premium over delivered movement — favors owning premium rather than collecting it this week. Anyone selling weekly options here is collecting less than this stock has actually been paying out in movement.
Skew and sentiment
Friday's chain didn't print a 25-delta call volatility, so today's put-versus-call skew — whether puts and calls the same distance from spot cost the same — is unavailable. What did print: the 25-delta put at 116.6% implied volatility, and across the handful of recent sessions that produced a clean reading, puts ran about 5 vol points over calls. That's the normal state for this fund; traders routinely pay up for crash protection here.
Sentiment in short-dated options is where the story is. The 0–7 day bucket scores +51 and the 7–30 day bucket +46, both strongly call-tilted, against 7-day averages of +16 and +22. Inside the front bucket, delta-weighted volume ran +0.69 to the call side, and the 25-delta risk reversal — a direct measure of call pricing versus put pricing — printed +2.5 vol points against a 44-day baseline of −57.4. Calls are roughly 60 vol points richer relative to puts than this name's own recent norm. Further out the picture fractures: the 30–60 day bucket reads −18 while the 60–120 day bucket reads +20, which is why the overall regime reads as mixed rather than uniformly bullish. Put/call volume finished at 0.77, below the 60-day median of 0.83 and in line with the 14-day average of 0.765. Two other readings stand out versus this stock's own norm: call-side sweeps in the peer-unusual set and net new call open interest were both unusually heavy for SOXL.
One market-wide note: the VIX closed at 14.81, near the bottom of its 52-week range, and SOXL's own implied volatility has tracked it with a 0.58 correlation over the past 60 sessions. Broad-market calm is part of why this fund's options are cheap relative to its own history despite the gaps.
The key levels map
| Level | Price | Why it matters |
|---|---|---|
| Implied range top (Sept 25) | $139.38 | Upper edge of the move options are pricing |
| Swing resistance | $135.02 | Heuristic pivot cluster; next call OI shelf above $130 |
| Call wall (Sept 25) | $130.00 | 7,401 calls held open at this strike for Friday — and the whole chain's heaviest call strike too (21,253). Also the single largest gamma strike; rallies tend to slow here |
| 50-day moving average | $128.96 | Price sits 4.1% below it; the chart model's named overhead resistance |
| Swing resistance | $128.48 / $124.88 | Recent pivot clusters directly overhead |
| Spot | $123.67 | Friday's close |
| Gamma flip level (estimate) | ≈ $121 | One rough estimate places the pivot here; spot is sitting unusually close to it for this name |
| Heavy gamma / call strike | $120.00 | Second-largest gamma strike across the chain (17,682 calls open) |
| Max pain (Sept 25) | $118.00 | Where the most option value would expire worthless; expirations sometimes gravitate toward it |
| Swing support | $116.47 | Nearest heuristic support below spot |
| 20-day moving average | $114.01 | Price is 8.5% above it — the bounce is stretched |
| 200-day moving average | $112.35 | Price 10.1% above; longer-term structure still intact |
| Implied range floor (Sept 25) | $107.96 | Lower edge of the priced move |
| Swing support | $106.00 | Prior pivot cluster |
| Put wall (Sept 25) | $100.00 | 4,427 puts held open for Friday — and the whole chain's heaviest put strike (11,749). The main downside shelf |
Unusually, the September 25 expiration's own walls match the whole chain's aggregate walls exactly: $130 on the call side, $100 on the put side. That rarely happens, and it means this week's map and the bigger structural map are the same map.
Positioning and unusual flow
Market makers hedge the options they've sold, and one rough estimate of that positioning reads positive both across the whole chain and specifically for the September 25 expiration — in that regime, hedging flows tend to dampen moves rather than amplify them. The same estimate places the pivot near $121; spot closed $0.67 above it, which is unusually close for this name. Treat all of that as an estimate built on an assumed dealer convention, not observed inventory.
Three pieces of live flow stood out. The September 25 $130 call: 2,221 contracts traded into a brand-new 7,401-contract open-interest pile, about $794,000 of premium, building the exact wall that now caps the week. The September 21 $118 put: 1,651 contracts against just 70 held open — a 23-times turnover, short-dated downside protection bought in size for the first two sessions. And the September 21 $119 call: 1,307 contracts against 85 open. On the support side, the September 25 $100 put added 810 contracts of open interest on 4,036 traded, thickening the put wall.
3 · Technical check
Both chart-model reports run bullish and both classify as confirming the options read on direction — their targets sit comfortably inside the options-implied range. The 3-day report (target date September 23) projects $127.00 with a band of $118.50 to $129.00. The 5-day report (target date September 25, matching our expiration) projects $126.50 with a band of $119.50 to $127.50. Both cite the same evidence: a trend-strength reading of 26.5 and rising with buyers strongly dominant, a fresh momentum crossover, and accumulation-side money flow. Both also flag the same brake: a 14-period RSI at 72 (overbought) with price pinned to the upper volatility band, and a declining 50-day average at $128.96 that has capped every rally attempt for a month.
Where the two disciplines genuinely part company is magnitude, not direction. The options market is pricing a ±$15.71 move; the 5-day chart model expects an $8 band. One of those is wrong, and the resolution is simple to watch: if SOXL spends Monday and Tuesday drifting inside $119–$127, the chart model's narrow view is winning and the front-week straddle is decaying. If a single session gaps 5%+ again — four of the last five did — the options are correctly priced and the model's band breaks on day one.
Model vs. Market: The options market implies $107.96–$139.38 into September 25; the 5-day technical model targets $126.50 inside a $119.50–$127.50 band. The market is paying for gap risk the chart can't see; the chart is betting that last week's gap cluster is over.
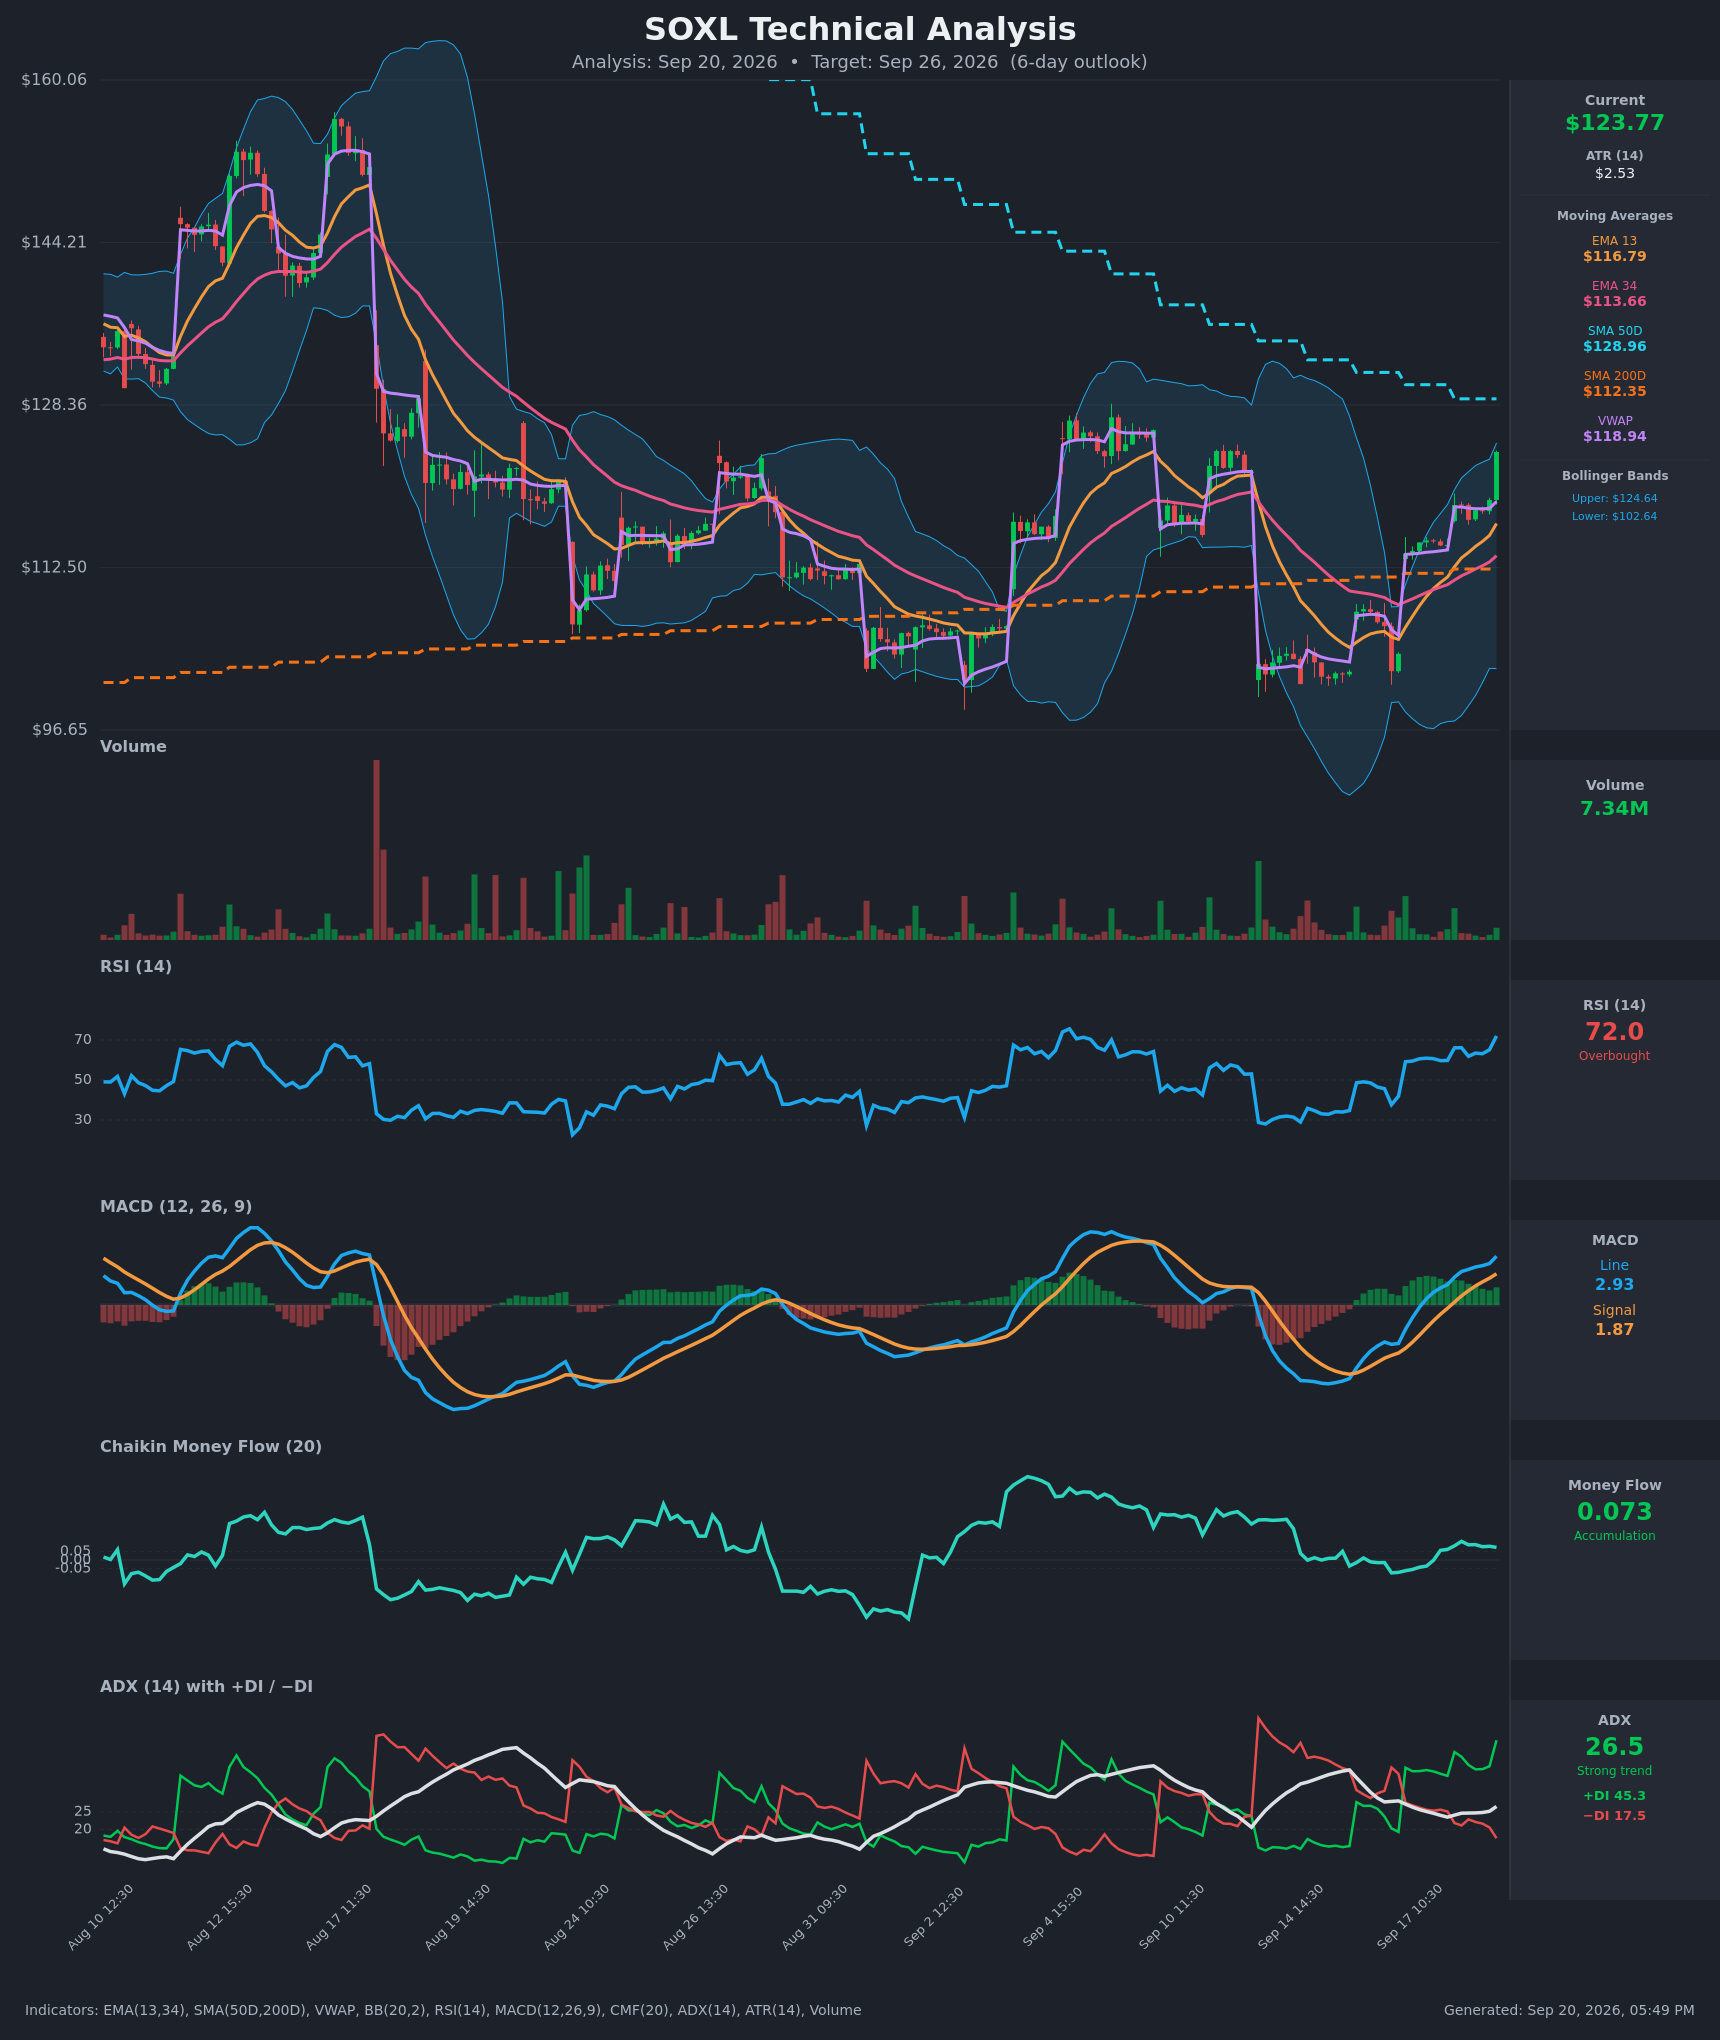
The technical read did shade strike selection below: the chart model's $128.96 resistance and the $130 call wall land within a dollar of each other, so both the bullish spread's short leg and the condor's short call sit at $130 rather than higher.
Full technical write-ups: 3-day report → · 5-day report →
4 · Three ways the next five days can go
If SOXL pushes above the call wall ($130): That strike now carries 7,401 contracts of open call interest for Friday and is the heaviest call line in the entire chain. The 50-day average at $128.96 sits right underneath it, so the $129–$130 zone is where a rally has to earn its way through. Positioning of that density tends to slow advances; a clean break through it leaves thinner overhead until roughly $135, which is the next meaningful call shelf.
If SOXL drifts between the walls: This is the base case the estimated dealer positioning supports. With the hedging estimate reading positive for the September 25 expiration, flows tend to cushion rather than chase, and expiring open interest tends to exert a mild pull toward max pain at $118 — about 4.6% below Friday's close. A week that opens quiet and stays inside $119–$130 would drain the front-week straddle quickly and vindicate the chart model's narrow band.
If SOXL breaks below the gamma flip and heads for the put wall ($100): Spot closed only 0.5% above the estimated flip at $121 — unusually tight for this name. Below that level, one rough estimate suggests market-maker hedging stops cushioning and starts amplifying selling. Below $118 the read is dead; the next shelves are the 20-day average at $114.01, the swing cluster at $106, and then the put wall at $100, which is where the heaviest downside open interest sits for Friday.
5 · Three defined-risk structures
Prices are end-of-day midpoints as of Friday, September 18. All structures are hypothetical. Verify live prices before trading — these will be stale by the open. SOXL's weekly quotes were wide at Friday's close; work orders and do not pay the ask.
Because options are currently priced below the movement SOXL has actually delivered, the debit (long-premium) structures lead here and the credit structure comes last with a warning attached.
If you lean bullish: September 25 $125/$130 bull call debit spread
- Trade: Buy the September 25 $125 call, sell the September 25 $130 call. You pay a net debit and you're betting SOXL finishes at or above $130 on Friday.
- Debit: $1.78 · Max profit: $322.50 · Max loss: $177.50 · Break-even: $126.78
- Why it fits: It leans with the mildly bullish positioning read and with both chart models, it buys rather than sells premium in a week where implied volatility sits 6.9 vol points under delivered movement and IV rank is just 23/100, and its short strike is parked exactly at the $130 call wall — the level positioning says is hardest to clear.
- Makes sense only if: You think last week's four consecutive up-gaps have another leg and $128.96–$130 gets taken out rather than rejected.
- Invalidated if: SOXL closes below $118.
- Managing it: Take profits into strength rather than holding for the full width — the short-term bounce is fighting a stock still down 35.7% over two months, and the 50-day average has rejected every rally for a month. Close at roughly 60–70% of max value, or exit by Wednesday, September 23 if SOXL is still stuck under $125.
- Liquidity note: The $130 calls quoted 25¢ wide (about 7% of mid) on 2,221 contracts traded — easy. The $125 calls quoted $4.70 bid / $6.00 ask, roughly 24% of mid, though 1,341 contracts traded and $717,000 of premium changed hands; that leg is the slippage risk, so leg in on a limit rather than crossing the spread.
- Analyze this position →
If you lean bearish: September 25 $120/$110 bear put debit spread
- Trade: Buy the September 25 $120 put, sell the September 25 $110 put. Net debit; you profit if SOXL falls toward or through $110.
- Debit: $2.43 · Max profit: $757.50 · Max loss: $242.50 · Break-even: $117.58
- Why it fits: It expresses the max-pain pull to $118 and the longer trend read, and it does so by owning cheap premium rather than selling it. The break-even sits right at the $118 level that also invalidates the bullish case, and the long strike sits just below the estimated $121 gamma flip — the level below which one rough estimate says hedging starts amplifying declines.
- Makes sense only if: You read last week's recovery as an oversold bounce into supply rather than a trend change, with price 8.5% above its 20-day average.
- Invalidated if: SOXL closes above $130 — the call wall and the 50-day zone cleared together.
- Managing it: This is a five-day trade against a short-term uptrend; take 50% of max value if it comes quickly and don't hold a losing position into Friday hoping for a gap.
- Liquidity note: The $120 puts quoted $3.75 / $4.45 (70¢ wide, ~17% of mid) on 749 contracts; the $110 puts quoted $1.55 / $1.80 (25¢ wide) on 1,764 contracts. Both are among the more active put lines for the week.
- Analyze this position →
If you expect the range to hold: September 25 $110/$115/$130/$135 iron condor
- Trade: Sell the $115 put / buy the $110 put, and sell the $130 call / buy the $135 call, all September 25. You collect a credit up front and keep it if SOXL finishes between $115 and $130.
- Credit: $2.53 · Max profit: $252.50 · Max loss: $247.50 · Break-evens: $112.48 and $132.53
- Why it fits: The short strikes sit on the two heaviest, most-traded lines that bracket spot — $130 is the call wall and $115 is one of the densest put clusters — and the estimated positive gamma regime for this expiration is the condition under which hedging flows dampen rather than chase. It also matches the chart models' narrow $119–$127.50 bands.
- Health warning: You're selling premium that hasn't been rich lately. Options are priced roughly 6.9 vol points below what SOXL has actually delivered over 20 days, and both break-evens sit well inside the $107.96–$139.38 move the market is pricing. Four of the last five sessions gapped more than 1.9%, three of them more than 3%. This is the structure that loses hardest if the gap cluster continues.
- Makes sense only if: You specifically believe the gap sequence is exhausted and that a mean-reverting drift toward $118 max pain is the likeliest path.
- Invalidated if: SOXL closes below $118 or above $130 — either close puts the structure under pressure and eliminates the pin case.
- Managing it: Close at roughly 50% of max credit; exit regardless by Wednesday, September 23 rather than carrying gamma risk into Friday. If SOXL closes through either short strike, close the tested side rather than hoping.
- Liquidity note: The $130 calls traded 25¢ wide on 2,221 contracts and the $135 calls 44¢ wide on 1,139; the $115 puts quoted 73¢ wide (about 28% of mid) on 1,353 contracts and the $110 puts 25¢ wide on 1,764. Submit as a single four-leg order at a limit — legging this in will cost more than the edge.
- Analyze this position →
If none of these: no trade
There is a real case for standing aside. The directional lean here is mild, not emphatic: only three of the five inputs behind it registered as directional at all, and the wall-position input actively argues the other way, with spot sitting much closer to the $130 call wall than to the $100 put wall. Meanwhile the premium picture offers no gift in either direction — implied volatility below delivered movement means sellers are underpaid, and an IV rank of 23 means buyers aren't getting a bargain either, just a fairly-to-thinly priced option on a fund that gapped 16.7% in one session six days ago. If you don't have a firm view on whether the $128.96–$130 ceiling breaks this week, the honest answer is that the edge isn't there, and a 3x leveraged fund is an expensive place to find out you were guessing.
6 · Quick FAQ
What is SOXL's expected move this week? ±$15.71, or ±12.70%, into the September 25 expiration — a $107.96 to $139.38 range around Friday's $123.67 close, based on straddle pricing as of September 18.
Is SOXL expected to go up or down over the next five days? Options positioning as of September 18 leans mildly bullish — short-dated sentiment is strongly call-tilted and put open interest fell by 27,840 contracts in a single session — but that's a read of what traders have already done, not a forecast. The actionable map is the $107.96–$139.38 range, the $130 call wall, the $100 put wall, and the $118 line that invalidates the read.
Are SOXL options expensive right now? Two lenses, same answer. IV rank of 23/100 says option prices are lower than 77% of the past year's readings. On top of that, they're running about 6.9 vol points below the movement SOXL has actually delivered over the past 20 days — a gap that's still richer than 59% of this stock's own recent readings, because negative is this fund's normal state. Net: buying defined-risk premium is the cleaner side of the trade this week.
Where is SOXL's biggest options support and resistance? For the September 25 expiration, the put wall is $100.00 (4,427 contracts open) and the call wall is $130.00 (7,401 contracts open). Both match the whole chain's heaviest strikes, which is unusual and makes them more meaningful than usual.
What invalidates this week's read? A close below $118 — the September 25 max-pain strike, and the same level both chart models name as their bullish-scenario invalidation.
Methodology & disclosures. Data: end-of-day options-chain snapshot for SOXL, 2026-09-18, generated 2026-09-20T17:49:12.173Z. Prices shown are midpoints and will differ from live markets. Momentum/positioning scores and volatility-premium comparisons are descriptive measurements of past option flow and past price movement — not investment advice, signals, forecasts, or guarantees. All trade structures are hypothetical. Every structure shown has a defined maximum loss; you can lose the entire max-loss amount. Options involve substantial risk and are not suitable for all investors.