SOXS Options Are Pricing a $20 Move Into November 13: Our Read Leans Slightly Lower
After a 36% five-day surge and a 19% gap down on Friday, SOXS options imply a $50.87–$91.03 range into the November 13 expiration. Front-week put building and two bearish chart reads tilt our view slightly lower, with $73.30 as the line that cancels it.
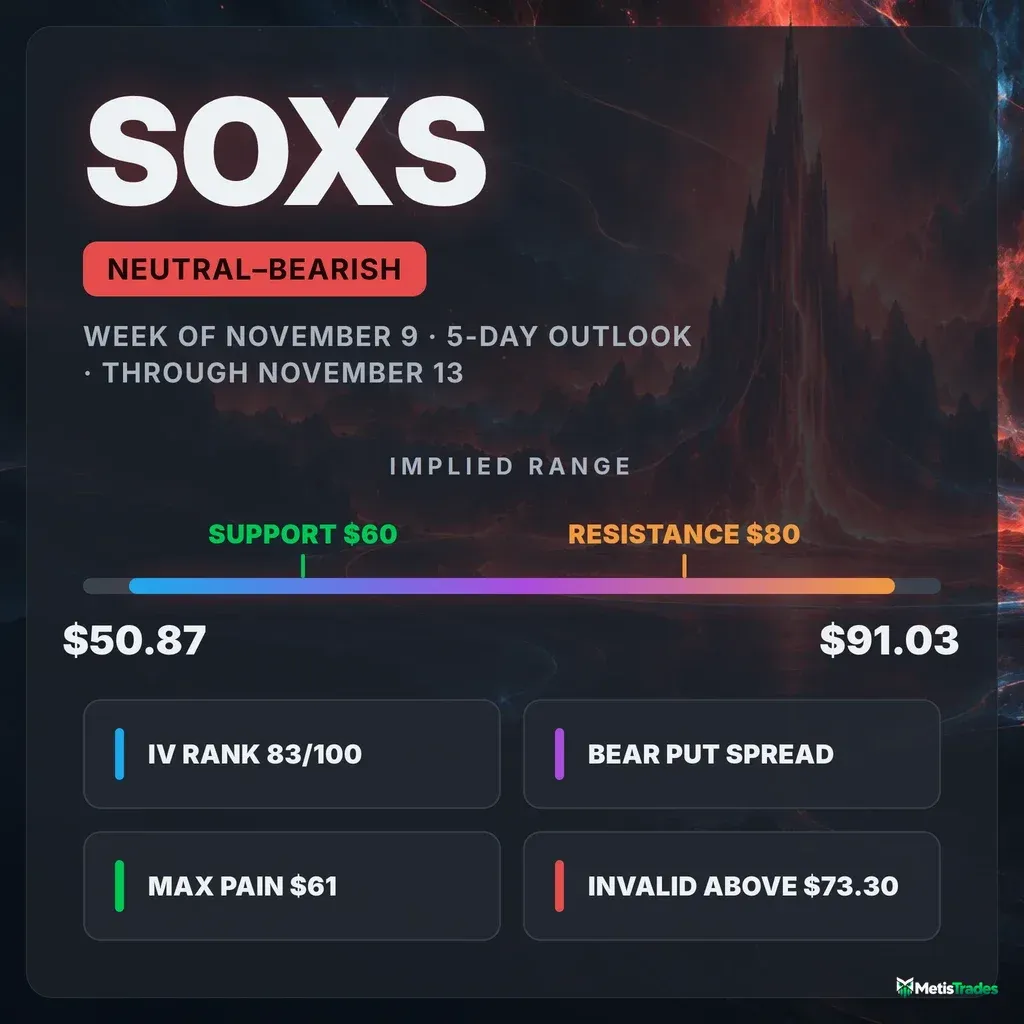
The options market implies a $50.87–$91.03 range into the November 13 expiration. Here's what's driving it, where the key levels sit, and three defined-risk ways to trade it.
Published Sunday, November 8, 2026 · Data as of Friday, November 6, 2026 close
Explore the live SOXS options data in the Detailed Options Analyzer →
Quick answer
| Item | Answer |
|---|---|
| Market bias | Slightly bearish (neutral with a bearish tilt) |
| Options-implied range (into Nov 13) | $50.87 – $91.03 (±28.30%, ±$20.08) |
| Major support | $60 (Nov 13 put wall); max pain $61 just above |
| Major resistance | $80 (Nov 13 call wall, also the whole chain's heaviest call strike) |
| Max pain (Nov 13) | $61 |
| Dealer gamma regime (estimate) | Positive: hedging tends to dampen moves; flip level ≈ $43 |
| Volatility condition | Rising. IV rank 83/100 · premium thin: options priced ~10 vol pts below delivered movement |
| Technical check | Confirms (bearish, 4-day target $68.50, range $67.00–$72.00; 6-day target $68.20, range $66.00–$73.00) |
| Best-fitting strategy | Nov 13 $70/$60 bear put spread (debit), if SOXS fails to reclaim $73.30 |
| Analysis invalidated if | SOXS closes above $73.30 |
1 · What matters today
SOXS just had a violent week. It ran 36% in five sessions, peaked at $81.22 on November 5, then gapped 19% lower on Friday before closing at $70.95. Options traders are bracing for more of the same. The straddle market, meaning the price of buying a call and a put at the same strike, implies a move of roughly $20 in either direction by the November 13 expiration, a range of $50.87 to $91.03.
Inside that wide band, our read leans slightly lower. Traders piled into puts expiring this week, and the heaviest strike positioning for November 13 sits below the stock, with the put wall at $60 and max pain at $61. Both chart models we track also lean bearish.
The level that changes the picture is $73.30. A close above it means buyers have regained control of the consolidation zone, and the tilt is off.
2 · What the options market is pricing
What changed this week
The headline is price. SOXS rose 36.2% over five trading days and 106% over twenty. Then on Friday it opened at $65.42, down from Thursday's $81.22 close, and recovered to $70.95.
Options got sharply more expensive along the way. At-the-money implied volatility rose 26% over five sessions and is up 58% over thirty.
The put/call open-interest ratio compares put contracts held open with calls. It drifted from about 0.27 to 0.21, meaning there are now roughly 21 puts open for every 100 calls. That is below both its 7-day average (0.27) and 14-day average (0.29). Read one way, that is a call-heavy chain. Treat the multi-day path with some caution, though, because a vendor coverage change inflated chain-wide open interest on November 5.
Friday itself told a different story. Call open interest fell by about 7,700 contracts while put open interest rose by about 2,400. The short-dated end saw the sharpest swing: puts expiring within a week added roughly 4,600 contracts against about 1,000 calls.
The single biggest forward-looking build was in the November 13 $80 calls, which grew from 195 to 856 contracts. That cemented $80 as this week's ceiling. Into Friday's expiration, the November 6 $80 calls added 1,700 contracts; that position has since settled and is history.
The short-, medium- and long-term trend reads all still point upward, and a fresh bullish momentum crossover printed on November 5. The trend backdrop is intact. What turned on Friday is the front-week flow.
Expected move
The expected move is the move the options market is pricing in, derived from what straddles cost. For the November 13 expiration it is ±$20.08, or ±28.30% of the $70.95 spot. That is an enormous one-week band, even for a leveraged fund.
| Expiration | Implied move | Range around $70.95 |
|---|---|---|
| Nov 13 | ±28.30% | $50.87 – $91.03 |
| Nov 20 | n/a | Quote quality was too poor to price that rung |
| Nov 27 | ±45.88% | $38.40 – $103.50 |
| Dec 4 | ±51.54% | $34.38 – $107.52 |
The ladder widens roughly with the square root of time. There is no hump at any single date, so the market is pricing persistent turbulence rather than one scheduled event.
Volatility
Implied volatility (IV) is the market's estimate of how much SOXS will move, baked into option prices. At-the-money IV sits at 185.11%. That is far above its 30-day average of about 117% and its 90-day average of about 142%.
IV rank shows where today's IV sits versus the past year. At 83/100, options are pricier than 83% of the past year's readings, and the IV percentile of 87 says the same thing. The comparison of near-term and longer-dated option prices is unavailable today because Friday was an expiration day.
Two "vs its own norm" readings stand out. These compare today against SOXS's own recent history, so "unusually high" means unusual for SOXS, not versus the broader market.
- Twenty-day realized volatility, near 195%, is running well above what is normal for this fund.
- The past five sessions have been moving markedly faster than the past month as a whole.
Premium rich or cheap? The volatility risk premium is the gap between how much movement options are priced for and how much SOXS has actually delivered. When it's positive, option sellers have been collecting more than realized movement cost them.
Right now it is negative. Options are priced about 10 vol points below what SOXS has delivered over the past 20 days. That gap sits at the 39th percentile, meaning it is richer than only about 39% of this fund's own recent readings.
The gap was slightly positive early in the week and flipped negative from November 4 as the wild daily swings piled into the realized-volatility window. That flip is mechanical, not a trader signal, but it matters for trade selection.
Put together, a high IV rank plus premium that is thin relative to delivered movement does not favor collecting premium this week. "Expensive" options are still cheap relative to how hard this fund has been swinging, which is why the debit structures lead below.
Skew and sentiment
Skew means puts and calls the same distance from the stock price don't cost the same. When puts are pricier, traders are paying up for protection against a drop.
The headline skew reading isn't available today because the expiring chain lacked a clean 25-delta call. Normally puts run about 10.5 vol points over calls for SOXS. In the 7–30 day expirations, however, puts are priced roughly 92 vol points richer relative to calls than their usual baseline. That is a stretched premium for downside coverage.
Volume tells a mixed story. The put/call volume ratio, which measures put activity relative to calls (above 1 means puts dominate), was 0.43. That is close to its 7-day average of 0.41 and below its 14-day average of 0.55, so calls still dominate traded volume.
The positioning shift shows up by expiration date:
- 0–7 day bucket: scored strongly bearish. Its regime label, "Bearish Capitulation," reflects aggressive front-end put demand.
- 8–30 day bucket: mildly bearish.
- 30–60 day bucket: leaned firmly bullish.
In plain English, traders are hedging or betting on a near-term pullback while longer-dated money stays constructive. Friday's one-day shift toward new put contracts was unusually large for this fund.
The key levels map
| Level | Price | Why it matters |
|---|---|---|
| Nov 5 close / gap top | $81.22 | Peak before Friday's gap down; top of the unfilled gap |
| Call wall (Nov 13 and whole chain) | $80 | Heaviest call open interest at both scopes; the week's ceiling |
| Chart resistance (TA) | $73.60 | Top of the post-spike consolidation per the technical models |
| Swing resistance | $73.30 | Heuristic pivot cluster; this article's invalidation level |
| Largest gamma strike | $73 | Most gamma-weighted open interest; a potential magnet |
| Spot (Nov 6 close) | $70.95 | Sitting inside a dense gamma cluster at $70–$72 |
| EMA34 (TA support) | $64.84 | The chart models' next dynamic support |
| Swing support | $61.60 | Heuristic pivot cluster just above max pain |
| Max pain (Nov 13) | $61 | Where the most Nov 13 option value expires worthless |
| Put wall (Nov 13) | $60 | Heaviest put open interest for this week's expiration |
| Whole-chain put wall | $55 | Mostly from the Nov 6 expiration, now settled; weaker going forward |
| Swing supports | $55.69 / $54.38 / $52.52 | Stacked pivot levels below the put wall |
| 20-day moving average | $50.01 | Shows how stretched price is after the run |
| 50-day moving average | $44.13 | Longer trend anchor |
| Gamma flip (estimate) | $43 | One rough estimate of where dealer hedging turns destabilizing |
Positioning and unusual flow
Market makers hedge the options they've sold. One rough estimate puts dealers in a positive-gamma regime, where their hedging tends to dampen moves. That holds for the whole chain and for the November 13 expiration on its own.
The gamma flip level is the price below which market-maker hedging tends to accelerate selling rather than cushion it. The estimate puts it around $43, and spot sits farther above it than usual for SOXS. Combined with the heavy gamma cluster at $70–$73, that favors chop and pinning over a free-fall, at least near current prices.
Notable live flow:
- December 24 $78 calls: 4,866 contracts, about $7.7 million in premium, on a strike with no prior open interest. A large, longer-dated upside bet that fits the constructive 30–60 day read.
- November 13 $66 puts: 583 contracts traded against just 21 open, a fresh near-term downside position sitting between spot and max pain.
- November 13 $60 puts: open interest rose from 140 to 382, building the put wall that anchors this week's floor.
3 · Technical check
Both chart models lean bearish, and both targets sit comfortably inside the options-implied range. That classifies as Confirms.
- Near-term model (4-day horizon, checkpoint November 11): targets $68.50 with a $67.00–$72.00 range.
- 6-day model (through November 13): targets $68.20 with a $66.00–$73.00 range.
The decisive reads in both write-ups are a bearish MACD crossover with a widening negative histogram, and ADX falling from 46 while the bull/bear directional lines converge. In other words, the impulsive up-leg has lost steam. As the technical write-up notes, SOXS is a 3x inverse leveraged ETF, and sharp spikes in such funds tend to mean-revert.
Both models flag $73.60 as the line whose break would flip them toward a bullish flag breakout. That sits right beside our $73.30 invalidation.
Model vs. Market: The options market implies $50.87–$91.03 into November 13; the 6-day technical model targets $68.20. The direction agrees, but the market is pricing a band roughly six times wider than the model's $66–$73 range. Expect noise, and size any directional bet so a swing to either rail doesn't hurt.
The TA confirmation shaded strike selection: the bear put spread's long leg sits at $70, just under spot, so the models' $68 target already puts it in profit.
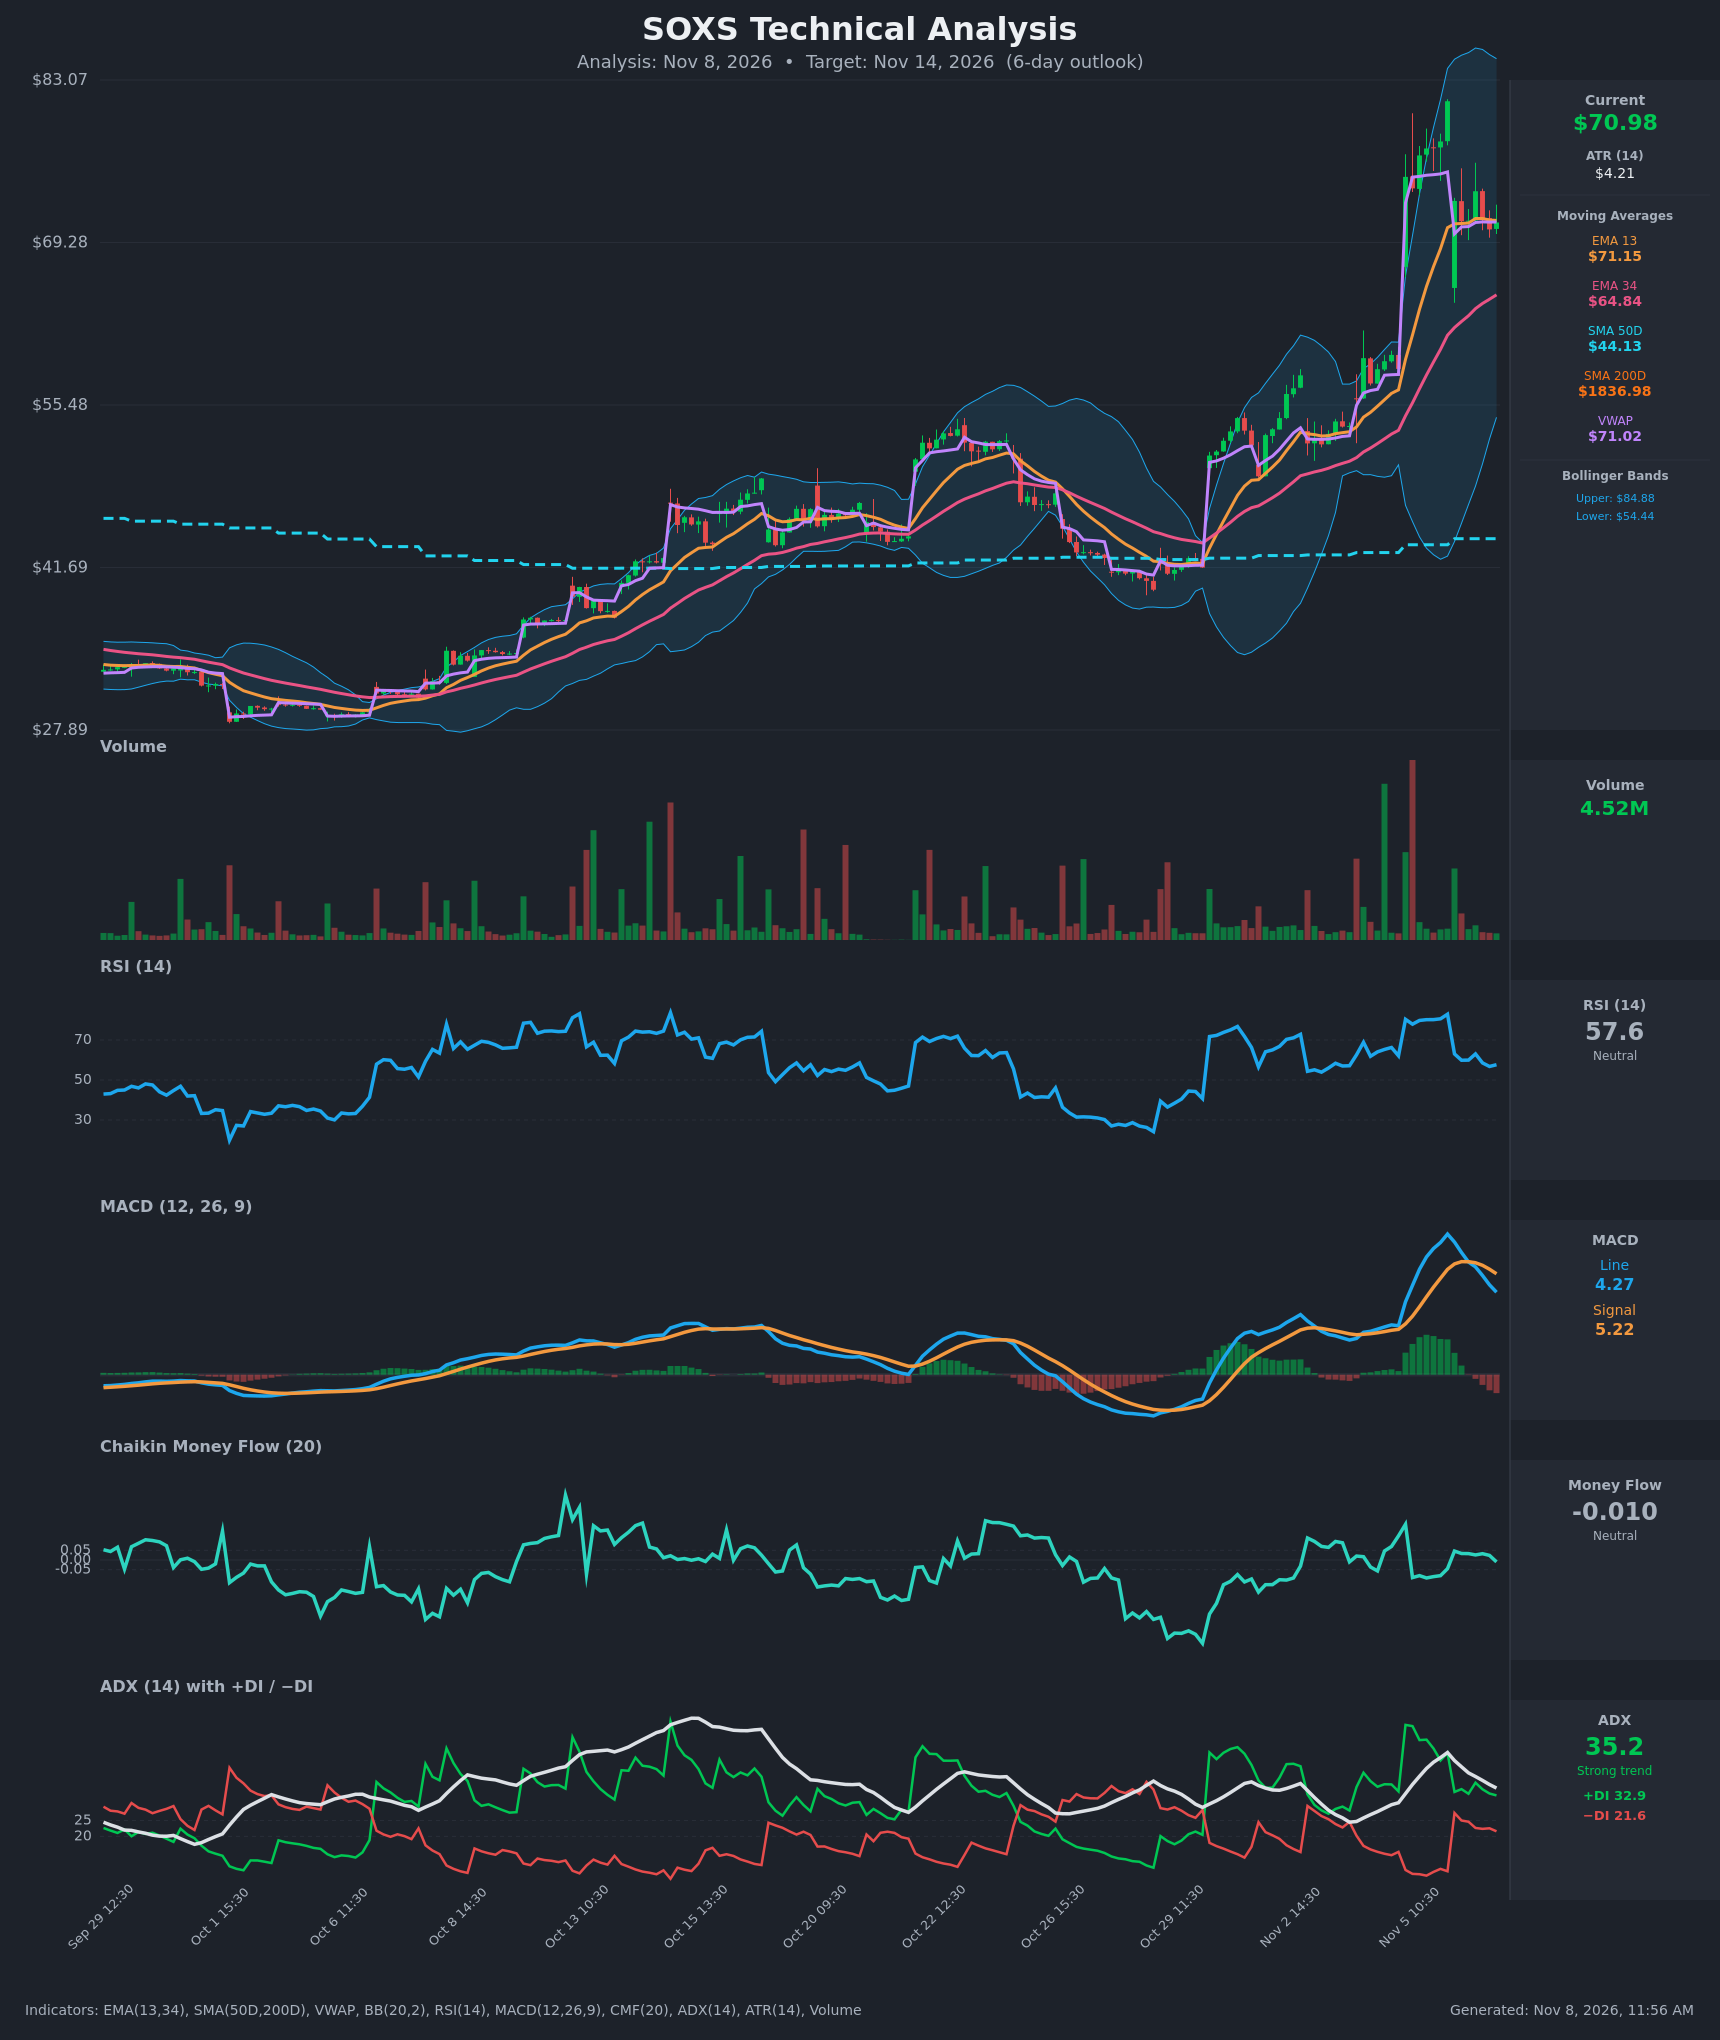
Full technical write-ups: Near-term (4-day) report → · 6-day report →
4 · Three ways the week can go
If SOXS pushes above the call wall ($80): The heaviest call open interest overhead, 856 contracts for November 13 and nearly 38,000 across the chain, tends to slow rallies as hedgers sell into strength. A clean close above it would put price back near the $81.22 gap top, with thinner positioning beyond. Our tilt would already have been invalidated at $73.30 on the way up.
If SOXS drifts between the walls: This is the pin case. The dense gamma cluster between $70 and $73 and the positive-gamma estimate tend to keep price oscillating. As expiration nears, max pain at $61 exerts a mild downward pull. A grind from the low $70s toward the mid-to-high $60s, where both chart targets sit, fits this branch.
If SOXS breaks below the put wall ($60): Once through $60 and max pain at $61, support thins to swing levels at $55.69, $54.38 and $52.52. One rough estimate places the gamma flip far lower, near $43. Dealer hedging would likely still cushion rather than amplify selling, but price would sit in the lower third of the implied range with little positioning to lean on.
5 · Three defined-risk structures
Prices are end-of-day midpoints as of November 6, 2026. All structures are hypothetical. Verify live prices before trading; these will be stale by the open.
Because premium is thin relative to how much SOXS has actually been moving, the debit structures come first. Every leg below trades with a wide bid-ask spread, well over 5% of the mark. Use limit orders near the midpoint and expect some slippage.
If you lean bearish: Nov 13 $70/$60 bear put spread
- Trade: Buy the Nov 13 $70 put, sell the Nov 13 $60 put. This is a debit spread: you pay up front and profit if SOXS falls toward $60.
- Debit: $5.02 ($7.82 − $2.81) · Max profit: $498 · Max loss: $502 · Break-even: $64.98
- Why it fits: It matches this week's put building and the stretched put premium in the 8–30 day options. The short strike sits on the $60 put wall, just under the $61 max pain. Owning premium also suits a market where options are priced below delivered movement.
- Makes sense only if: SOXS stays below the $73.30 swing resistance and front-week put demand persists.
- Invalidated if: SOXS closes above $73.30.
- Managing it: Take profits around 50–60% of max gain, roughly when SOXS reaches the mid-$60s. Exit by the November 11 checkpoint if price hasn't moved below $70. Close immediately on a close above $73.30.
- Liquidity note: The $70 puts quoted $7.00/$8.65 ($1.65 wide) and the $60 puts $2.62/$3.00 (38¢ wide). The long leg is the slippage risk, so work the order patiently.
- Analyze this position →
If you lean bullish: Nov 13 $70/$80 bull call spread
- Trade: Buy the Nov 13 $70 call, sell the Nov 13 $80 call. You pay a debit and profit if SOXS climbs toward the $80 call wall.
- Debit: $3.63 ($8.95 − $5.33) · Max profit: $637 · Max loss: $363 · Break-even: $73.63
- Why it fits: The short-, medium- and long-term trend reads all still point up, and longer-dated call money is building. Capping the trade at the $80 call wall sells the strike most likely to slow a rally.
- Makes sense only if: SOXS reclaims $73.30–$73.60, which flips both our tilt and the chart models.
- Invalidated if: SOXS closes below $64.84.
- Managing it: This is a counter-tilt trade, so keep size small. Take profits near $78–$80 and exit by November 11 if no breakout above $73.60 has occurred.
- Liquidity note: The $70 calls quoted $1.50 wide and the $80 calls 65¢ wide. These are among the most active strikes for the week.
- Analyze this position →
If you expect the range to hold: Nov 13 $59/$60/$80/$83 iron condor
- Trade: Sell the $60 put and buy the $59 put. Sell the $80 call and buy the $83 call. All legs expire Nov 13. This is a credit structure: you collect premium and keep it if SOXS stays between the walls.
- Credit: $0.98 · Max profit: $98 · Max loss: $202 (call side; the $1-wide put side risks only $2) · Break-evens: $59.02 and $80.98
- Why it fits: The short strikes sit exactly on the November 13 put and call walls. The positive-gamma estimate favors containment.
- Health warning: You're selling premium that hasn't been rich lately. SOXS has been delivering more movement than options price in, and the ±$20 expected move puts both short strikes inside the one-standard-deviation band.
- Makes sense only if: Volatility starts to cool and price holds the $70–$73 gamma cluster.
- Invalidated if: SOXS closes above $80 or below $60.
- Managing it: Close at 50% of the credit. Close the call side if SOXS closes above $77, and don't carry the position into the final session if price is within $2 of either wall.
- Liquidity note: The $83 calls ($3.40/$6.10) and $59 puts ($2.00/$2.81) are wide. Fills could consume much of the $0.98 credit.
- Analyze this position →
If none of these: no trade
Standing aside is a genuinely strong option this week, for three reasons:
- The implied move is ±28% in five trading days.
- Every strike trades double-digit-percent wide, so slippage eats a meaningful slice of any edge.
- Our directional tilt is a lean, not a conviction.
Credit structures look tempting with IV rank at 83, but the premium is thin against what SOXS has actually been delivering. If you can't watch the position daily, or can't stomach a 19% overnight gap like Friday's, waiting for volatility to settle is the disciplined choice.
6 · Quick FAQ
What is SOXS's expected move this week? About ±$20.08 (±28.30%) into the November 13 expiration, a $50.87–$91.03 range per straddle pricing as of the November 6 close.
Is SOXS expected to go up or down over the next week? Options positioning as of November 6 leans slightly bearish, driven by heavy front-week put building and a put wall and max pain below spot. That's a read of what traders have done, not a forecast. The actionable map is the $50.87–$91.03 range and the $60/$80 levels.
Are SOXS options expensive right now? IV rank of 83/100 says option prices are higher than 83% of the past year's readings. Yet they're running about 10 vol points below the movement SOXS has actually delivered, richer than only 39% of this fund's own recent readings. In other words, they're high in absolute terms but thin relative to the fund's swings.
Where is SOXS's biggest options support and resistance? The put wall is at $60 (max pain $61) and the call wall at $80 for the November 13 expiration.
What invalidates this week's read? A close above $73.30.
Methodology & disclosures. Data: end-of-day options-chain snapshot for SOXS, 2026-11-06, generated 2026-11-08T11:56:52.165Z. Prices shown are midpoints and will differ from live markets. Momentum/positioning scores and volatility-premium comparisons are descriptive measurements of past option flow and past price movement — not investment advice, signals, forecasts, or guarantees. All trade structures are hypothetical. Every structure shown has a defined maximum loss; you can lose the entire max-loss amount. Options involve substantial risk and are not suitable for all investors.